Home > Comparison > Technology > ORCL vs ADBE
The strategic rivalry between Oracle Corporation and Adobe Inc. shapes the technology sector’s software infrastructure landscape. Oracle, a capital-intensive enterprise IT powerhouse, contrasts with Adobe’s high-margin, diversified software model focused on creative and digital experience solutions. This face-off highlights a battle between scale-driven cloud infrastructure and innovation-led content platforms. This analysis will identify which company presents a superior risk-adjusted opportunity for investors seeking durable growth and portfolio resilience in 2026.
Table of contents
Companies Overview
Oracle Corporation and Adobe Inc. stand as pivotal leaders shaping the software infrastructure landscape.
Oracle Corporation: Enterprise IT Powerhouse
Oracle dominates enterprise IT with a broad portfolio that includes cloud software applications and infrastructure technologies. Its primary revenue stems from cloud software as a service, licenses, and hardware systems. In 2026, Oracle focuses strategically on expanding its autonomous database and cloud computing capabilities to strengthen its competitive advantage in enterprise solutions.
Adobe Inc.: Creative and Digital Experience Leader
Adobe excels as a diversified software provider, generating revenue mainly from its Digital Media and Digital Experience segments. Creative Cloud subscriptions and integrated marketing platforms drive its growth. In 2026, Adobe prioritizes enhancing customer experience tools and expanding its market position in digital content creation and analytics.
Strategic Collision: Similarities & Divergences
Both companies operate in software infrastructure but differ fundamentally: Oracle emphasizes a closed ecosystem built around enterprise IT, while Adobe champions an open platform for creative and marketing professionals. Their primary battleground is cloud-based software services targeting distinct customer bases. Oracle offers a more capital-intensive, hardware-integrated profile; Adobe presents a subscription-driven, innovation-focused investment story.
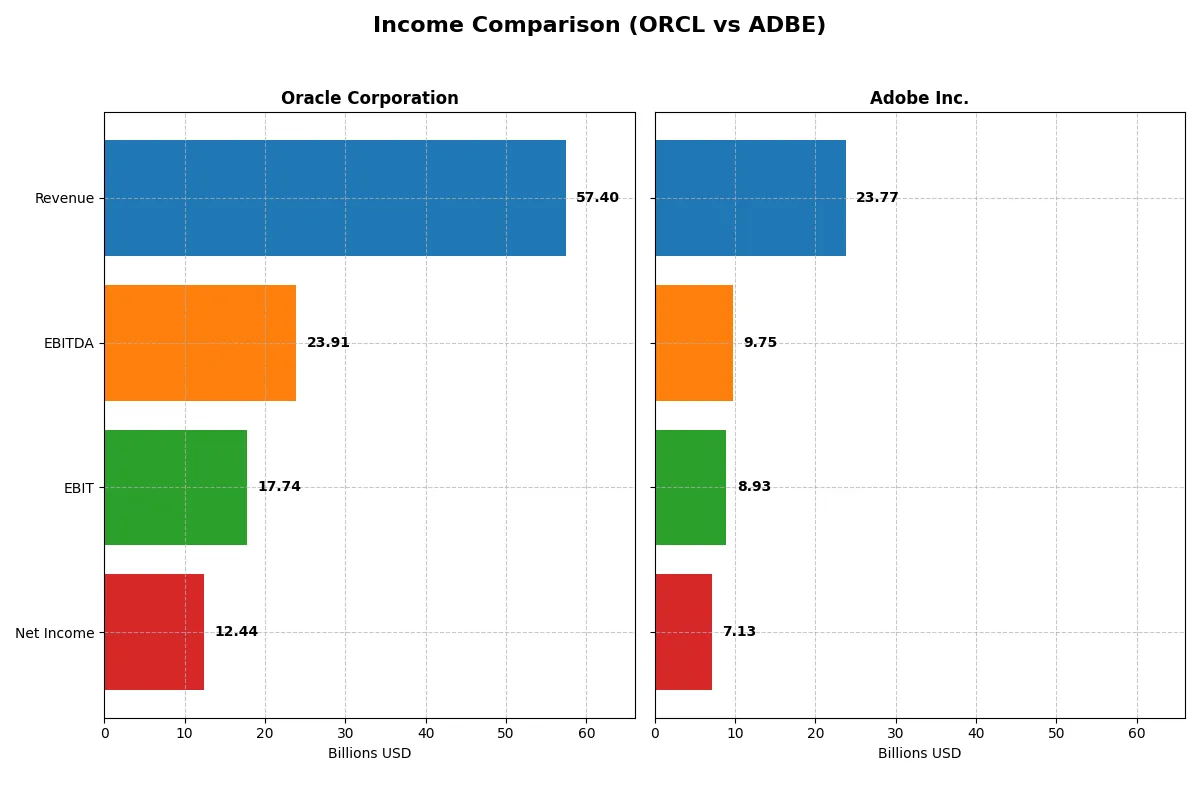
Income Statement Comparison
This data dissects the core profitability and scalability of both corporate engines to reveal who dominates the bottom line:
| Metric | Oracle Corporation (ORCL) | Adobe Inc. (ADBE) |
|---|---|---|
| Revenue | 57.4B | 23.8B |
| Cost of Revenue | 16.9B | 2.7B |
| Operating Expenses | 22.8B | 12.4B |
| Gross Profit | 40.5B | 21.1B |
| EBITDA | 23.9B | 9.7B |
| EBIT | 17.7B | 8.9B |
| Interest Expense | 3.6B | 0.3B |
| Net Income | 12.4B | 7.1B |
| EPS | 4.46 | 16.73 |
| Fiscal Year | 2025 | 2025 |
Income Statement Analysis: The Bottom-Line Duel
This income statement comparison reveals which company operates its business more efficiently and drives stronger profitability.
Oracle Corporation Analysis
Oracle’s revenue climbs steadily, reaching $57.4B in 2025, with net income growing to $12.4B. The company maintains strong gross margins near 70.5%, showing solid cost control. Its net margin of 21.7% and EBIT margin of 30.9% reflect healthy profitability. Recent momentum shows favorable revenue and earnings growth, signaling operational efficiency gains.
Adobe Inc. Analysis
Adobe posts revenue of $23.8B in 2025, with net income at $7.1B. It sustains an exceptional gross margin of 88.6%, a testament to its high-value software offerings. The net margin stands at 30%, and EBIT margin hits 37.6%, indicating superior profitability. Adobe’s one-year revenue and earnings growth outperform Oracle, reflecting strong momentum in innovation and market expansion.
Margin Strength vs. Growth Momentum
Adobe leads on margin efficiency and faster earnings growth, while Oracle delivers larger scale and solid profitability improvements. Adobe’s higher net margins and EPS growth make it attractive for investors seeking robust profit expansion. Oracle’s scale and consistent margin health appeal to those valuing steady operational leverage.
Financial Ratios Comparison
These vital ratios act as a diagnostic tool to expose the underlying fiscal health, valuation premiums, and capital efficiency of the companies compared below:
| Ratios | Oracle Corporation (ORCL) | Adobe Inc. (ADBE) |
|---|---|---|
| ROE | 60.8% | 61.3% |
| ROIC | 10.9% | 36.7% |
| P/E | 37.1 | 19.1 |
| P/B | 22.6 | 11.7 |
| Current Ratio | 0.75 | 1.00 |
| Quick Ratio | 0.75 | 1.00 |
| D/E | 5.09 | 0.57 |
| Debt-to-Assets | 61.8% | 22.5% |
| Interest Coverage | 4.94 | 33.1 |
| Asset Turnover | 0.34 | 0.81 |
| Fixed Asset Turnover | 1.32 | 10.9 |
| Payout Ratio | 38.1% | 0.0% |
| Dividend Yield | 1.03% | 0.00% |
| Fiscal Year | 2025 | 2025 |
Efficiency & Valuation Duel: The Vital Signs
Financial ratios act as a company’s DNA, exposing hidden risks and highlighting operational strengths that drive shareholder value.
Oracle Corporation
Oracle posts a robust 60.8% ROE and a solid 21.7% net margin, signaling strong profitability. Yet, its P/E of 37.1 and P/B of 22.6 paint an expensive valuation, stretched relative to typical tech benchmarks. The stock yields a modest 1.03% dividend, balancing capital returns with reinvestment in R&D (17.2% of revenue).
Adobe Inc.
Adobe delivers an impressive 61.3% ROE and a 30% net margin, reflecting operational efficiency. Its P/E at 19.1 suggests a fairly priced stock, though the P/B of 11.7 remains on the high side. Adobe opts out of dividends, channeling cash into growth and innovation, with R&D at 18.1% of revenue and strong free cash flow.
Premium Valuation vs. Operational Safety
Adobe offers a better valuation with higher operational returns and less leverage, presenting a more balanced risk-reward profile. Oracle’s high leverage and stretched multiples raise caution. Growth-focused investors may prefer Adobe’s reinvestment strategy, while income seekers might lean toward Oracle’s modest yield.
Which one offers the Superior Shareholder Reward?
I compare Oracle and Adobe’s shareholder return strategies. Oracle delivers a 1.03% dividend yield with a moderate 38% payout ratio, balancing dividends and buybacks. Adobe pays no dividends but reinvests heavily, generating 23.1B in free cash flow and sustaining robust buybacks. Oracle’s dividend sustainability is challenged by high leverage and negative free cash flow per share in 2025. Adobe’s low debt (23% debt-to-assets) and strong free cash flow coverage support ongoing buybacks and growth. I find Adobe’s reinvestment and buyback model offers superior total return potential in 2026, driven by stronger cash flow and healthier leverage.
Comparative Score Analysis: The Strategic Profile
The radar chart reveals the fundamental DNA and trade-offs of Oracle Corporation and Adobe Inc., highlighting their core financial strengths and vulnerabilities:
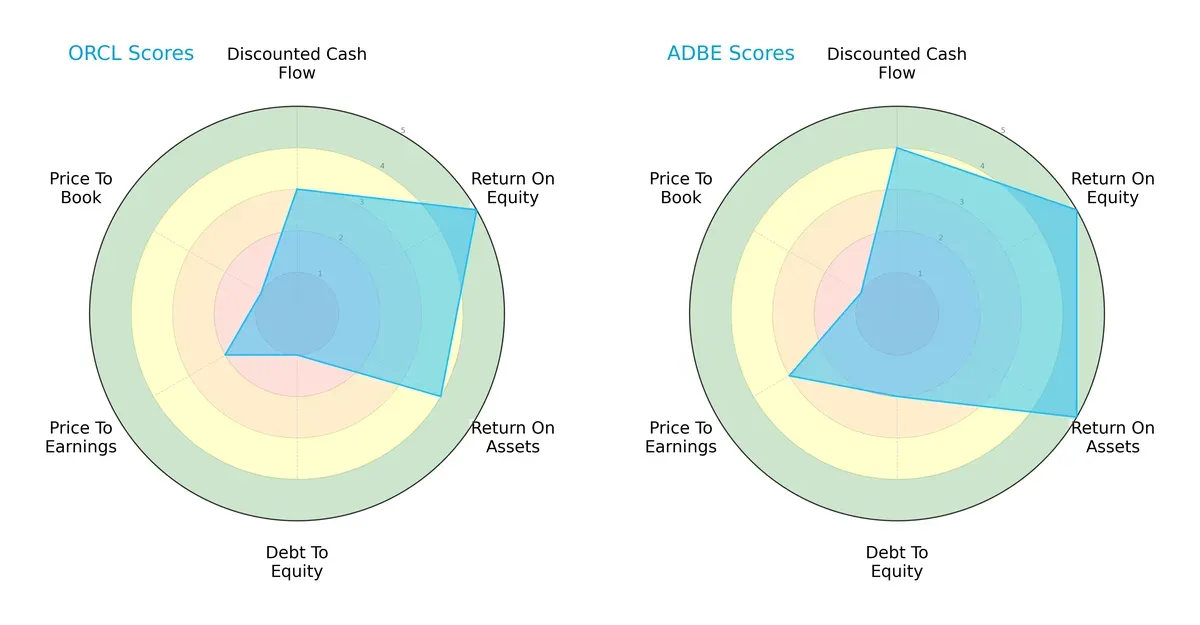
Adobe delivers a more balanced profile with favorable scores in DCF (4 vs. 3), ROA (5 vs. 4), and moderate debt-to-equity risk (2 vs. 1), signaling prudent leverage management. Oracle excels in ROE (5 each) but suffers from high financial risk, reflected in its very unfavorable debt-to-equity and price-to-book scores. Adobe’s moderate valuation scores suggest better market pricing discipline, whereas Oracle relies heavily on equity efficiency.
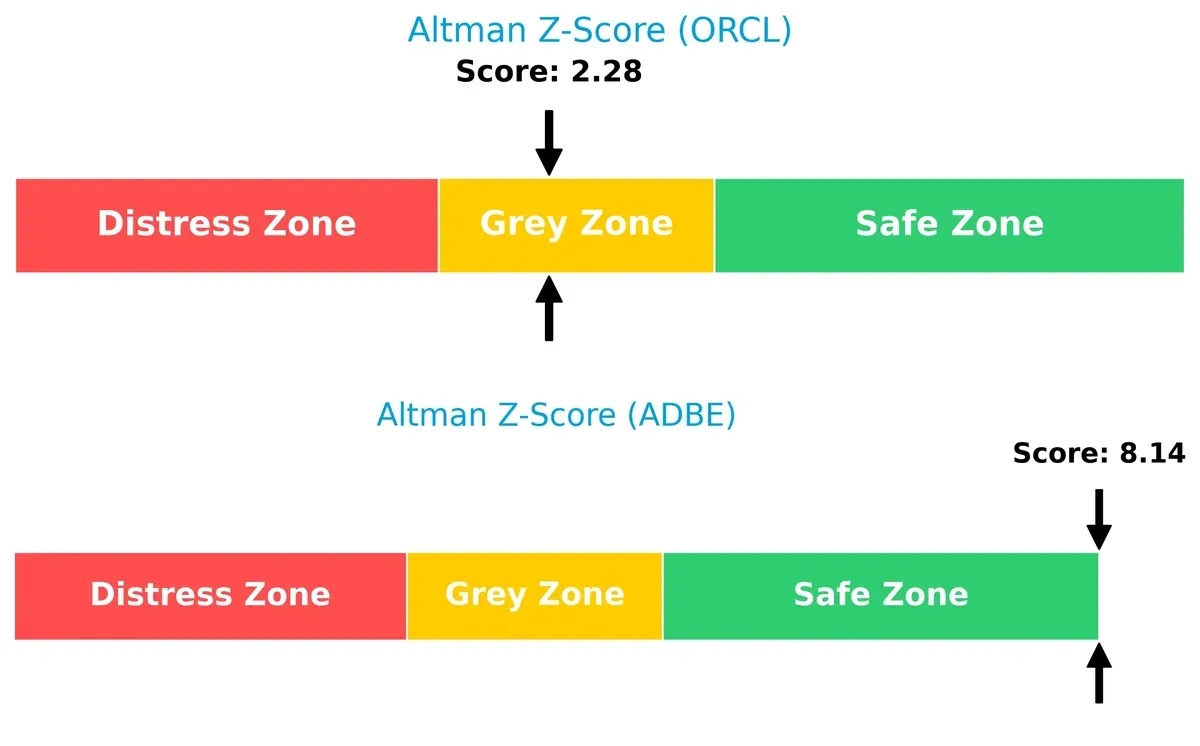
Bankruptcy Risk: Solvency Showdown
Adobe’s Altman Z-Score at 8.14 firmly positions it in the safe zone, indicating robust solvency and long-term survival prospects. Oracle’s 2.28 score places it in the grey zone, signaling moderate financial distress risk in this market cycle:
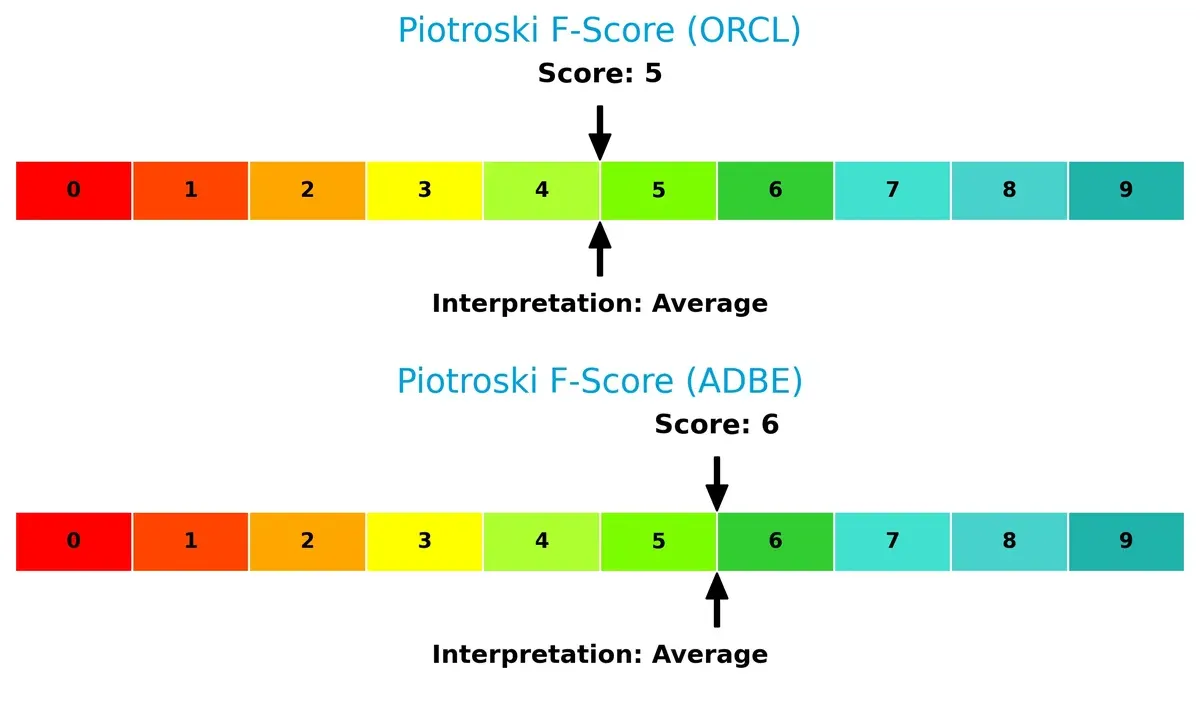
Financial Health: Quality of Operations
Adobe edges out Oracle in operational quality with a Piotroski F-Score of 6 versus 5, both in the average range. Neither shows alarming red flags, but Adobe’s slightly stronger internal metrics hint at better financial control and efficiency:
How are the two companies positioned?
This section dissects Oracle’s and Adobe’s operational DNA by comparing their revenue distribution and internal dynamics. The final goal is to confront their economic moats to identify which model offers the most resilient competitive advantage today.
Revenue Segmentation: The Strategic Mix
This comparison dissects how Oracle Corporation and Adobe Inc. diversify their income streams and where their primary sector bets lie:
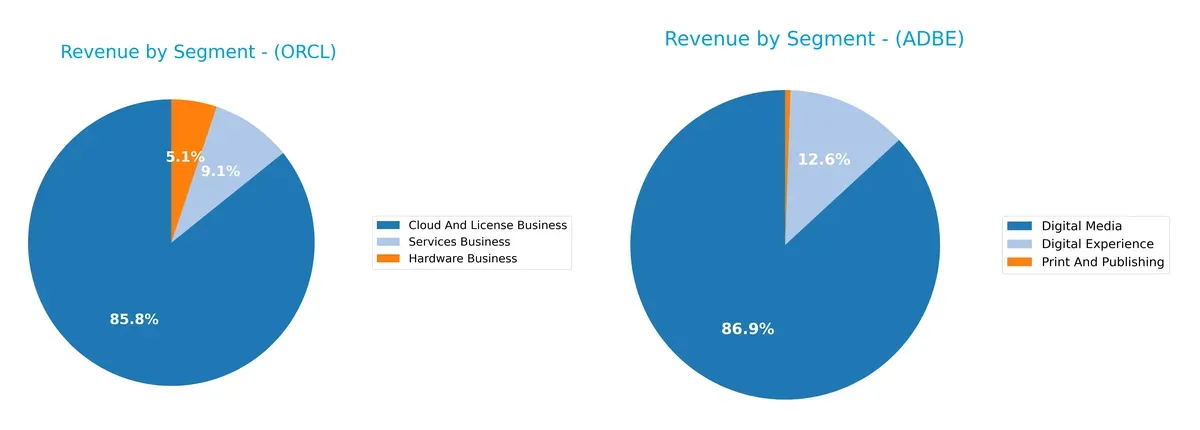
Oracle anchors its revenue in the Cloud and License Business with $49.2B in 2025, dwarfing Hardware ($2.9B) and Services ($5.2B). Adobe pivots on Digital Media, generating $40.4B, far above Digital Experience ($5.9B) and Print and Publishing ($256M). Oracle’s concentration suggests ecosystem lock-in with cloud dominance, while Adobe’s focus on creative software signals infrastructure dominance but exposes it to media segment cyclicality.
Strengths and Weaknesses Comparison
This table compares the Strengths and Weaknesses of Oracle Corporation and Adobe Inc.:
Oracle Corporation Strengths
- Diverse revenue streams across cloud, hardware, and services
- Strong global presence in Americas, EMEA, and Asia Pacific
- Favorable net margin of 21.68% and ROE of 60.84%
- Consistent growth in cloud and license business
Adobe Inc. Strengths
- High profitability with 30% net margin and 61.34% ROE
- Robust innovation reflected in 36.69% ROIC and high fixed asset turnover
- Lower debt-to-assets ratio at 22.54% and strong interest coverage
- Expanding digital media and experience segments with global sales
Oracle Corporation Weaknesses
- High leverage with debt-to-assets at 61.83% and D/E of 5.09
- Low liquidity indicated by current and quick ratio at 0.75
- Unfavorable valuation multiples with PE 37.1 and PB 22.57
- Low asset turnover of 0.34 limits operational efficiency
Adobe Inc. Weaknesses
- Moderate leverage with D/E 0.57 and current ratio at 1.0
- Unfavorable dividend yield at 0% affecting income investors
- Some valuation concerns with PB at 11.73
- WACC slightly above ROIC, pointing to capital cost challenges
Both companies show strong profitability and global footprints but differ in financial structure and operational efficiency. Oracle’s high leverage and low liquidity contrast with Adobe’s stronger balance sheet but lack of dividend yield. These factors influence their strategic focus on growth and risk management.
The Moat Duel: Analyzing Competitive Defensibility
A structural moat is the only thing protecting long-term profits from the erosion of competition. Here’s how Oracle and Adobe stack up:
Oracle Corporation: Legacy Scale and Cloud Integration Moat
Oracle’s competitive edge lies in its vast enterprise software ecosystem and integrated cloud offerings. Despite a high gross margin of 70.5%, its ROIC trails WACC, signaling declining profitability. Expansion into autonomous databases could deepen its moat if execution improves in 2026.
Adobe Inc.: Innovation-Driven Network Effect Moat
Adobe’s moat stems from dominant Creative Cloud subscriptions and strong digital media presence. It commands superior margins—88.6% gross—and boasts a ROIC well above WACC with strong growth. In 2026, Adobe’s cross-platform digital experience integration could widen its competitive lead.
Verdict: Enterprise Scale vs. Subscription Network Effects
Adobe’s rapidly growing ROIC and higher margins reveal a deeper and more durable moat than Oracle’s legacy infrastructure. Adobe is better positioned to defend and expand its market share in the evolving software landscape.
Which stock offers better returns?
The past year saw Oracle’s shares rise sharply before recent declines, while Adobe’s stock endured a prolonged downtrend with notable volatility.
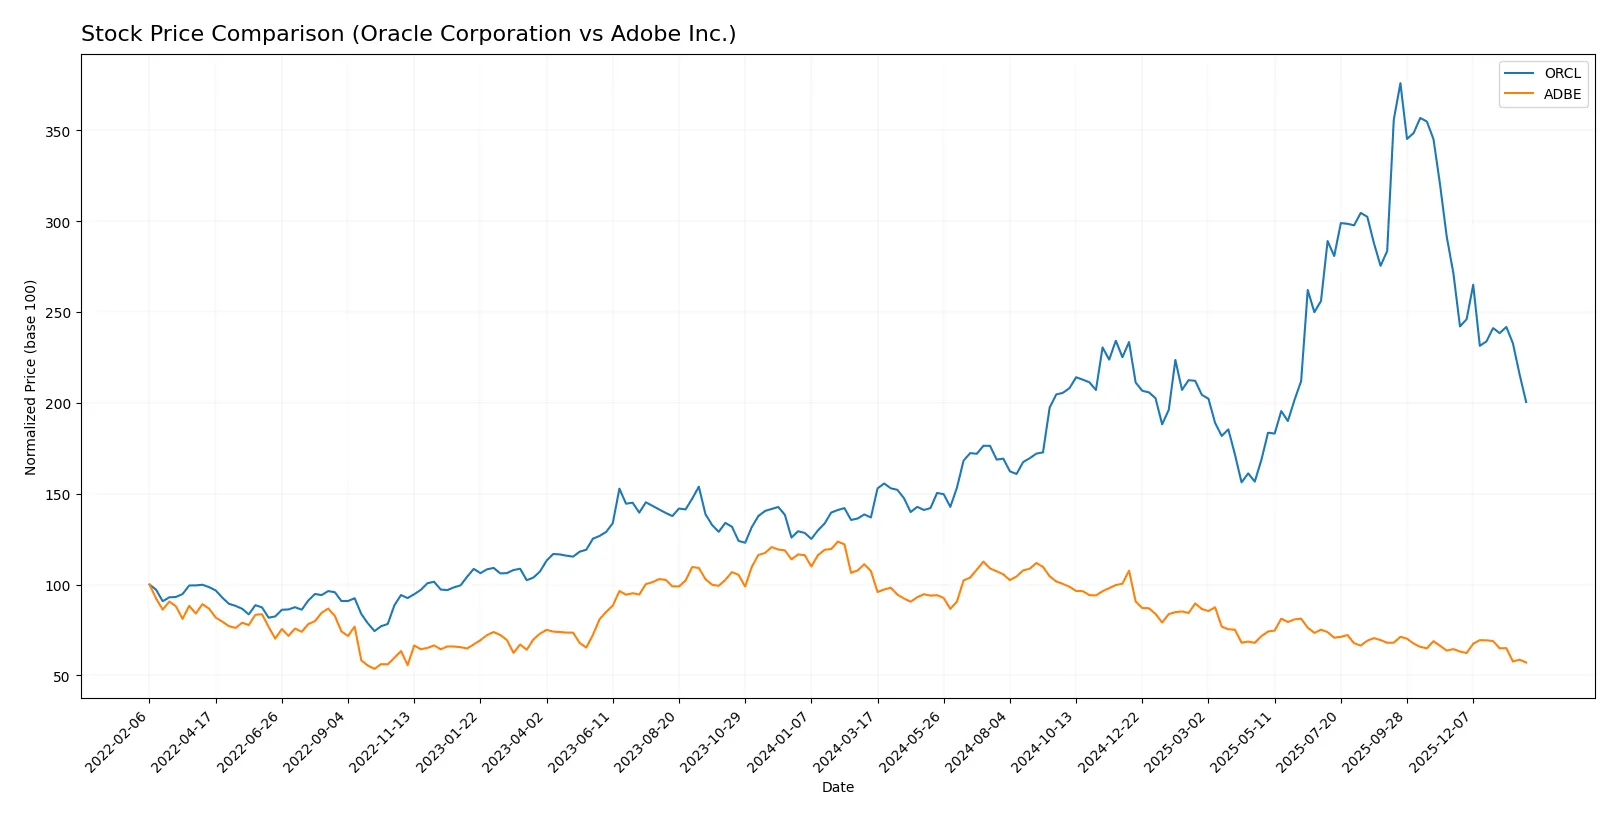
Trend Comparison
Oracle’s stock gained 46.4% over the past 12 months, marking a bullish trend with decelerating momentum. The price ranged between 112.42 and 308.66.
Adobe’s stock fell 46.85% over the same period, confirming a bearish trend with decelerating losses. The price fluctuated between 293.25 and 578.34.
Oracle outperformed Adobe significantly, delivering the highest market gains despite a recent short-term pullback since November 2025.
Target Prices
Analysts present a bullish consensus on Oracle Corporation and Adobe Inc., indicating strong upside potential.
| Company | Target Low | Target High | Consensus |
|---|---|---|---|
| Oracle Corporation | 175 | 400 | 310.33 |
| Adobe Inc. | 280 | 500 | 390.31 |
Oracle’s consensus target of 310.33 implies nearly 89% upside from its current 164.58 price. Adobe’s 390.31 target suggests a 33% gain above the present 293.25 share price.

Don’t Let Luck Decide Your Entry Point
Optimize your entry points with our advanced ProRealTime indicators. You’ll get efficient buy signals with precise price targets for maximum performance. Start outperforming now!
How do institutions grade them?
Oracle Corporation Grades
The table below summarizes Oracle’s recent institutional grades from leading firms.
| Grading Company | Action | New Grade | Date |
|---|---|---|---|
| Morgan Stanley | Maintain | Equal Weight | 2026-01-23 |
| UBS | Maintain | Buy | 2026-01-05 |
| Jefferies | Maintain | Buy | 2026-01-05 |
| RBC Capital | Maintain | Sector Perform | 2026-01-05 |
| Goldman Sachs | Maintain | Neutral | 2025-12-12 |
| BMO Capital | Maintain | Outperform | 2025-12-11 |
| JP Morgan | Maintain | Neutral | 2025-12-11 |
| DA Davidson | Maintain | Neutral | 2025-12-11 |
| UBS | Maintain | Buy | 2025-12-11 |
| Citigroup | Maintain | Buy | 2025-12-11 |
Adobe Inc. Grades
The table below summarizes the latest institutional grades for Adobe from reputable sources.
| Grading Company | Action | New Grade | Date |
|---|---|---|---|
| UBS | Maintain | Neutral | 2026-01-26 |
| Oppenheimer | Downgrade | Perform | 2026-01-13 |
| BMO Capital | Downgrade | Market Perform | 2026-01-09 |
| Jefferies | Downgrade | Hold | 2026-01-05 |
| Citigroup | Maintain | Neutral | 2025-12-17 |
| BMO Capital | Maintain | Outperform | 2025-12-15 |
| Keybanc | Downgrade | Underweight | 2025-12-15 |
| Wolfe Research | Maintain | Outperform | 2025-12-11 |
| TD Cowen | Maintain | Hold | 2025-12-11 |
| Oppenheimer | Maintain | Outperform | 2025-12-11 |
Which company has the best grades?
Oracle consistently holds multiple Buy and Outperform grades from top institutions. Adobe’s recent trend shows several downgrades to Hold and Neutral. Oracle’s stronger grades may signal greater institutional confidence, potentially influencing investor sentiment positively.
Risks specific to each company
In the volatile 2026 market environment, these categories identify critical pressure points and systemic threats facing both Oracle Corporation and Adobe Inc.:
1. Market & Competition
Oracle Corporation
- Faces intense competition in cloud infrastructure and database services from AWS and Microsoft Azure, pressuring market share and pricing.
Adobe Inc.
- Competes in creative software and digital marketing platforms with firms like Microsoft and Salesforce, demanding constant innovation to maintain relevance.
2. Capital Structure & Debt
Oracle Corporation
- High leverage with debt-to-equity ratio of 5.09 signals elevated financial risk and weaker balance sheet resilience.
Adobe Inc.
- Low debt-to-equity ratio at 0.57 indicates prudent capital management and stronger capacity to withstand downturns.
3. Stock Volatility
Oracle Corporation
- Beta of 1.65 reflects above-market volatility, exposing investors to sharper price swings amid market turbulence.
Adobe Inc.
- Beta at 1.53 also signals elevated volatility, but slightly less than Oracle’s, suggesting marginally lower market risk.
4. Regulatory & Legal
Oracle Corporation
- Faces scrutiny over data privacy and antitrust issues due to its dominant database and enterprise software footprint.
Adobe Inc.
- Subject to data protection regulations globally, especially impacting its cloud and document services segments.
5. Supply Chain & Operations
Oracle Corporation
- Complex hardware and software supply chains susceptible to component shortages and geopolitical trade restrictions.
Adobe Inc.
- Primarily software-based operations reduce dependency on physical supply chains, mitigating operational disruption risks.
6. ESG & Climate Transition
Oracle Corporation
- Moderate ESG initiatives but faces pressure to reduce hardware-related carbon footprint and improve transparency.
Adobe Inc.
- Stronger ESG focus with digital services enabling lower environmental impact; ongoing push for sustainable cloud infrastructure.
7. Geopolitical Exposure
Oracle Corporation
- Significant exposure to US-China tensions affecting hardware exports and cloud service expansion in Asia.
Adobe Inc.
- Geographic diversification and software focus limit direct geopolitical risks, but global data privacy laws remain a challenge.
Which company shows a better risk-adjusted profile?
Oracle’s most impactful risk is its elevated leverage, which undermines financial flexibility amid rising interest rates. Adobe’s principal risk lies in intense competitive pressure requiring relentless innovation. Adobe’s safer balance sheet and higher Altman Z-Score affirm a better risk-adjusted profile. Oracle’s current ratio below 1 is a red flag that heightens liquidity concerns in a tightening credit environment.
Final Verdict: Which stock to choose?
Oracle’s superpower lies in its robust profitability and impressive return on equity, showcasing a legacy of operational strength. However, its heavy debt load and subpar liquidity ratios warrant vigilance. Oracle suits portfolios aiming for deep value plays with a tolerance for balance sheet risks.
Adobe stands out with a durable competitive moat, driven by high ROIC well above its cost of capital and consistent margin expansion. Its conservative leverage and stronger liquidity provide a safer profile compared to Oracle. Adobe fits well in growth-at-a-reasonable-price (GARP) portfolios seeking stability with upside.
If you prioritize resilient growth backed by a durable competitive advantage, Adobe offers a compelling choice due to its superior capital efficiency and financial health. However, if you seek aggressive value exposure with high profitability despite leverage risks, Oracle could appeal more. Both demand careful risk management aligned with your investment horizon.
Disclaimer: Investment carries a risk of loss of initial capital. The past performance is not a reliable indicator of future results. Be sure to understand risks before making an investment decision.
Go Further
I encourage you to read the complete analyses of Oracle Corporation and Adobe Inc. to enhance your investment decisions: