Home > Comparison > Technology > ADBE vs OKTA
The strategic rivalry between Adobe Inc. and Okta, Inc. shapes the future of software infrastructure. Adobe operates as a diversified software powerhouse with broad digital media and experience platforms. Okta specializes in identity management, focusing on cloud-based security solutions. This head-to-head pits a mature, integrated software leader against a high-growth security innovator. This analysis will identify which trajectory offers superior risk-adjusted returns for a diversified portfolio in the evolving tech landscape.
Table of contents
Companies Overview
Adobe Inc. and Okta, Inc. stand as pivotal players in the software infrastructure market, shaping digital transformation globally.
Adobe Inc.: Leader in Creative and Experience Software
Adobe dominates as a diversified software powerhouse serving creative professionals and enterprises. Its Creative Cloud subscription drives revenue by enabling content creation and publishing. In 2026, Adobe sharpens its focus on expanding digital experience platforms, integrating analytics and commerce to enhance customer engagement across industries.
Okta, Inc.: Specialist in Identity and Access Management
Okta stands out in identity solutions with its cloud-based Okta Identity Cloud platform. It earns revenue by securing user access through single sign-on, adaptive multi-factor authentication, and lifecycle management. In 2026, Okta emphasizes strengthening API security and passwordless authentication to meet rising cybersecurity demands.
Strategic Collision: Similarities & Divergences
Both companies operate in software infrastructure but diverge sharply: Adobe pursues a broad content and experience ecosystem, while Okta targets a focused, security-first identity platform. Their primary battleground lies in enterprise digital transformation, where secure, seamless user experiences matter most. Adobe offers scale and diversity; Okta delivers specialization and security precision. Their investment profiles reflect this strategic contrast—one broad, one niche.
Income Statement Comparison
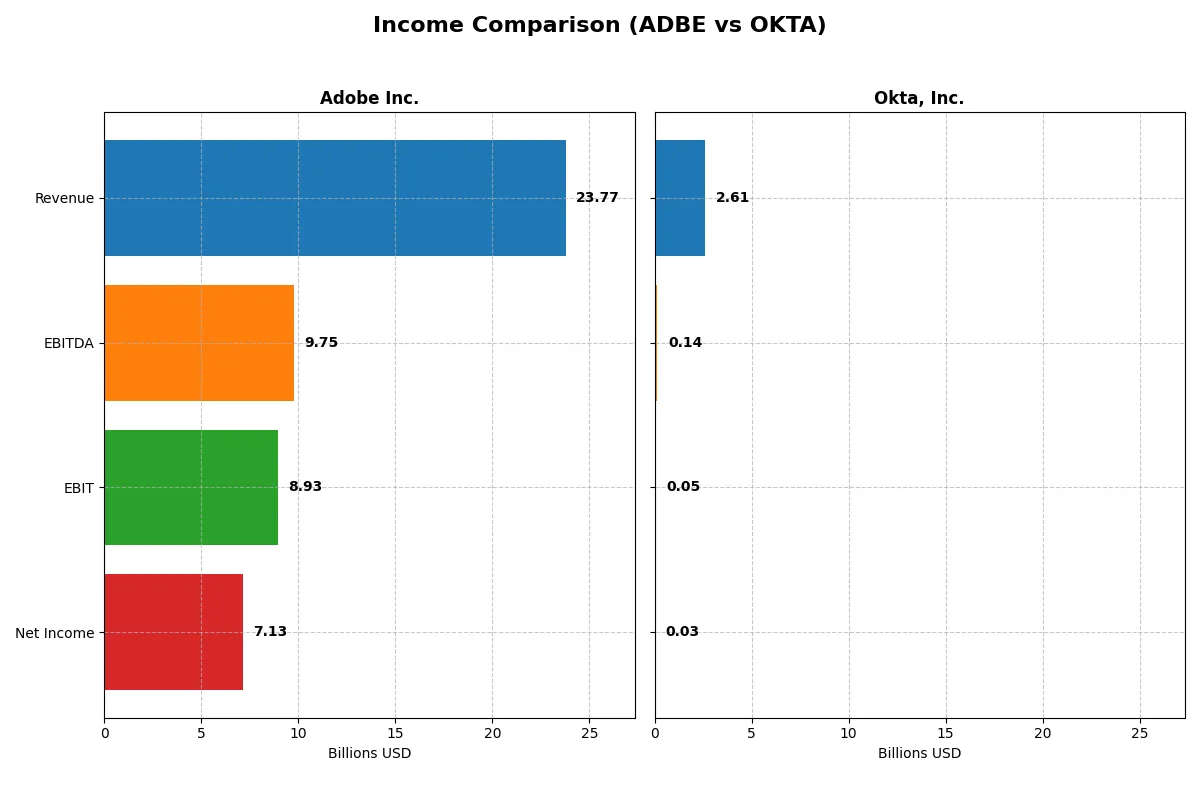
This data dissects the core profitability and scalability of both corporate engines to reveal who dominates the bottom line:
| Metric | Adobe Inc. (ADBE) | Okta, Inc. (OKTA) |
|---|---|---|
| Revenue | 23.8B | 2.61B |
| Cost of Revenue | 2.71B | 618M |
| Operating Expenses | 12.4B | 2.07B |
| Gross Profit | 21.1B | 1.99B |
| EBITDA | 9.75B | 139M |
| EBIT | 8.93B | 51M |
| Interest Expense | 263M | 5M |
| Net Income | 7.13B | 28M |
| EPS | 16.73 | 0.17 |
| Fiscal Year | 2025 | 2025 |
Income Statement Analysis: The Bottom-Line Duel
This income statement comparison reveals which company runs a more efficient and profitable corporate engine through recent financial performance.
Adobe Inc. Analysis
Adobe’s revenue surged 11% to $23.8B in 2025, with net income climbing 28% to $7.13B. It maintains a robust 88.6% gross margin and a strong 30% net margin, underscoring operational excellence. The company’s EBIT margin jumped nearly 26%, signaling improved profitability and tight cost control, reinforcing its market dominance.
Okta, Inc. Analysis
Okta’s revenue grew 15% to $2.61B in 2025, doubling net income to $28M from a prior loss. Its gross margin stands at a solid 76.3%, though net margin remains slim at 1.1%. The company improved EBIT substantially but still operates near breakeven, reflecting early-stage scaling and ongoing investment in growth.
Margin Power vs. Growth Trajectory
Adobe leads with superior profitability and margin consistency, yielding a $7.13B net income on $23.8B revenue. Okta shows impressive growth but remains marginally profitable. Adobe’s profile suits investors seeking stable, high-margin cash flows, while Okta appeals to those prioritizing high revenue growth with early profit progress.
Financial Ratios Comparison
These vital ratios act as a diagnostic tool to expose underlying fiscal health, valuation premiums, and capital efficiency for the two companies compared below:
| Ratios | Adobe Inc. (ADBE) | Okta, Inc. (OKTA) |
|---|---|---|
| ROE | 61.3% | 0.4% |
| ROIC | 36.7% | -0.6% |
| P/E | 19.1 | 570.6 |
| P/B | 11.7 | 2.5 |
| Current Ratio | 1.0 | 1.4 |
| Quick Ratio | 1.0 | 1.4 |
| D/E | 0.57 | 0.15 |
| Debt-to-Assets | 22.5% | 10.1% |
| Interest Coverage | 33.1 | -14.8 |
| Asset Turnover | 0.81 | 0.28 |
| Fixed Asset Turnover | 10.9 | 22.3 |
| Payout ratio | 0 | 0 |
| Dividend yield | 0 | 0 |
| Fiscal Year | 2025 | 2025 |
Efficiency & Valuation Duel: The Vital Signs
Ratios act as a company’s DNA, revealing hidden risks and operational excellence that numbers alone cannot fully capture.
Adobe Inc.
Adobe demonstrates strong profitability with a 61.34% ROE and a robust 30% net margin, signaling operational efficiency. Its P/E of 19.13 suggests a fairly valued stock, neither stretched nor cheap. Adobe does not pay dividends, instead funneling cash into R&D, committing 18% of revenue to innovation and growth.
Okta, Inc.
Okta shows weak profitability, with a 0.44% ROE and a minimal 1.07% net margin, reflecting operational challenges. Its P/E ratio of 570.6 signals an extremely stretched valuation. Okta returns value through reinvestment in growth, dedicating nearly 25% of revenue to R&D, but currently yields no dividends.
Valuation Discipline vs. Growth Gamble
Adobe balances operational strength with a reasonable valuation, offering a safer risk-reward profile. Okta’s high valuation and weak profitability demand caution despite growth investments. Investors seeking stability lean toward Adobe, while those favoring aggressive growth might consider Okta’s riskier profile.
Which one offers the Superior Shareholder Reward?
I observe that Adobe Inc. (ADBE) does not pay dividends but generates robust free cash flow of 23.1B in FY2025, supporting substantial buybacks. Okta, Inc. (OKTA) also pays no dividends and invests heavily in growth, with a modest free cash flow of 4.3B. Adobe’s payout ratio is zero, reflecting full reinvestment and buyback focus, while Okta’s weak profitability and negative margins limit buyback capacity. Adobe’s superior cash flow coverage and disciplined capital allocation signal a more sustainable shareholder reward. I conclude Adobe offers a more attractive total return profile for 2026 investors.
Comparative Score Analysis: The Strategic Profile
The radar chart reveals the fundamental DNA and trade-offs of Adobe Inc. and Okta, Inc., highlighting their diverse financial strengths and valuation metrics:
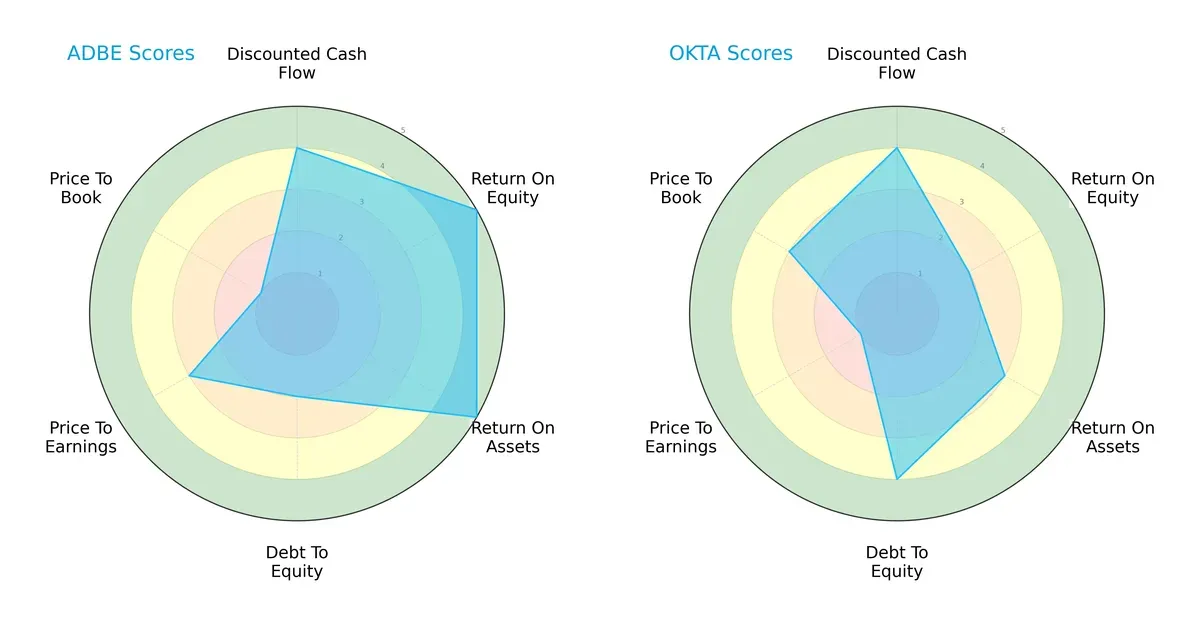
Adobe Inc. excels in profitability with top ROE and ROA scores (5 each), but carries moderate debt (score 2) and an unfavorable price-to-book ratio (score 1). Okta shows stronger balance sheet discipline with a favorable debt-to-equity score (4) but struggles on profitability metrics, scoring lower on ROE (2) and ROA (3). Adobe offers a more balanced profile anchored in operational efficiency, while Okta depends on financial prudence and undervaluation potential despite weaker returns.
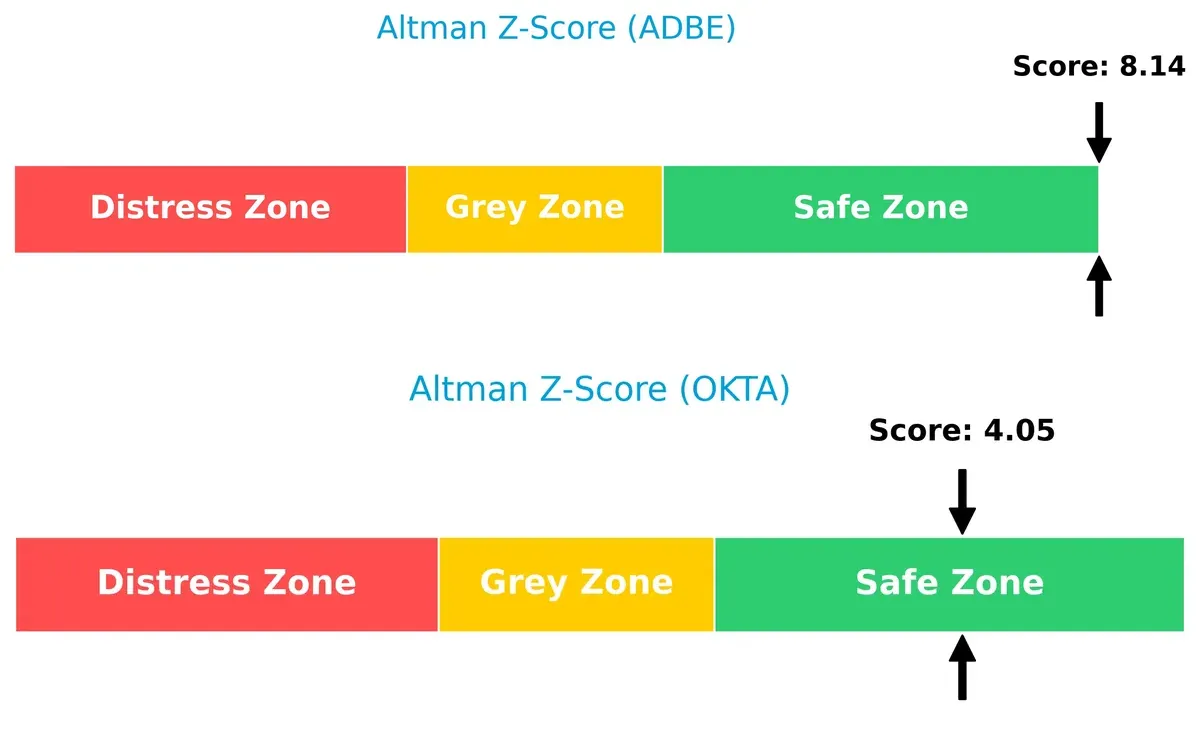
Bankruptcy Risk: Solvency Showdown
Adobe’s Altman Z-Score of 8.14 versus Okta’s 4.05 signals superior solvency for Adobe, positioning it deep in the safe zone. Okta remains safe but closer to risk thresholds, implying Adobe carries a more robust buffer against economic downturns:
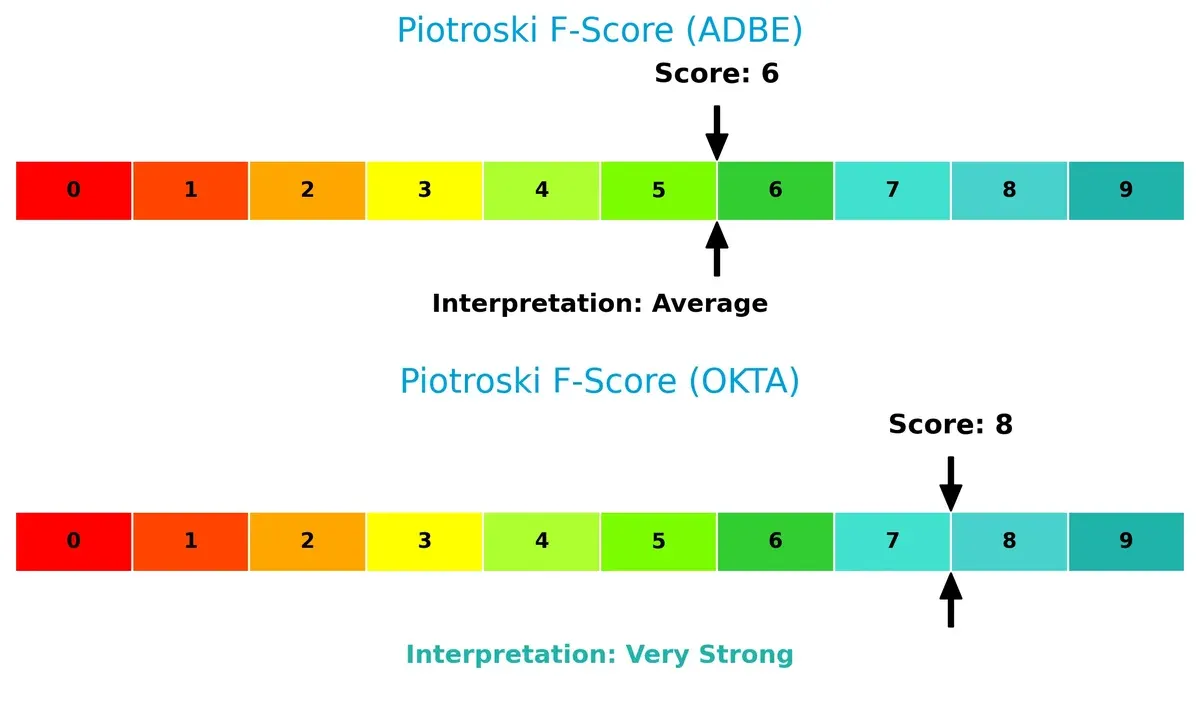
Financial Health: Quality of Operations
Okta’s Piotroski F-Score of 8 outperforms Adobe’s 6, indicating stronger internal financial health and operational quality. Adobe’s score, while decent, suggests potential red flags in its internal metrics compared to Okta’s very strong financial footing:
How are the two companies positioned?
This section dissects Adobe and Okta’s operational DNA by comparing their revenue distribution and internal dynamics. The goal is to confront their economic moats and identify which business model delivers the most resilient, sustainable advantage today.
Revenue Segmentation: The Strategic Mix
This visual comparison dissects how Adobe Inc. and Okta, Inc. diversify their income streams and reveals where their primary sector bets lie:
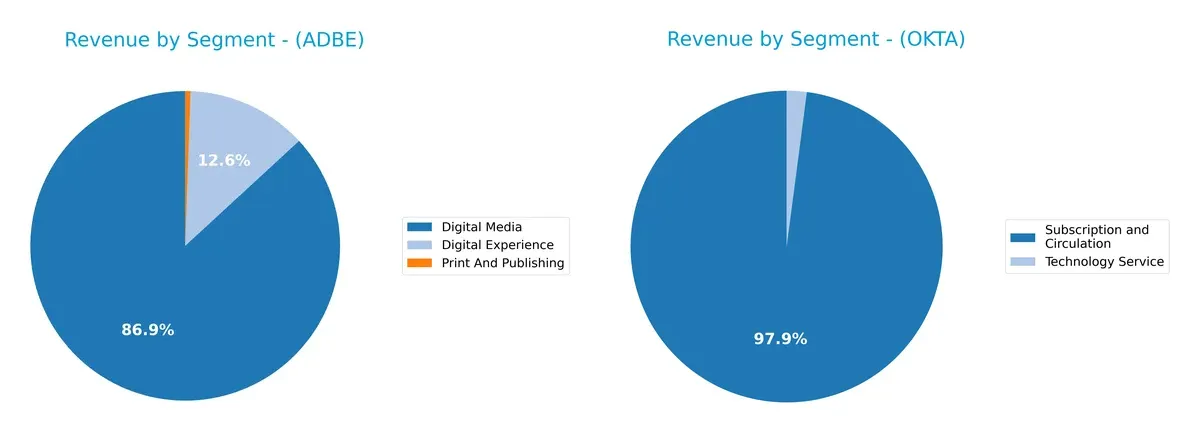
Adobe Inc. dwarfs Okta with a broader portfolio, anchored by Digital Media at $40.4B and Digital Experience at $5.9B. Okta’s revenue pivots heavily on Subscription and Circulation, $2.56B, showing less diversification. Adobe’s mix signals strong ecosystem lock-in through creative software, while Okta’s concentration in subscription services carries higher customer churn risk despite steady growth.
Strengths and Weaknesses Comparison
This table compares the Strengths and Weaknesses of Adobe Inc. and Okta, Inc.:
Adobe Inc. Strengths
- High net margin at 30%
- Strong ROE of 61.34%
- Favorable ROIC of 36.69%
- Low debt-to-assets at 22.54%
- Robust Americas and EMEA market presence
- Diversified revenue across Digital Media and Experience segments
Okta, Inc. Strengths
- Favorable WACC at 7.14%
- Strong interest coverage ratio at 10.2
- Low debt-to-assets at 10.09%
- Healthy quick ratio at 1.35
- Growing subscription revenue
- Focused US market with expanding Non-US sales
Adobe Inc. Weaknesses
- Unfavorable current ratio at 1.0
- High price-to-book ratio at 11.73
- WACC at 10.6% exceeds ROIC
- No dividend yield
- Heavy reliance on Americas region
- Print and Publishing segment declining
Okta, Inc. Weaknesses
- Very low net margin at 1.07%
- Negative ROIC at -0.61%
- Extremely high PE ratio at 570.6
- Low asset turnover at 0.28
- No dividend yield
- Concentrated product segmentation
Adobe shows strong profitability and diversified global presence but faces liquidity and valuation challenges. Okta maintains solid financial health metrics but struggles with profitability and market concentration. These contrasting profiles suggest differing strategic priorities and risk exposures.
The Moat Duel: Analyzing Competitive Defensibility
A structural moat is the only reliable barrier protecting long-term profits from relentless competitive erosion in the tech sector:
Adobe Inc.: Subscription Powerhouse with Intangible Asset Moat
Adobe’s competitive edge stems from its entrenched subscription model and powerful brand in creative software. This drives high ROIC near 38% and consistent margin stability. In 2026, expanding digital experience solutions could deepen its moat further.
Okta, Inc.: Identity Security with Network Effect Moat
Okta’s moat relies on network effects from its identity management platform, contrasting Adobe’s brand and subscription moat. Its ROIC remains below WACC, signaling value destruction, yet rapid revenue growth and rising profitability offer runway for market disruption.
Subscription Dominance vs. Network Effect Growth
Adobe boasts a wider, more durable moat supported by a high ROIC and stable margins. Okta’s moat is narrower but improving. Adobe remains better positioned to defend market share amid intensifying competition.
Which stock offers better returns?
The past year shows pronounced bearish trends for both stocks, with Adobe Inc. experiencing sharper declines and Okta, Inc. displaying signs of recent stabilization and slight recovery.
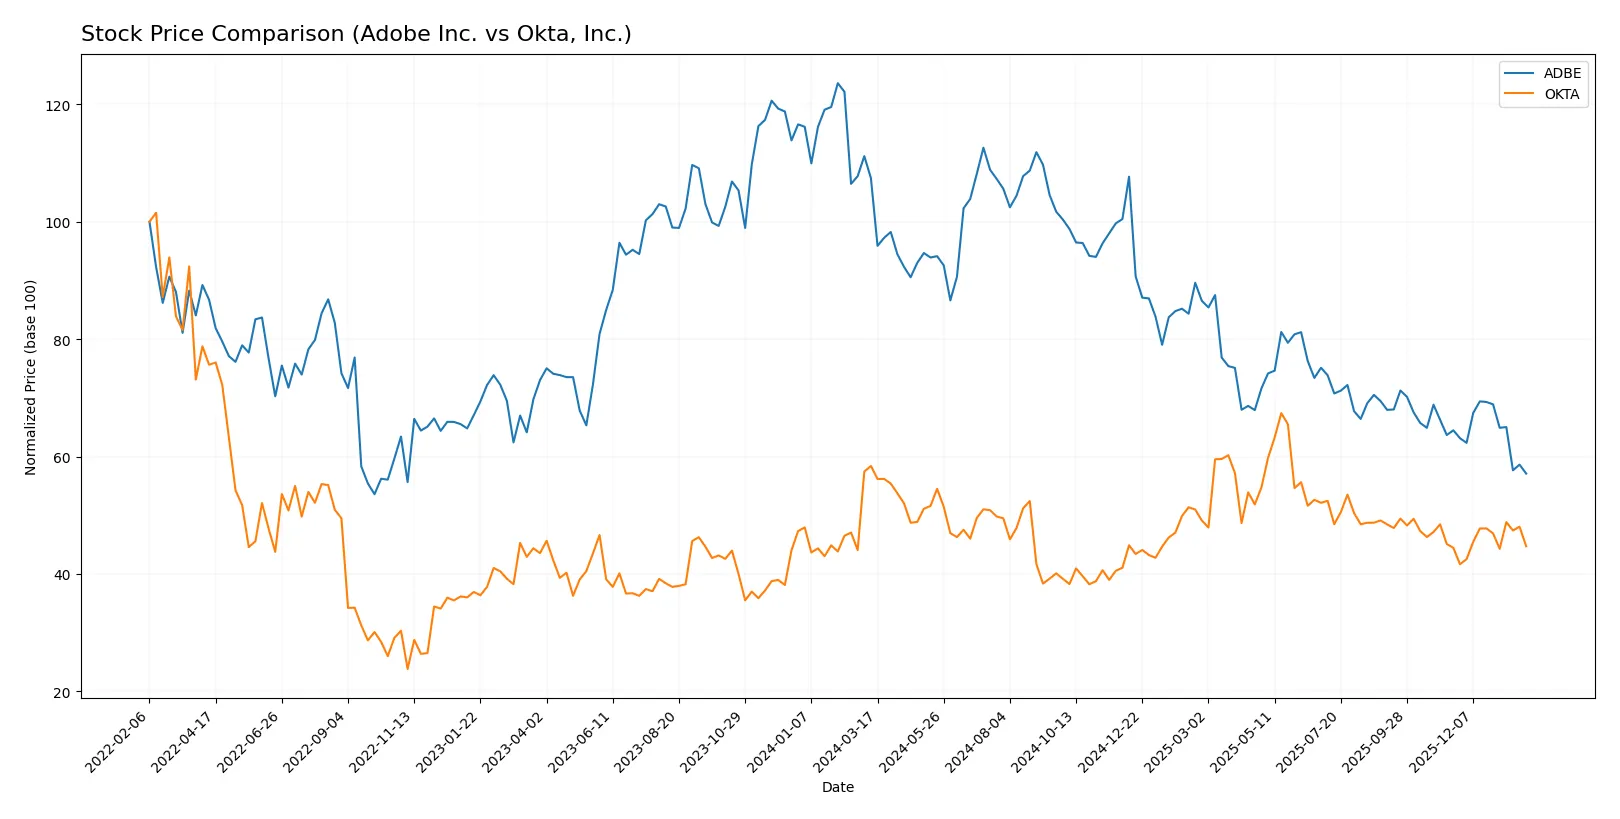
Trend Comparison
Adobe Inc.’s stock declined by 46.85% over the past 12 months, showing a bearish trend with deceleration. The price ranged from a high of 578.34 to a low of 293.25.
Okta, Inc.’s stock fell 23.41% over the same period, also bearish but with acceleration. The price fluctuated between 127.3 and 72.24, with recent slight gains of 0.64%.
Okta outperformed Adobe in market returns, delivering lower losses and recent positive momentum compared to Adobe’s sustained decline.
Target Prices
Analysts show a broad target price range for Adobe Inc. and Okta, Inc., indicating mixed but generally optimistic outlooks.
| Company | Target Low | Target High | Consensus |
|---|---|---|---|
| Adobe Inc. | 280 | 500 | 390.31 |
| Okta, Inc. | 60 | 140 | 110.67 |
Adobe’s target consensus stands roughly 33% above its current price of 293, suggesting strong growth expectations. Okta’s consensus target is about 31% higher than its current 84.48, reflecting positive analyst sentiment despite recent volatility.

Don’t Let Luck Decide Your Entry Point
Optimize your entry points with our advanced ProRealTime indicators. You’ll get efficient buy signals with precise price targets for maximum performance. Start outperforming now!
How do institutions grade them?
Adobe Inc. Grades
Here are the latest institutional grades for Adobe Inc. from established analysts:
| Grading Company | Action | New Grade | Date |
|---|---|---|---|
| UBS | Maintain | Neutral | 2026-01-26 |
| Oppenheimer | Downgrade | Perform | 2026-01-13 |
| BMO Capital | Downgrade | Market Perform | 2026-01-09 |
| Jefferies | Downgrade | Hold | 2026-01-05 |
| Citigroup | Maintain | Neutral | 2025-12-17 |
| BMO Capital | Maintain | Outperform | 2025-12-15 |
| Keybanc | Downgrade | Underweight | 2025-12-15 |
| Wolfe Research | Maintain | Outperform | 2025-12-11 |
| TD Cowen | Maintain | Hold | 2025-12-11 |
| Oppenheimer | Maintain | Outperform | 2025-12-11 |
Okta, Inc. Grades
Below are the recent grades on Okta, Inc. from reputable financial institutions:
| Grading Company | Action | New Grade | Date |
|---|---|---|---|
| Stephens & Co. | Upgrade | Overweight | 2026-01-14 |
| Piper Sandler | Maintain | Neutral | 2026-01-05 |
| RBC Capital | Maintain | Outperform | 2026-01-05 |
| Jefferies | Upgrade | Buy | 2025-12-16 |
| Needham | Maintain | Buy | 2025-12-12 |
| BTIG | Maintain | Buy | 2025-12-04 |
| Goldman Sachs | Maintain | Buy | 2025-12-03 |
| Cantor Fitzgerald | Maintain | Overweight | 2025-12-03 |
| BTIG | Maintain | Buy | 2025-12-03 |
| BMO Capital | Maintain | Market Perform | 2025-12-03 |
Which company has the best grades?
Okta, Inc. holds stronger grades overall, with multiple “Buy” and “Overweight” ratings. Adobe’s recent trend shows downgrades to “Hold” or “Neutral.” Investors may view Okta as having more bullish institutional sentiment.
Risks specific to each company
The following categories identify critical pressure points and systemic threats facing Adobe Inc. and Okta, Inc. in the 2026 market environment:
1. Market & Competition
Adobe Inc.
- Dominates diversified software segments with strong brand moat and Creative Cloud leadership.
Okta, Inc.
- Faces intense competition in identity solutions; niche but rapidly evolving market.
2. Capital Structure & Debt
Adobe Inc.
- Moderate debt-to-equity ratio (0.57), manageable leverage with high interest coverage (33.96).
Okta, Inc.
- Low leverage (0.15 D/E), strong interest coverage (10.2), conservative capital structure.
3. Stock Volatility
Adobe Inc.
- High beta (1.526) signals above-market volatility; wider price range reflects sensitivity to sector swings.
Okta, Inc.
- Lower beta (0.76) indicates less volatility, but high P/E ratio may amplify price swings on earnings news.
4. Regulatory & Legal
Adobe Inc.
- Operates globally with exposure to data privacy laws and antitrust scrutiny.
Okta, Inc.
- Faces risks linked to cybersecurity regulations and compliance in cloud identity management.
5. Supply Chain & Operations
Adobe Inc.
- Relies on cloud infrastructure and third-party distributors; operational risks include service disruptions.
Okta, Inc.
- Cloud-based platform dependent on data center reliability and software integration stability.
6. ESG & Climate Transition
Adobe Inc.
- Increasing ESG initiatives; pressure to reduce carbon footprint across global operations.
Okta, Inc.
- Emerging ESG focus; less carbon-intensive but must address data security and privacy ethics.
7. Geopolitical Exposure
Adobe Inc.
- Global footprint exposes it to trade tensions and regulatory divergence, especially US-China relations.
Okta, Inc.
- Primarily US-based but expanding internationally; geopolitical risks from data sovereignty laws.
Which company shows a better risk-adjusted profile?
Adobe’s most impactful risk lies in market volatility and stretched valuation metrics, notably its unfavorable price-to-book ratio and current ratio. Okta’s key risk is its weak profitability and sky-high P/E ratio, reflecting investor skepticism despite solid balance sheet metrics. I see Adobe as having a slightly better risk-adjusted profile due to its stronger profitability, robust Altman Z-score (8.14 vs. 4.05), and diversified product moat, despite higher volatility. Okta’s excellent Piotroski score (8) signals operational strength but its financial returns lag dangerously, warranting caution amid market pressures.
Final Verdict: Which stock to choose?
Adobe Inc. stands out as a powerhouse of operational efficiency and durable value creation. Its ability to generate returns well above its cost of capital signals a robust economic moat. The point of vigilance lies in its tight liquidity position, which might pressure short-term flexibility. Adobe suits portfolios prioritizing steady, aggressive growth anchored in strong profitability.
Okta, Inc. offers a strategic moat through its cloud security niche and recurring revenue model, underpinning its growth story. Relative to Adobe, Okta presents a safer liquidity profile and a stronger balance sheet, though it currently struggles to convert growth into profitability. This makes Okta appealing for investors focused on growth at a reasonable price with a tolerance for execution risk.
If you prioritize proven profitability and a durable competitive advantage, Adobe outshines as the compelling choice due to its strong returns and consistent value creation. However, if you seek high-growth potential with better liquidity and a developing moat, Okta offers better stability and growth upside despite its current profitability challenges. Both scenarios require careful risk management given market volatility and sector dynamics.
Disclaimer: Investment carries a risk of loss of initial capital. The past performance is not a reliable indicator of future results. Be sure to understand risks before making an investment decision.
Go Further
I encourage you to read the complete analyses of Adobe Inc. and Okta, Inc. to enhance your investment decisions: