Home > Comparison > Technology > ADBE vs ODD
The strategic rivalry between Adobe Inc. and Oddity Tech Ltd. shapes the evolving landscape of the Technology sector. Adobe operates as a diversified software infrastructure giant with a global footprint and broad enterprise focus. Oddity Tech, by contrast, is a nimble, consumer-focused innovator disrupting beauty and wellness through digital-first brands. This analysis will assess which business model delivers superior risk-adjusted returns, guiding investors in navigating growth versus scale within technology infrastructure.
Table of contents
Companies Overview
Adobe Inc. and Oddity Tech Ltd. stand as key players reshaping the software infrastructure and consumer-tech landscapes.
Adobe Inc.: Industry-Leading Software Innovator
Adobe dominates the global software infrastructure market. Its core revenue stems from subscription services, notably Creative Cloud, powering digital media creation and document management. In 2026, Adobe sharpens its focus on expanding its Digital Experience segment, integrating analytics and commerce to enhance customer engagement across enterprises.
Oddity Tech Ltd.: Consumer-Tech Disruptor
Oddity Tech operates at the intersection of technology and beauty, leveraging its proprietary PowerMatch technology. It generates revenue by building digital-first brands disrupting traditional beauty and wellness markets. In 2026, Oddity prioritizes scaling its IL MAKIAGE and SpoiledChild brands through innovative product lines and direct-to-consumer digital channels.
Strategic Collision: Similarities & Divergences
Adobe pursues a platform-driven, enterprise-centric approach, while Oddity bets on consumer-focused, tech-enabled brand disruption. Both compete on digital innovation, but Adobe targets B2B software solutions; Oddity targets B2C beauty markets. Their distinct models reflect divergent investment profiles: Adobe offers scale and stability; Oddity embodies growth and market agility.
Income Statement Comparison
The following data dissects the core profitability and scalability of both corporate engines to reveal who dominates the bottom line:

| Metric | Adobe Inc. (ADBE) | Oddity Tech Ltd. (ODD) |
|---|---|---|
| Revenue | 23.8B | 647M |
| Cost of Revenue | 2.7B | 179M |
| Operating Expenses | 12.4B | 353M |
| Gross Profit | 21.1B | 468M |
| EBITDA | 9.7B | 125M |
| EBIT | 8.9B | 116M |
| Interest Expense | 263M | 76K |
| Net Income | 7.1B | 101M |
| EPS | 16.73 | 1.78 |
| Fiscal Year | 2025 | 2024 |
Income Statement Analysis: The Bottom-Line Duel
The upcoming income statement comparison reveals which company runs a more efficient and profitable business engine across recent fiscal years.
Adobe Inc. Analysis
Adobe’s revenue climbed steadily from 15.8B in 2021 to 23.8B in 2025, with net income rising from 4.8B to 7.1B. Its gross margin holds strong at 88.6%, while net margin reached a solid 30% in 2025. Adobe’s 2025 results display robust momentum, with a 10.5% revenue increase and a 16% net margin expansion, reflecting efficient cost control and strong earnings growth.
Oddity Tech Ltd. Analysis
Oddity Tech grew revenue explosively from 110M in 2020 to 647M in 2024, with net income surging from 11.7M to 101.5M. Its gross margin stands at a respectable 72.4%, and net margin improved to 15.7%. The 2024 year shows rapid scaling, with revenue up 27% and net margin rising 36%, signaling accelerating profitability alongside fast top-line growth.
Margin Strength vs. Growth Velocity
Adobe dominates in margin strength, boasting a 30% net margin versus Oddity’s 15.7%. However, Oddity outpaces Adobe in revenue growth, expanding nearly fivefold over five years compared to Adobe’s 50%. Adobe’s profile suits investors prioritizing steady profitability, while Oddity appeals to those chasing high-growth potential in an expanding market.
Financial Ratios Comparison
These vital ratios act as a diagnostic tool to expose the underlying fiscal health, valuation premiums, and capital efficiency of each company:
| Ratios | Adobe Inc. (ADBE) | Oddity Tech Ltd. (ODD) |
|---|---|---|
| ROE | 61.3% | 35.9% |
| ROIC | 36.7% | 28.6% |
| P/E | 19.1 | 23.7 |
| P/B | 11.7 | 8.5 |
| Current Ratio | 1.0 | 1.8 |
| Quick Ratio | 1.0 | 1.0 |
| D/E (Debt-to-Equity) | 0.57 | 0.08 |
| Debt-to-Assets | 22.5% | 5.2% |
| Interest Coverage | 33.1 | 1521.1 |
| Asset Turnover | 0.81 | 1.47 |
| Fixed Asset Turnover | 10.9 | 19.4 |
| Payout Ratio | 0% | 0% |
| Dividend Yield | 0% | 0% |
| Fiscal Year | 2025 | 2024 |
Efficiency & Valuation Duel: The Vital Signs
Ratios act as a company’s DNA, revealing hidden risks and operational excellence behind headline numbers.
Adobe Inc.
Adobe delivers robust profitability with a 61.3% ROE and a 30% net margin, signaling strong operational efficiency. Its P/E of 19.1 and P/B of 11.7 suggest a moderately expensive valuation relative to book value. Adobe offers no dividend but aggressively reinvests in R&D, fueling growth and shareholder value creation.
Oddity Tech Ltd.
Oddity Tech posts solid profitability with a 36.0% ROE and a 15.7% net margin, indicating efficient capital use. Its P/E of 23.8 and P/B of 8.5 signal a somewhat stretched valuation. Oddity Tech pays no dividend, focusing on growth through asset turnover and maintaining low debt levels, enhancing financial flexibility.
Balanced Profitability vs. Growth Focus
Oddity Tech exhibits a higher ratio of favorable efficiency metrics and lower leverage, reflecting operational strength. Adobe commands superior profitability but at a higher valuation and weaker liquidity. Investors prioritizing stable returns may prefer Adobe’s dominance; growth-focused investors might lean toward Oddity’s operational agility.
Which one offers the Superior Shareholder Reward?
I observe that neither Adobe Inc. (ADBE) nor Oddity Tech Ltd. (ODD) pays dividends, focusing instead on reinvestment and buybacks. Adobe’s mature free cash flow of 23.1B and consistent buyback activity contrast with Oddity’s smaller, growth-focused free cash flow of 2.3B and modest buybacks. Adobe’s zero payout ratio paired with substantial buybacks suggests a shareholder-friendly capital allocation, preserving long-term value. Oddity targets growth via R&D and acquisitions, reflecting in its lower margins but higher asset turnover. For 2026, I judge Adobe offers a more attractive total return profile due to stronger free cash flow, sustainable buybacks, and superior profitability metrics.
Comparative Score Analysis: The Strategic Profile
The radar chart reveals the fundamental DNA and trade-offs of Adobe Inc. and Oddity Tech Ltd., highlighting their financial strengths and valuation nuances:
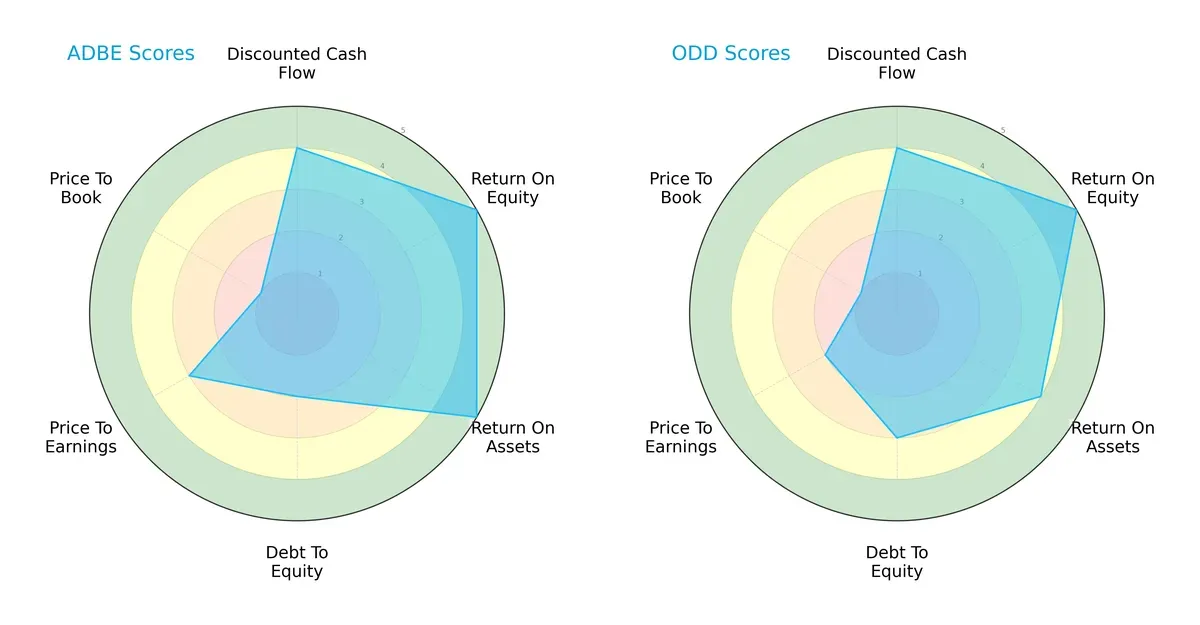
Adobe demonstrates superior efficiency with top scores in ROE and ROA, signaling excellent asset utilization and shareholder returns. Oddity Tech matches Adobe’s ROE but lags slightly in ROA and overall rating. Adobe’s balance sheet shows moderate leverage risk with a lower debt-to-equity score, while Oddity Tech carries marginally higher financial risk. Both firms face valuation challenges, reflected in very unfavorable price-to-book ratios, but Adobe holds a more balanced financial profile overall.
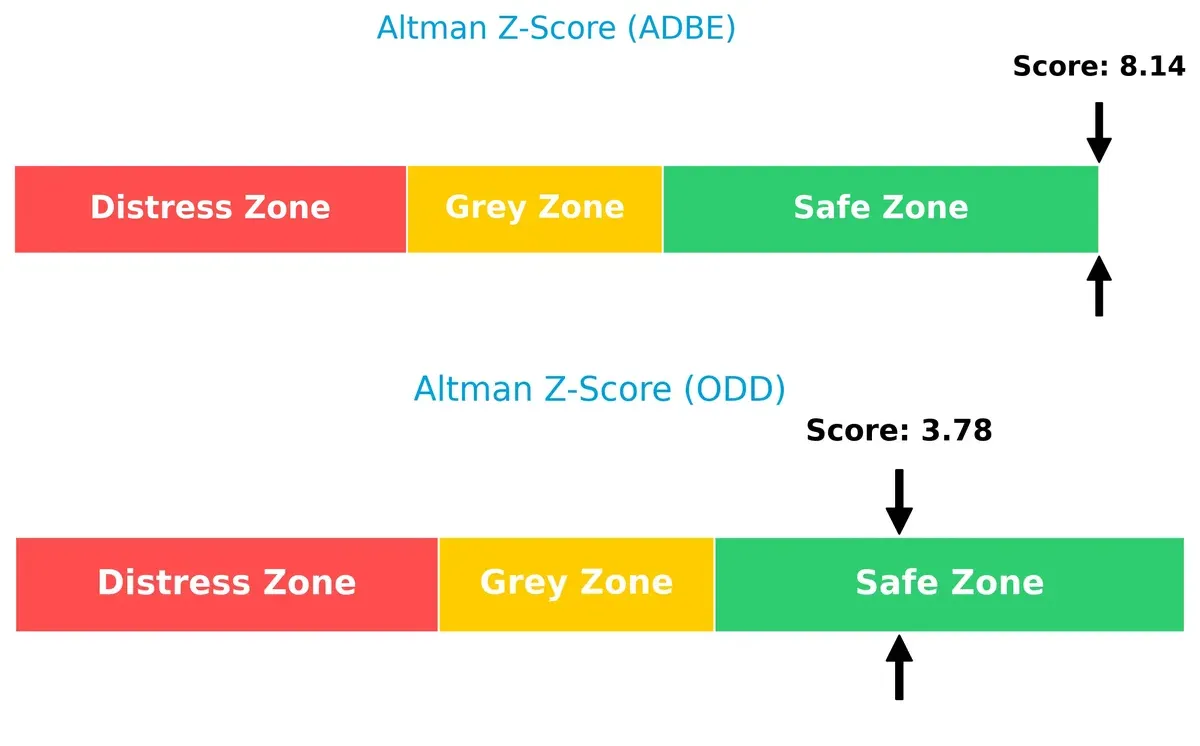
Bankruptcy Risk: Solvency Showdown
Adobe’s Altman Z-Score at 8.14 vastly outperforms Oddity Tech’s 3.78, indicating a much stronger buffer against financial distress and a safer position for long-term survival in volatile cycles:
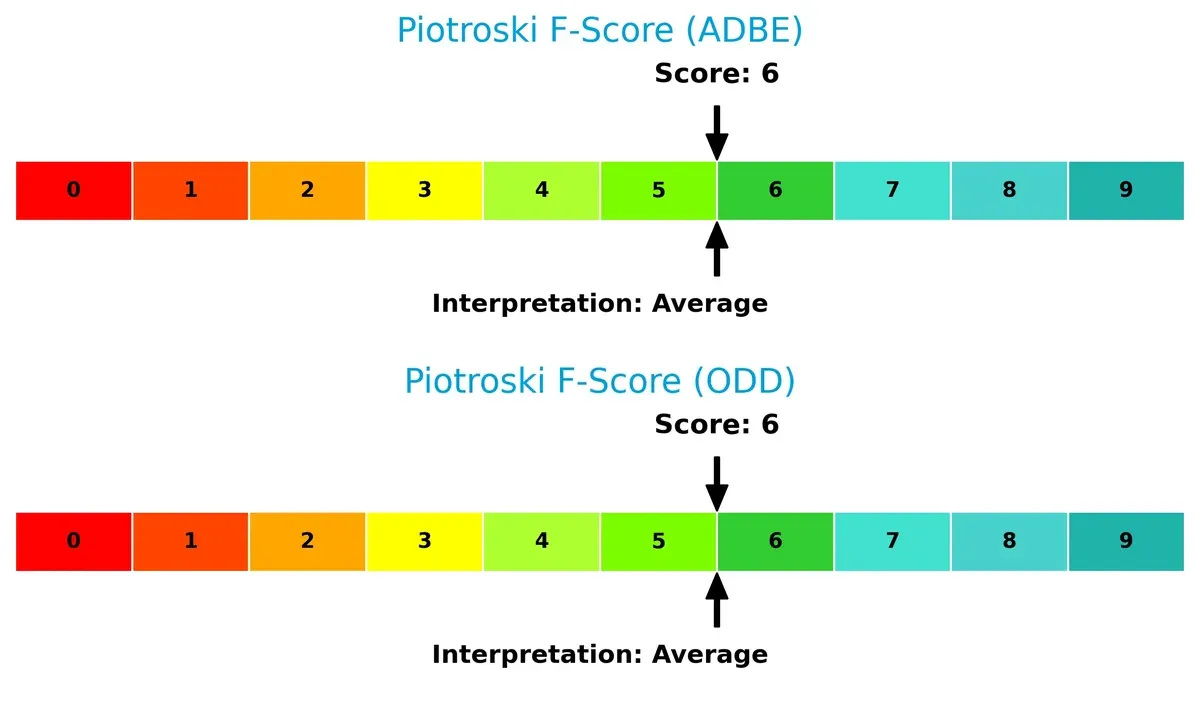
Financial Health: Quality of Operations
Both companies share an identical Piotroski F-Score of 6, suggesting average operational quality. Neither displays immediate red flags, but they have room to improve internal financial robustness:
How are the two companies positioned?
This section dissects Adobe and Oddity Tech’s operational DNA by comparing their revenue distribution and internal dynamics. The goal is to confront their economic moats and identify which model offers the most resilient competitive advantage.
Revenue Segmentation: The Strategic Mix
This visual comparison dissects how Adobe Inc. and Oddity Tech Ltd. diversify their income streams and reveals where their primary sector bets lie:
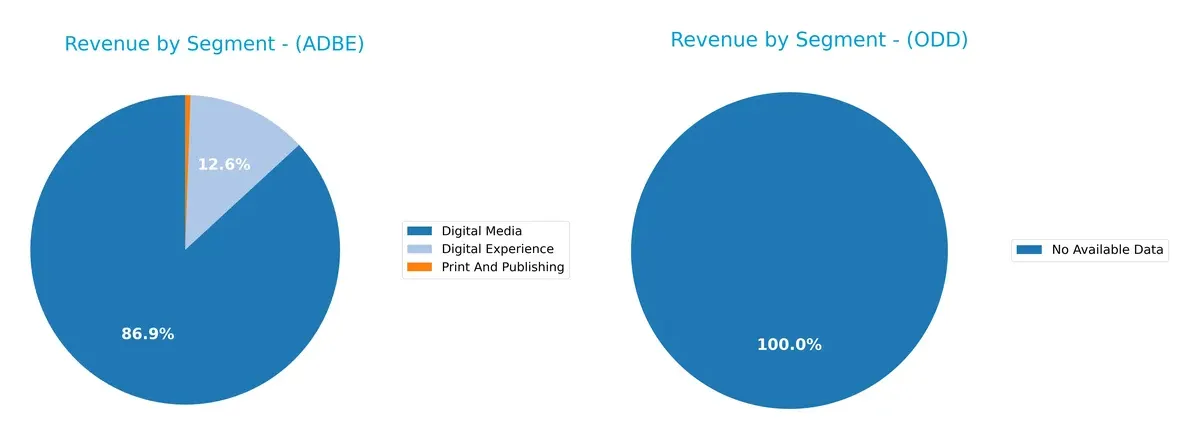
Adobe Inc. anchors its revenue heavily in Digital Media, generating $40.4B in 2025, dwarfing Digital Experience at $5.9B and Print And Publishing at $256M. This concentration signals strong ecosystem lock-in around creative software. Oddity Tech Ltd. lacks available data, preventing meaningful comparison. Adobe’s reliance on Digital Media poses some concentration risk but also reflects its infrastructure dominance in digital content creation.
Strengths and Weaknesses Comparison
This table compares the Strengths and Weaknesses of Adobe Inc. and Oddity Tech Ltd.:
Adobe Inc. Strengths
- Strong profitability with 30% net margin and 61.34% ROE
- Favorable ROIC at 36.69% above WACC
- Diverse revenue streams in Digital Experience and Media
- Significant global presence with $14.1B Americas and $6.3B EMEA sales
Oddity Tech Ltd. Strengths
- Favorable profitability metrics with 15.69% net margin and 35.95% ROE
- Extremely strong interest coverage at 1521
- Low leverage with 0.08 debt-to-equity and 5.17% debt-to-assets
- Efficient asset turnover and fixed asset turnover ratios
Adobe Inc. Weaknesses
- Weak liquidity ratios with current ratio at 1.0
- High WACC at 10.6% reduces capital efficiency
- Unfavorable price-to-book at 11.73 and no dividend yield
- Moderate debt level with 0.57 debt-to-equity ratio
Oddity Tech Ltd. Weaknesses
- High WACC at 18.64% signals costly capital
- Price-to-book ratio unfavorable at 8.54
- Quick ratio near 1.0 indicates limited liquidity buffer
- Zero dividend yield limits income appeal
Both companies exhibit strong profitability and capital efficiency but face liquidity and cost of capital challenges. Adobe’s diversified product and geographic exposure support stability, while Oddity Tech’s low leverage and exceptional interest coverage reinforce financial resilience. These factors shape their strategic flexibility amid market pressures.
The Moat Duel: Analyzing Competitive Defensibility
A structural moat shields long-term profits from relentless competition erosion. Without it, gains quickly vanish in this cutthroat software sector:
Adobe Inc.: Subscription Powerhouse with Intangible Asset Moat
Adobe’s moat stems from its dominant Creative Cloud ecosystem and strong brand recognition. This intangible asset delivers stable 30% net margins and 26% ROIC above WACC. In 2026, expanding digital experience platforms could deepen this moat further.
Oddity Tech Ltd.: Agile Innovator Leveraging Network Effects
Oddity’s competitive edge relies on its proprietary PowerMatch technology and fast-growing digital-first brands. Unlike Adobe, Oddity operates with a smaller scale but shows explosive revenue growth (485% over five years) and improving ROIC. New product launches could disrupt offline incumbents.
Enduring Ecosystem vs. Disruptive Network Innovation
Adobe commands a wider and more durable moat through entrenched subscription revenue and high capital efficiency. Oddity’s moat is narrower but rapidly strengthening with high growth. Adobe remains better positioned to defend and expand its market share in 2026.
Which stock offers better returns?
The past year shows significant price declines for both Adobe Inc. and Oddity Tech Ltd., with Adobe experiencing higher volatility and sharper downward momentum.

Trend Comparison
Adobe Inc.’s stock fell 46.85% over the past 12 months, marking a bearish trend with decelerating losses and high volatility, ranging between $578.34 and $293.25.
Oddity Tech Ltd. declined 26.83% over the same period, also bearish with deceleration, but with notably lower volatility and a price range from $77.35 to $32.19.
Comparing both, Adobe’s stock suffered a steeper decline and greater volatility, while Oddity Tech showed a less severe bearish trend and delivered higher relative market performance.
Target Prices
Analysts present a bullish consensus for both Adobe Inc. and Oddity Tech Ltd., expecting significant upside from current prices.
| Company | Target Low | Target High | Consensus |
|---|---|---|---|
| Adobe Inc. | 280 | 500 | 390.31 |
| Oddity Tech Ltd. | 40 | 80 | 66.33 |
Adobe’s target consensus of 390.31 implies roughly a 33% upside from its 293.25 current price. Oddity Tech’s consensus at 66.33 suggests more than 100% potential gain from 32.84.

Don’t Let Luck Decide Your Entry Point
Optimize your entry points with our advanced ProRealTime indicators. You’ll get efficient buy signals with precise price targets for maximum performance. Start outperforming now!
How do institutions grade them?
Adobe Inc. Grades
This table summarizes recent grade changes and actions from reputable grading firms for Adobe Inc.:
| Grading Company | Action | New Grade | Date |
|---|---|---|---|
| UBS | Maintain | Neutral | 2026-01-26 |
| Oppenheimer | Downgrade | Perform | 2026-01-13 |
| BMO Capital | Downgrade | Market Perform | 2026-01-09 |
| Jefferies | Downgrade | Hold | 2026-01-05 |
| Citigroup | Maintain | Neutral | 2025-12-17 |
| BMO Capital | Maintain | Outperform | 2025-12-15 |
| Keybanc | Downgrade | Underweight | 2025-12-15 |
| Wolfe Research | Maintain | Outperform | 2025-12-11 |
| TD Cowen | Maintain | Hold | 2025-12-11 |
| Oppenheimer | Maintain | Outperform | 2025-12-11 |
Oddity Tech Ltd. Grades
This table presents the stable ratings maintained by major institutions for Oddity Tech Ltd.:
| Grading Company | Action | New Grade | Date |
|---|---|---|---|
| Keybanc | Maintain | Overweight | 2026-01-08 |
| JP Morgan | Maintain | Overweight | 2025-12-12 |
| Barclays | Maintain | Equal Weight | 2025-11-21 |
| JP Morgan | Maintain | Overweight | 2025-11-21 |
| Morgan Stanley | Maintain | Equal Weight | 2025-11-21 |
| Needham | Maintain | Buy | 2025-11-20 |
| Keybanc | Maintain | Overweight | 2025-10-08 |
| JMP Securities | Maintain | Market Outperform | 2025-09-23 |
| Morgan Stanley | Maintain | Equal Weight | 2025-08-06 |
| JMP Securities | Maintain | Market Outperform | 2025-08-05 |
Which company has the best grades?
Oddity Tech Ltd. consistently holds positive ratings with no downgrades, reflecting strong institutional confidence. Adobe Inc. faces multiple downgrades, indicating increased caution among analysts. Investors might view Oddity Tech’s stable grades as a sign of relative strength.
Risks specific to each company
The following risk categories identify the critical pressure points and systemic threats facing both firms in the 2026 market environment:
1. Market & Competition
Adobe Inc.
- Dominates with diversified software segments and strong brand presence; faces intense competition in digital media and experience platforms.
Oddity Tech Ltd.
- Operates in a niche consumer-tech space with innovative beauty tech but faces fierce competition from established offline and digital brands.
2. Capital Structure & Debt
Adobe Inc.
- Moderate leverage with debt-to-equity at 0.57; interest coverage strong at 33.96, signaling manageable debt risk.
Oddity Tech Ltd.
- Very low leverage with debt-to-equity at 0.08; extremely high interest coverage of 1521, indicating a very conservative capital structure.
3. Stock Volatility
Adobe Inc.
- Beta of 1.53 shows higher-than-market volatility but within typical tech sector range.
Oddity Tech Ltd.
- Beta of 3.18 indicates extreme volatility, increasing risk for risk-averse investors.
4. Regulatory & Legal
Adobe Inc.
- US-based with exposure to evolving data privacy and software licensing regulations; robust compliance framework.
Oddity Tech Ltd.
- Israeli-based, subject to different regulatory environments; potential risks from international trade and compliance standards.
5. Supply Chain & Operations
Adobe Inc.
- Software delivery mainly cloud-based, reducing supply chain risks; however, dependency on data centers is a concern.
Oddity Tech Ltd.
- Physical product manufacturing and distribution expose it to supply chain disruptions, especially in global logistics.
6. ESG & Climate Transition
Adobe Inc.
- Increasing focus on sustainable cloud operations; some pressure to improve governance and social metrics.
Oddity Tech Ltd.
- Emerging company with growing ESG initiatives but limited track record; faces scrutiny on product sustainability.
7. Geopolitical Exposure
Adobe Inc.
- Primarily US-focused but with global customers; geopolitical tensions could affect international sales and data compliance.
Oddity Tech Ltd.
- Israel-based with regional geopolitical risks; global expansion may face regulatory and trade barriers.
Which company shows a better risk-adjusted profile?
Adobe’s most impactful risk is its relatively high stock volatility and regulatory complexity in a mature market. Oddity’s greatest risk lies in its extreme stock volatility and supply chain vulnerability in physical products. Adobe’s diversified revenue and safer capital structure offer a better risk-adjusted profile. Oddity’s high beta and operational risks heighten its investment risk despite strong capital conservatism. The recent data confirms Adobe’s stable Altman Z-Score of 8.1 versus Oddity’s lower 3.8, underscoring Adobe’s stronger financial resilience.
Final Verdict: Which stock to choose?
Adobe Inc. wields unmatched efficiency as a mature tech leader with a durable moat, powered by strong ROIC well above WACC. Its point of vigilance lies in a tight liquidity position, signaling potential short-term strain. It suits portfolios aiming for steady, long-term growth with moderate risk tolerance.
Oddity Tech Ltd. boasts a strategic moat rooted in nimble asset management and solid return metrics, supported by a healthier liquidity profile than Adobe. Its smaller scale and higher volatility suggest a fit for investors favoring dynamic growth with a tolerance for operational risk and less predictability.
If you prioritize resilient value creation and a proven competitive advantage, Adobe outshines with its superior capital efficiency and income stability. However, if you seek higher growth potential and better liquidity safety, Oddity offers better stability in working capital and a compelling growth trajectory. Both present analytical scenarios worth consideration, aligned to distinct investor profiles.
Disclaimer: Investment carries a risk of loss of initial capital. The past performance is not a reliable indicator of future results. Be sure to understand risks before making an investment decision.
Go Further
I encourage you to read the complete analyses of Adobe Inc. and Oddity Tech Ltd. to enhance your investment decisions: