Home > Comparison > Technology > ADBE vs NTNX
The strategic rivalry between Adobe Inc. and Nutanix, Inc. shapes the evolution of the technology sector’s software infrastructure landscape. Adobe, a market-leading software giant, focuses on diversified digital media and experience solutions, while Nutanix delivers an agile enterprise cloud platform emphasizing hybrid cloud orchestration. This head-to-head epitomizes the tension between established dominance and innovative cloud-native growth. This analysis will reveal which trajectory offers superior risk-adjusted returns for a diversified portfolio.
Table of contents
Companies Overview
Adobe Inc. and Nutanix, Inc. stand as pivotal players in the software infrastructure market, shaping enterprise technology landscapes.
Adobe Inc.: Creative and Customer Experience Leader
Adobe Inc. dominates as a diversified software powerhouse. Its Creative Cloud subscription drives core revenues by serving content creators and enterprises. In 2026, Adobe focuses strategically on expanding its Digital Experience segment, enhancing customer analytics and commerce platforms to deepen brand engagement worldwide.
Nutanix, Inc.: Enterprise Cloud Innovator
Nutanix, Inc. specializes in enterprise cloud platforms with a robust hybrid cloud orchestration suite. Its Acropolis Hypervisor and Prism Pro underpin virtualization and automation revenue streams. Nutanix’s 2026 strategy centers on simplifying cloud-native operations and expanding Kubernetes management to meet complex enterprise demands.
Strategic Collision: Similarities & Divergences
Both companies prioritize software infrastructure but diverge sharply in approach. Adobe invests heavily in integrated content creation and customer experience, while Nutanix focuses on cloud-native orchestration and hybrid cloud infrastructure. Their battle for enterprise IT dominance unfolds in software ecosystems. Adobe offers a creative-driven, subscription-based profile; Nutanix targets infrastructure automation with a platform-centric model.
Income Statement Comparison
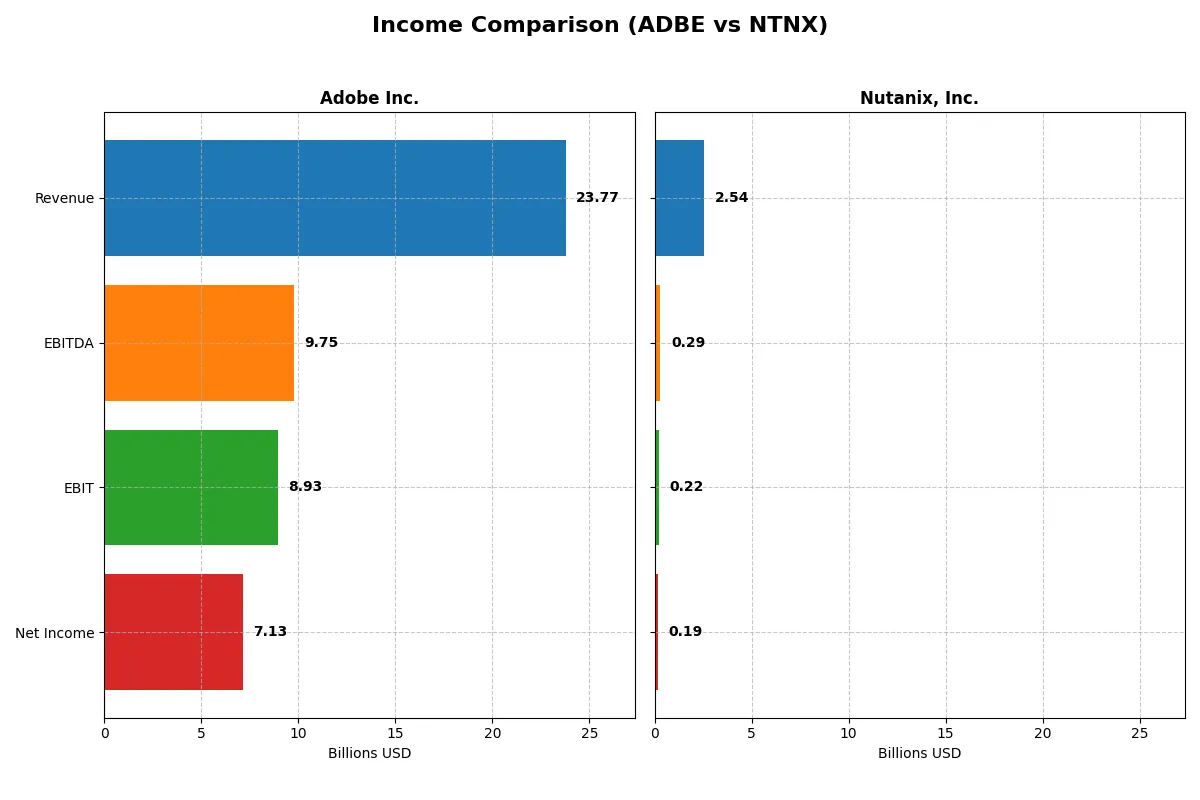
This data dissects the core profitability and scalability of both corporate engines to reveal who dominates the bottom line:
| Metric | Adobe Inc. (ADBE) | Nutanix, Inc. (NTNX) |
|---|---|---|
| Revenue | 23.8B | 2.54B |
| Cost of Revenue | 2.71B | 335M |
| Operating Expenses | 12.4B | 2.03B |
| Gross Profit | 21.1B | 2.20B |
| EBITDA | 9.75B | 293M |
| EBIT | 8.93B | 220M |
| Interest Expense | 263M | 20M |
| Net Income | 7.13B | 188M |
| EPS | 16.73 | 0.70 |
| Fiscal Year | 2025 | 2025 |
Income Statement Analysis: The Bottom-Line Duel
This income statement comparison reveals which company runs a more efficient and profitable business engine through recent financial performance.
Adobe Inc. Analysis
Adobe’s revenue climbed steadily from $15.8B in 2021 to $23.8B in 2025, with net income rising from $4.8B to $7.1B. The company sustains a robust gross margin above 88%, while its net margin remains strong near 30%. In 2025, Adobe’s margin expansion and 10.5% revenue growth signal solid operational momentum and disciplined cost control.
Nutanix, Inc. Analysis
Nutanix grew revenue aggressively from $1.4B in 2021 to $2.5B in 2025, doubling net income from a loss to $188M profit. Gross margin holds steady around 87%, but net margin is modest at 7.4%. The latest year shows a sharp turnaround with 18% revenue growth and over 220% net margin improvement, reflecting operational scaling and improved cost leverage.
Margin Power vs. Revenue Scale
Adobe dominates in margin quality and absolute profits, delivering consistent growth and high efficiency. Nutanix impresses with rapid revenue and net income gains, recovering from losses to profitability. For investors, Adobe’s profile suits those favoring stable, high-margin cash flow; Nutanix appeals to growth seekers betting on continued operational improvements.
Financial Ratios Comparison
These vital ratios act as a diagnostic tool to expose the underlying fiscal health, valuation premiums, and capital efficiency of the companies compared:
| Ratios | Adobe Inc. (ADBE) | Nutanix, Inc. (NTNX) |
|---|---|---|
| ROE | 61.3% | -27.1% |
| ROIC | 36.7% | 8.1% |
| P/E | 19.1 | 106.7 |
| P/B | 11.7 | -28.9 |
| Current Ratio | 1.0 | 1.7 |
| Quick Ratio | 1.0 | 1.7 |
| D/E (Debt-to-Equity) | 0.57 | -2.14 |
| Debt-to-Assets | 22.5% | 45.2% |
| Interest Coverage | 33.1 | 8.7 |
| Asset Turnover | 0.81 | 0.77 |
| Fixed Asset Turnover | 10.9 | 9.15 |
| Payout Ratio | 0% | 0% |
| Dividend Yield | 0% | 0% |
| Fiscal Year | 2025 | 2025 |
Efficiency & Valuation Duel: The Vital Signs
Financial ratios act as a company’s DNA, uncovering hidden risks and operational strengths beneath the surface numbers.
Adobe Inc.
Adobe delivers exceptional profitability with a 61.3% ROE and a strong 30% net margin, signaling operational excellence. Its P/E of 19.1 remains reasonable amid high intangible assets and a slightly stretched P/B ratio of 11.7. Adobe reinvests heavily in R&D, prioritizing growth over dividends, reflecting confidence in future returns.
Nutanix, Inc.
Nutanix shows weaker profitability, marked by a negative 27.1% ROE and modest 7.4% net margin. The stock trades at a stretched P/E of 106.7, indicating high market expectations despite mixed fundamentals. Nutanix maintains financial health with a strong current ratio and reinvests heavily in R&D, foregoing dividends to fuel its growth trajectory.
Premium Profitability vs. Growth Ambition
Adobe balances high profitability with a reasonable valuation, while Nutanix carries growth potential paired with valuation risk. Adobe suits investors seeking operational safety and solid returns. Nutanix fits those willing to accept higher risk for growth upside.
Which one offers the Superior Shareholder Reward?
Adobe Inc. (ADBE) and Nutanix, Inc. (NTNX) both forego dividends, focusing on reinvestment and buybacks. Adobe boasts zero dividend yield but delivers strong free cash flow of $23.1/share and robust buybacks, fueling sustainable shareholder returns. Nutanix also pays no dividends, with modest free cash flow of $2.8/share and limited buyback capacity amid heavy debt and negative equity. Adobe’s superior margin profile and disciplined capital allocation underpin a more sustainable model. I find Adobe’s shareholder reward superior in 2026 due to its efficient buybacks and solid FCF coverage, unlike Nutanix’s riskier, debt-laden approach.
Comparative Score Analysis: The Strategic Profile
The radar chart reveals the fundamental DNA and trade-offs of Adobe Inc. and Nutanix, Inc., highlighting their strategic strengths and vulnerabilities:
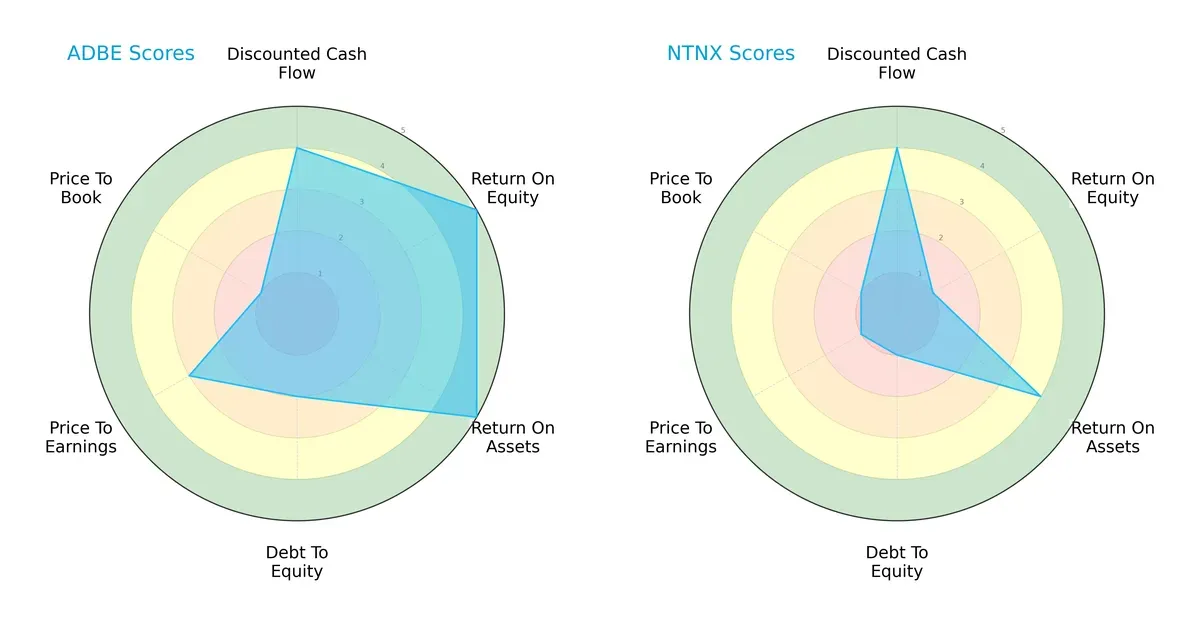
Adobe dominates in return on equity (5 vs. 1) and return on assets (5 vs. 4), showing superior profitability and asset use. Both score equally on discounted cash flow (4), but Adobe’s debt-to-equity (2 vs. 1) and valuation metrics (PE: 3 vs. 1; PB: 1 vs. 1) indicate moderate leverage and pricing caution. Nutanix relies heavily on discounted cash flow but suffers from poor equity returns and high financial risk. Adobe presents a more balanced, robust financial profile.
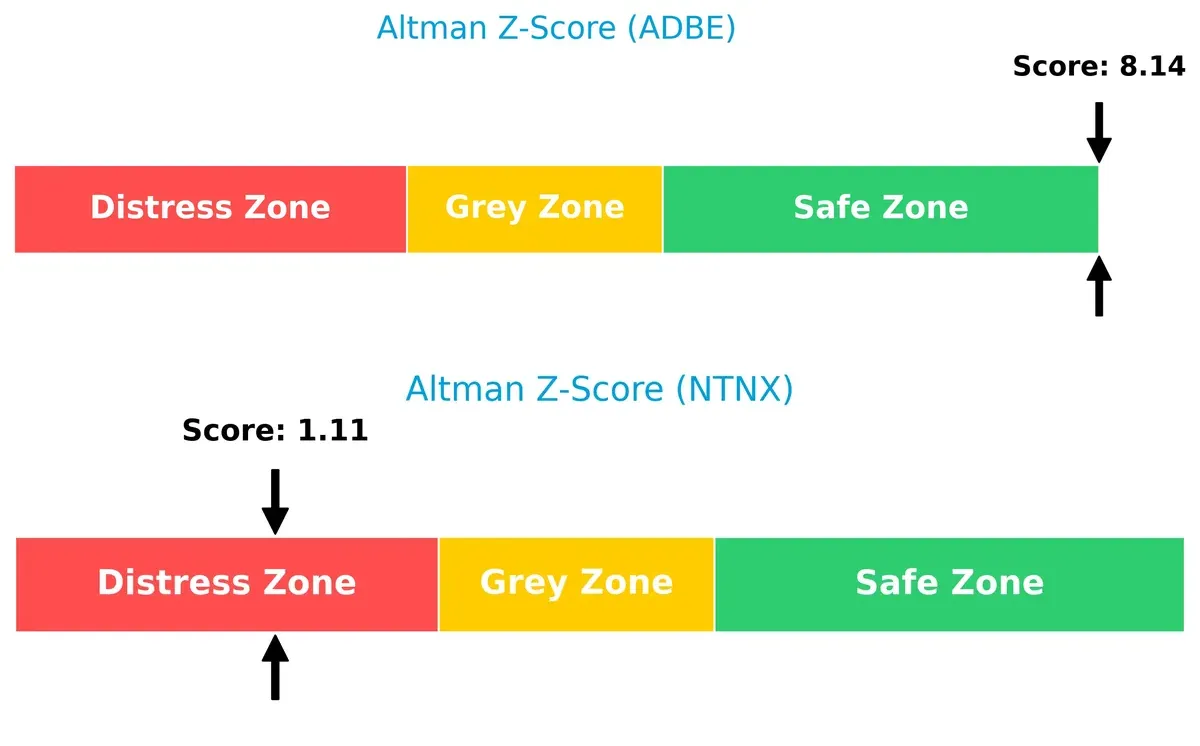
Bankruptcy Risk: Solvency Showdown
Adobe’s Altman Z-Score of 8.14 places it firmly in the safe zone, signaling strong long-term survival potential. Nutanix’s 1.11 score lands it in distress territory, raising serious bankruptcy concerns in this cycle:
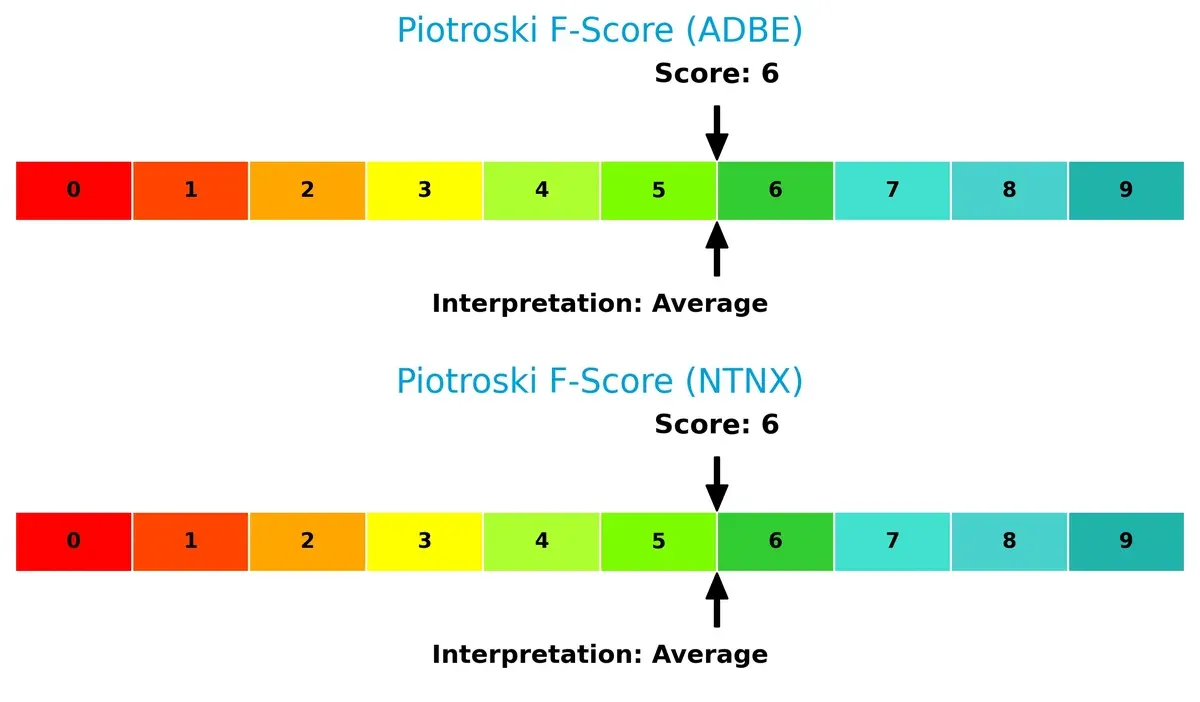
Financial Health: Quality of Operations
Both companies score a 6 on the Piotroski F-Score, indicating average financial health. Neither shows immediate red flags, but this middling score suggests room for operational improvement:
How are the two companies positioned?
This section dissects Adobe and Nutanix’s operational DNA by comparing revenue distribution and internal dynamics. The goal is to confront their economic moats and identify which model offers the most resilient competitive advantage today.
Revenue Segmentation: The Strategic Mix
The following visual comparison dissects how Adobe Inc. and Nutanix, Inc. diversify their income streams and where their primary sector bets lie:
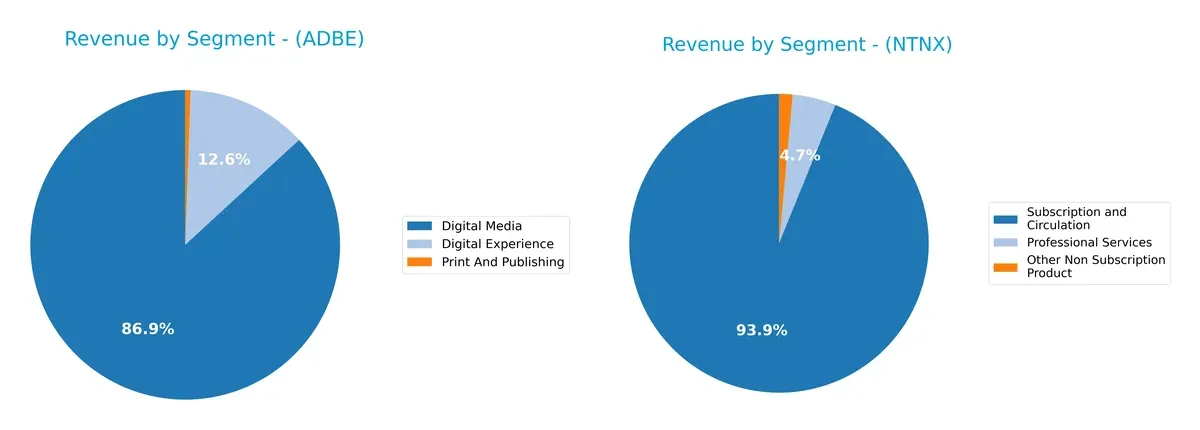
Adobe Inc. relies heavily on its Digital Media segment, which dwarfs its Digital Experience at $40.4B versus $5.9B in 2025. Nutanix, Inc. shows a more balanced split between Subscription and Circulation ($2.0B) and Professional Services ($101M) in 2024. Adobe’s focus on Digital Media anchors an ecosystem lock-in, while Nutanix’s mix reflects infrastructure dominance but carries some concentration risk in subscriptions.
Strengths and Weaknesses Comparison
This table compares the strengths and weaknesses of Adobe Inc. and Nutanix, Inc.:
Adobe Inc. Strengths
- High profitability with 30% net margin
- Strong ROE at 61.34%
- Favorable ROIC at 36.69%
- Low debt-to-assets at 22.54%
- Strong interest coverage at 33.96
- Robust fixed asset turnover at 10.88
- Diverse revenue streams across Digital Media and Digital Experience
- Significant global presence, especially Americas and EMEA
Nutanix, Inc. Strengths
- Favorable WACC at 5.83% supports capital efficiency
- Strong liquidity with current and quick ratios at 1.72
- Favorable debt/equity ratio, indicating low leverage
- Good interest coverage at 11.15
- Solid fixed asset turnover at 9.15
- Balanced revenue between Product and Service segments
- Presence in multiple geographies including U.S., EMEA, and Asia Pacific
Adobe Inc. Weaknesses
- WACC high at 10.6%, above ROIC
- Unfavorable P/B ratio at 11.73, indicating high valuation
- Current ratio at 1.0 signals tight liquidity
- No dividend yield
- Moderate asset turnover at 0.81
- Heavy reliance on Digital Media segment
Nutanix, Inc. Weaknesses
- Negative ROE at -27.12% reflects unprofitability
- High P/E at 106.74 suggests expensive shares
- Debt-to-assets at 45.16% is moderate risk
- No dividend yield
- Net margin modest at 7.42%
- Uneven revenue concentration in Subscription and Professional Services
Adobe excels in profitability and capital efficiency but faces valuation and liquidity pressures. Nutanix shows good liquidity and capital structure but struggles with profitability and valuation metrics, indicating strategic challenges ahead.
The Moat Duel: Analyzing Competitive Defensibility
A structural moat is the only true defense protecting a company’s long-term profits from relentless competitive erosion:
Adobe Inc.: Subscription Powerhouse with Intangible Assets
Adobe’s dominant moat stems from its subscription-based Creative Cloud platform, locking in users via high switching costs. This manifests as a robust 26% ROIC above WACC and stable 88.6% gross margins. In 2026, expanding Digital Experience offerings could deepen its advantage but requires vigilance against emerging cloud competitors.
Nutanix, Inc.: Hybrid Cloud Innovator Leveraging Platform Integration
Nutanix leverages a growing moat through integrated hybrid cloud solutions and automation, differentiating from Adobe’s content focus. Its ROIC advantage is slimmer at 2.3% above WACC but shows rapid improvement. The 2026 outlook hinges on scaling Kubernetes and multicloud adoption to disrupt entrenched infrastructure vendors.
Moat Strength Showdown: Subscription Lock-in vs. Platform Integration
Adobe’s wider moat is evident in its superior capital returns and entrenched user base, providing durable pricing power. Nutanix’s moat is narrower but rapidly strengthening through innovation. Overall, Adobe remains better positioned to defend market share against competitive pressures in 2026.
Which stock offers better returns?
The past year saw both Adobe Inc. and Nutanix, Inc. experience significant price declines, with decelerating bearish trends reflecting weakening momentum.
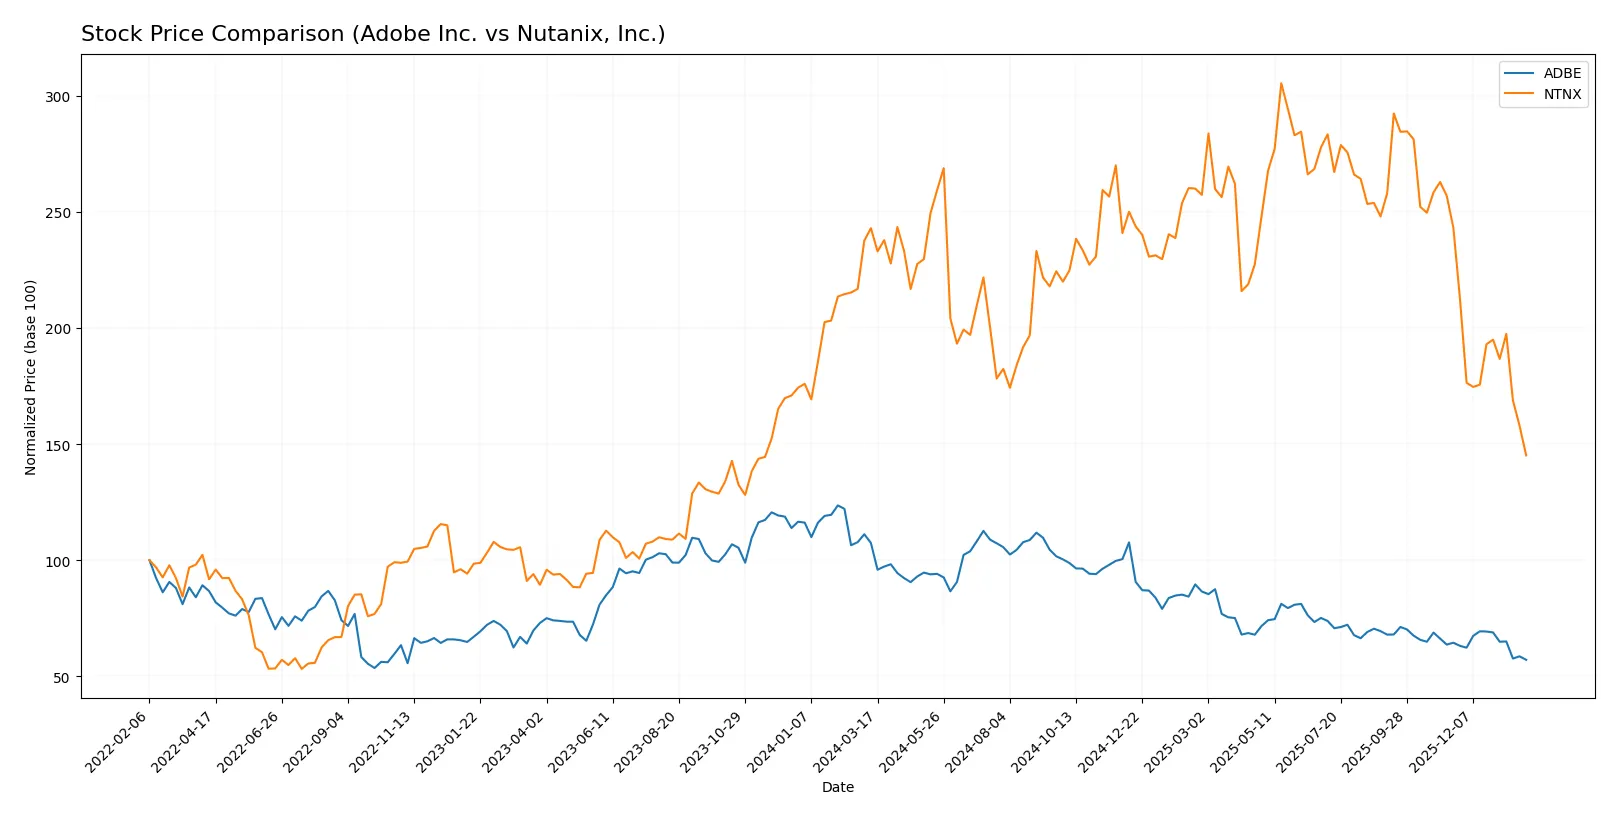
Trend Comparison
Adobe’s stock fell 46.85% over the last 12 months, marking a bearish trend with decelerating losses. Its price ranged from a high of 578.34 to a low of 293.25, showing high volatility (std dev 78.57).
Nutanix’s stock declined 40.27% in the same period, also bearish with deceleration. The price fluctuated between 82.77 and 39.33, but volatility remained much lower (std dev 9.26).
Both stocks show strong bearish trends, but Adobe’s larger percentage drop indicates weaker market performance relative to Nutanix.
Target Prices
Analysts present a clear consensus on the target prices for Adobe Inc. and Nutanix, Inc.
| Company | Target Low | Target High | Consensus |
|---|---|---|---|
| Adobe Inc. | 280 | 500 | 390.31 |
| Nutanix, Inc. | 53 | 90 | 64.67 |
Adobe’s consensus target price stands about 33% above its current price, indicating strong growth expectations. Nutanix’s target suggests a potential upside of over 60%, signaling optimism despite its lower market cap.

Don’t Let Luck Decide Your Entry Point
Optimize your entry points with our advanced ProRealTime indicators. You’ll get efficient buy signals with precise price targets for maximum performance. Start outperforming now!
How do institutions grade them?
This section compares the recent institutional grades for Adobe Inc. and Nutanix, Inc.:
Adobe Inc. Grades
The following table summarizes Adobe’s latest grades from major grading companies:
| Grading Company | Action | New Grade | Date |
|---|---|---|---|
| UBS | Maintain | Neutral | 2026-01-26 |
| Oppenheimer | Downgrade | Perform | 2026-01-13 |
| BMO Capital | Downgrade | Market Perform | 2026-01-09 |
| Jefferies | Downgrade | Hold | 2026-01-05 |
| Citigroup | Maintain | Neutral | 2025-12-17 |
| BMO Capital | Maintain | Outperform | 2025-12-15 |
| Keybanc | Downgrade | Underweight | 2025-12-15 |
| Wolfe Research | Maintain | Outperform | 2025-12-11 |
| TD Cowen | Maintain | Hold | 2025-12-11 |
| Oppenheimer | Maintain | Outperform | 2025-12-11 |
Nutanix, Inc. Grades
Below are Nutanix’s recent grades from recognized financial institutions:
| Grading Company | Action | New Grade | Date |
|---|---|---|---|
| Barclays | Downgrade | Equal Weight | 2026-01-15 |
| Morgan Stanley | Downgrade | Equal Weight | 2026-01-12 |
| RBC Capital | Maintain | Outperform | 2026-01-05 |
| Goldman Sachs | Maintain | Buy | 2025-11-28 |
| JP Morgan | Maintain | Overweight | 2025-11-26 |
| B of A Securities | Maintain | Buy | 2025-11-26 |
| Keybanc | Maintain | Overweight | 2025-11-26 |
| Needham | Maintain | Buy | 2025-11-26 |
| Wells Fargo | Maintain | Equal Weight | 2025-11-26 |
| Morgan Stanley | Maintain | Overweight | 2025-11-26 |
Which company has the best grades?
Nutanix generally holds stronger grades with multiple Buy and Overweight ratings. Adobe’s grades cluster around Neutral and Hold, with more downgrades. This may affect investor sentiment, with Nutanix appearing more favored recently.
Risks specific to each company
The following categories identify the critical pressure points and systemic threats facing both firms in the 2026 market environment:
1. Market & Competition
Adobe Inc.
- Dominates with diversified software segments and a strong Creative Cloud subscription base. Faces intense competition in digital media and experience platforms.
Nutanix, Inc.
- Operates in enterprise cloud infrastructure with innovative hybrid solutions but competes against larger cloud providers and infrastructure incumbents.
2. Capital Structure & Debt
Adobe Inc.
- Maintains moderate leverage (D/E 0.57) with strong interest coverage (33.96x), but a low current ratio (1.0) signals tight liquidity.
Nutanix, Inc.
- Shows favorable liquidity (current ratio 1.72) and negative debt-to-equity, indicating possible net cash position. Debt to assets is moderate (45.16%).
3. Stock Volatility
Adobe Inc.
- Beta of 1.53 indicates above-market volatility, typical for tech growth leaders in cyclical markets.
Nutanix, Inc.
- Beta of 0.49 reflects lower stock volatility, possibly due to smaller market cap and less speculative trading.
4. Regulatory & Legal
Adobe Inc.
- Faces standard tech industry risks including data privacy regulations and antitrust scrutiny, with global market exposure.
Nutanix, Inc.
- Also exposed to data security and compliance risks, especially across diverse international jurisdictions.
5. Supply Chain & Operations
Adobe Inc.
- Relies heavily on cloud infrastructure and partner networks; operational risks moderate but manageable due to scale.
Nutanix, Inc.
- Dependent on hardware and software integration for cloud platform; supply chain disruptions could impact customer deployments.
6. ESG & Climate Transition
Adobe Inc.
- Invests in sustainability initiatives and transparent ESG reporting; tech sector peers increasingly demand strong ESG credentials.
Nutanix, Inc.
- Emerging focus on ESG but smaller scale may limit resources; climate transition risks mainly indirect via energy use in data centers.
7. Geopolitical Exposure
Adobe Inc.
- Global footprint exposes it to trade tensions, data sovereignty laws, and geopolitical instability in key markets.
Nutanix, Inc.
- Similar global risks, with additional sensitivity to international supply chain and regional cloud regulations.
Which company shows a better risk-adjusted profile?
Adobe’s dominant market position and strong profitability metrics mitigate many risks, despite moderate liquidity concerns. Nutanix’s stronger liquidity and lower volatility are offset by weaker profitability and distress-zone bankruptcy risk. Adobe’s robust Altman Z-Score (8.14) versus Nutanix’s distress zone (1.11) confirms this.
The most impactful risk for Adobe is its tight liquidity, which could constrain flexibility amid rising costs. Nutanix’s critical risk is its financial distress signal, raising bankruptcy concerns in a competitive cloud market. Adobe’s superior capital structure and market moat give it a clearly better risk-adjusted profile today.
Final Verdict: Which stock to choose?
Adobe Inc. wields unmatched capital efficiency, consistently generating returns well above its cost of capital. Its superpower lies in durable profitability and scalable cash flow generation. A point of vigilance is its tight liquidity position, which might pressure operational flexibility. Adobe fits well with portfolios seeking steady growth with quality earnings.
Nutanix, Inc. commands a strategic moat through rapid revenue growth and a resilient balance sheet marked by solid liquidity and manageable debt. Its cloud infrastructure foothold provides recurring revenue safety, offering a cushion against market volatility. Nutanix suits investors aiming for growth at a reasonable price with exposure to emerging tech trends.
If you prioritize consistent value creation and strong profitability, Adobe outshines with its durable competitive advantage and cash machine profile. However, if you seek higher growth potential and better liquidity safety, Nutanix offers superior upside despite elevated volatility. Both represent slightly favorable scenarios but cater to distinct investor strategies.
Disclaimer: Investment carries a risk of loss of initial capital. The past performance is not a reliable indicator of future results. Be sure to understand risks before making an investment decision.
Go Further
I encourage you to read the complete analyses of Adobe Inc. and Nutanix, Inc. to enhance your investment decisions: