Home > Comparison > Technology > ADBE vs MDB
The strategic rivalry between Adobe Inc. and MongoDB, Inc. shapes the software infrastructure landscape. Adobe operates as a diversified software giant focusing on digital media and experience platforms. MongoDB specializes in flexible, cloud-native database solutions with a leaner operational footprint. This head-to-head pits established scale against agile innovation. This analysis aims to identify which business model offers the superior risk-adjusted return for a diversified technology portfolio in 2026.
Table of contents
Companies Overview
Adobe Inc. and MongoDB, Inc. stand as pivotal players in the software infrastructure landscape, shaping how enterprises manage digital content and data.
Adobe Inc.: Leader in Creative and Digital Experience Software
Adobe dominates the digital media market with its Creative Cloud subscription, driving revenue through creative software and document cloud services. In 2026, its strategic focus sharpens on expanding its Digital Experience segment to enhance customer engagement platforms for marketers and enterprises worldwide.
MongoDB, Inc.: Innovator in Database Solutions
MongoDB specializes in providing a general purpose database platform, generating income via its cloud-based MongoDB Atlas and enterprise software licenses. Its 2026 strategy emphasizes scaling its multi-cloud database-as-a-service, targeting hybrid and on-premise enterprise solutions.
Strategic Collision: Similarities & Divergences
Both firms operate in software infrastructure but diverge in approach—Adobe leverages a closed ecosystem of creative and marketing tools, while MongoDB promotes an open, flexible database architecture. Their main battleground lies in enterprise digital transformation, with Adobe focusing on content and experience, MongoDB on data management. This contrast defines their distinct investment profiles: Adobe as a mature, diversified software giant, MongoDB as a high-growth database innovator.
Income Statement Comparison
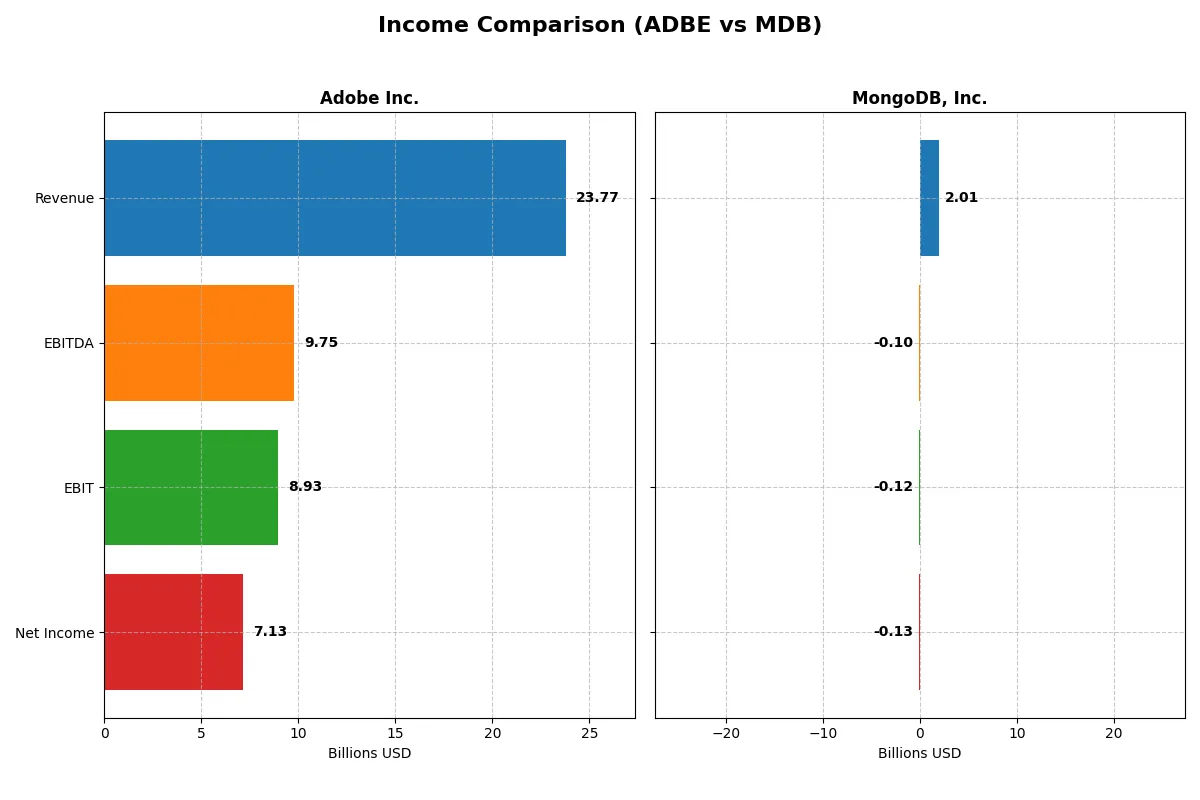
This data dissects the core profitability and scalability of both corporate engines to reveal who dominates the bottom line:
| Metric | Adobe Inc. (ADBE) | MongoDB, Inc. (MDB) |
|---|---|---|
| Revenue | 23.8B | 2.01B |
| Cost of Revenue | 2.71B | 535M |
| Operating Expenses | 12.4B | 1.69B |
| Gross Profit | 21.1B | 1.47B |
| EBITDA | 9.75B | -97M |
| EBIT | 8.93B | -124M |
| Interest Expense | 263M | 8.1M |
| Net Income | 7.13B | -129M |
| EPS | 16.73 | -1.73 |
| Fiscal Year | 2025 | 2025 |
Income Statement Analysis: The Bottom-Line Duel
This income statement comparison reveals which company operates with superior efficiency and profitability in its core business engine.
Adobe Inc. Analysis
Adobe’s revenue rose steadily from 15.8B in 2021 to 23.8B in 2025, with net income climbing from 4.8B to 7.1B. Its gross margin remains robust at 88.6%, while net margin holds at a strong 30%, signaling excellent cost control and pricing power. In 2025, Adobe’s EBIT surged 25.8%, confirming accelerating operational momentum.
MongoDB, Inc. Analysis
MongoDB’s revenue expanded rapidly, growing from 590M in 2021 to 2.0B in 2025, reflecting impressive top-line momentum. However, it remains unprofitable with a negative net margin of -6.4% in 2025, despite improving earnings growth rates. Its gross margin of 73.3% is healthy, but persistent operating losses indicate ongoing investment phases rather than immediate profitability.
Profitability Strength vs. Growth Trajectory
Adobe dominates with superior profitability and margin consistency, delivering solid net income growth and operational efficiency. MongoDB impresses with rapid revenue expansion but continues to lag on profitability, reflecting a classic growth-stage profile. Investors seeking stable earnings should favor Adobe’s mature efficiency; those targeting high growth at risk may consider MongoDB’s trajectory.
Financial Ratios Comparison
These vital ratios act as a diagnostic tool to expose the underlying fiscal health, valuation premiums, and capital efficiency of the companies compared below:
| Ratios | Adobe Inc. (ADBE) | MongoDB, Inc. (MDB) |
|---|---|---|
| ROE | 61.3% | -4.6% |
| ROIC | 36.7% | -7.4% |
| P/E | 19.1 | -157.9 |
| P/B | 11.7 | 7.3 |
| Current Ratio | 1.0 | 5.2 |
| Quick Ratio | 1.0 | 5.2 |
| D/E | 0.57 | 0.01 |
| Debt-to-Assets | 22.5% | 1.1% |
| Interest Coverage | 33.1 | -26.7 |
| Asset Turnover | 0.81 | 0.58 |
| Fixed Asset Turnover | 10.9 | 24.8 |
| Payout Ratio | 0 | 0 |
| Dividend Yield | 0% | 0% |
| Fiscal Year | 2025 | 2025 |
Efficiency & Valuation Duel: The Vital Signs
Financial ratios serve as a company’s DNA, uncovering hidden risks and operational strengths crucial for investor insight.
Adobe Inc.
Adobe demonstrates robust profitability with a 61.3% ROE and a strong 30% net margin, signaling operational excellence. Its P/E of 19.1 suggests a fairly valued stock, neither cheap nor stretched. Adobe does not pay dividends but reinvests aggressively in R&D, fueling sustained growth and shareholder value.
MongoDB, Inc.
MongoDB struggles with negative profitability metrics, including a -4.6% ROE and a -6.4% net margin, reflecting operational challenges. Despite a favorable negative P/E, its financial health shows weaknesses like a high current ratio of 5.2 and negative interest coverage. MongoDB prioritizes growth through heavy R&D spending over shareholder returns.
Balanced Profitability vs. Growth Risks
Adobe offers superior operational efficiency and a balanced valuation, presenting a more stable risk-reward profile. MongoDB’s high growth focus comes with significant profitability and financial risks. Investors seeking operational safety may prefer Adobe, while those targeting aggressive growth might consider MongoDB despite its challenges.
Which one offers the Superior Shareholder Reward?
I compare Adobe Inc. (ADBE) and MongoDB, Inc. (MDB) by their shareholder distribution philosophies. Adobe pays no dividends but aggressively repurchases shares, supported by strong free cash flow of $23.1B in 2025 and a payout ratio of zero, preserving cash for growth. MongoDB also pays zero dividends but lacks robust buyback activity, with weak free cash flow of $1.6B and persistent net losses. Adobe’s disciplined capital allocation and high operating margins (37.5% EBIT in 2025) contrast sharply with MongoDB’s negative profit margins and volatile leverage. I conclude Adobe offers a far more sustainable and attractive total return profile in 2026.
Comparative Score Analysis: The Strategic Profile
The radar chart reveals the fundamental DNA and trade-offs of Adobe Inc. and MongoDB, Inc., highlighting their financial strengths and valuation challenges:
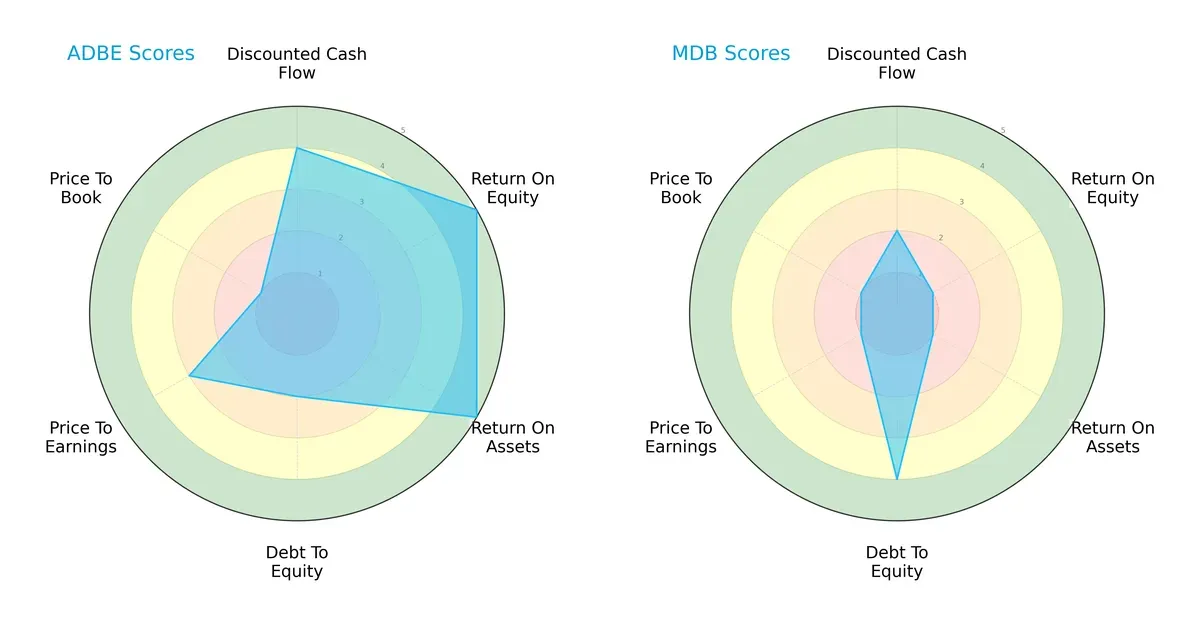
Adobe Inc. shows a balanced profile with strong ROE (5) and ROA (5), and solid DCF (4), but carries moderate leverage risk (Debt/Equity score 2). MongoDB leans heavily on low leverage (score 4) but suffers from weak profitability (ROE and ROA both 1) and poor valuation metrics (P/E and P/B scores 1). Adobe’s diversified strength contrasts with MongoDB’s reliance on conservative debt.
Bankruptcy Risk: Solvency Showdown
The Altman Z-Score gap signals vastly different bankruptcy risks between Adobe and MongoDB:
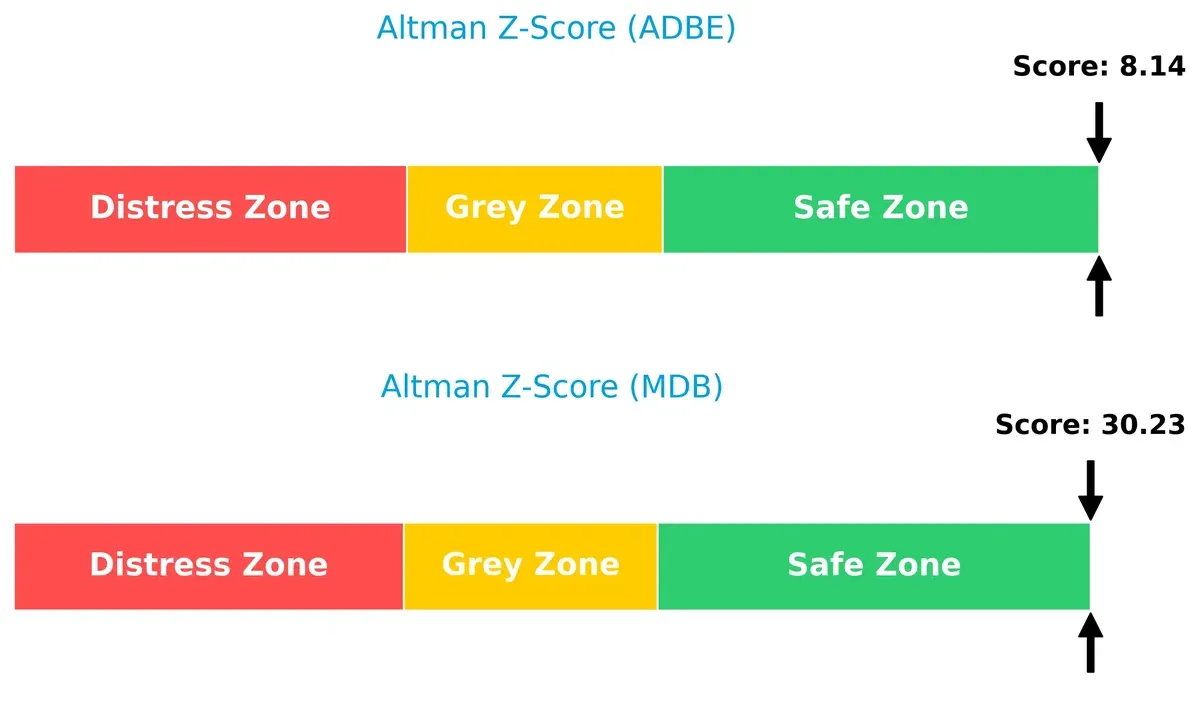
Adobe’s Z-Score of 8.1 and MongoDB’s 30.2 place both firms comfortably in the safe zone. However, MongoDB’s exceptionally high score suggests superior solvency and resilience in this cycle, while Adobe’s score, though strong, indicates comparatively higher financial risk.
Financial Health: Quality of Operations
Piotroski F-Scores reflect operational quality and financial robustness for both companies:
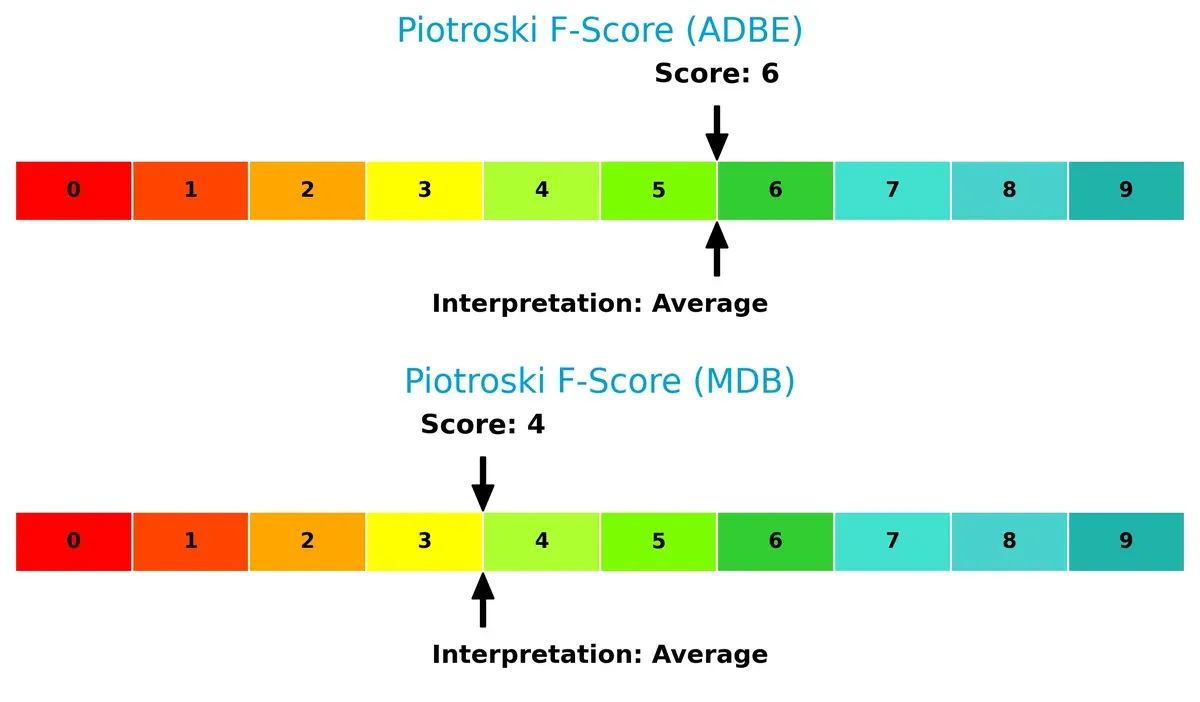
Adobe scores a solid 6, indicating average financial health with no immediate red flags. MongoDB’s 4 signals weaker internal metrics, suggesting operational challenges. Investors should watch MongoDB’s financial quality closely as it underperforms Adobe on this crucial health indicator.
How are the two companies positioned?
This section dissects Adobe and MongoDB’s operational DNA by comparing revenue distribution and internal dynamics. The goal is to confront their economic moats and reveal which model offers a more resilient, sustainable advantage today.
Revenue Segmentation: The Strategic Mix
This comparison dissects how Adobe Inc. and MongoDB, Inc. diversify their income streams and where their primary sector bets lie:
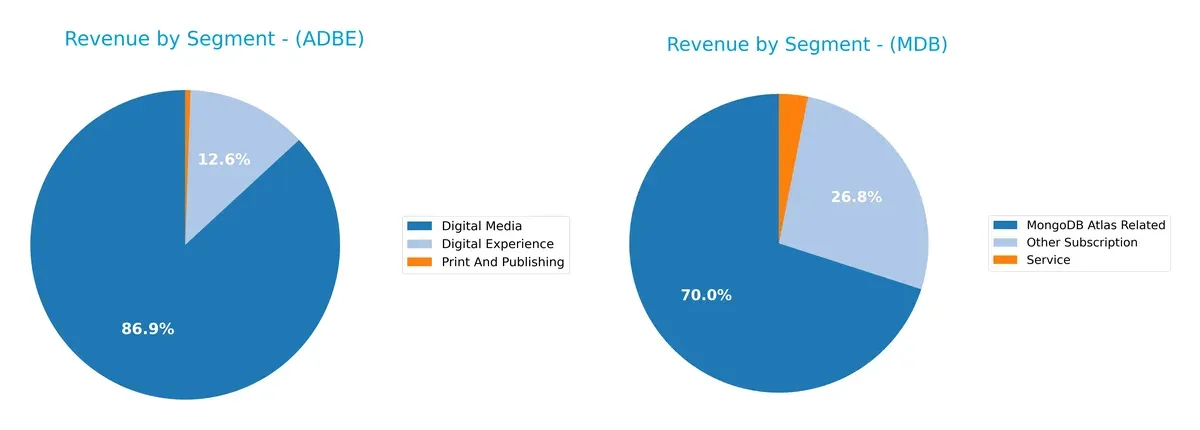
Adobe’s revenue pivots heavily on Digital Media, generating $40.4B in 2025, dwarfing its Digital Experience segment at $5.9B. MongoDB shows a more balanced mix, with $1.4B from Atlas-related services and $539M from other subscriptions. Adobe’s dominance in Digital Media signals strong ecosystem lock-in and brand moat. MongoDB’s diversified subscription base reduces concentration risk but highlights its growth stage reliance on cloud infrastructure.
Strengths and Weaknesses Comparison
This table compares the Strengths and Weaknesses of Adobe Inc. and MongoDB, Inc.:
Adobe Inc. Strengths
- Strong profitability metrics with 30% net margin and 61.34% ROE
- Favorable ROIC of 36.69% well above WACC
- Diversified revenue across Digital Media and Experience
- Robust global presence with $14.1B Americas revenue
- Low debt-to-assets ratio at 22.54%
- High fixed asset turnover at 10.88
MongoDB, Inc. Strengths
- Very low debt ratio at 0.01 D/E and 1.06% debt-to-assets
- Favorable quick ratio at 5.2 indicating liquidity
- High fixed asset turnover at 24.78
- Product revenue growing in MongoDB Atlas and subscriptions
- Geographic diversification with Americas, Asia Pacific, and EMEA presence
Adobe Inc. Weaknesses
- Current ratio at 1.0 signals tight short-term liquidity
- Unfavorable WACC at 10.6% relative to ROIC gap
- High PB ratio of 11.73 may indicate overvaluation
- No dividend yield
- Market concentration in Digital Media segment
- Moderate asset turnover at 0.81
MongoDB, Inc. Weaknesses
- Negative profitability with -6.43% net margin and -4.64% ROE
- Negative ROIC of -7.36%, below WACC
- Very unfavorable interest coverage at -15.26
- High current ratio of 5.2 may indicate inefficient capital use
- No dividend yield
- Lower asset turnover at 0.58
Adobe demonstrates a robust profitability and capital efficiency profile with diversified digital revenue streams. MongoDB shows strong liquidity and asset utilization but struggles with negative profitability and capital returns. Both companies face valuation and dividend yield challenges, signaling areas for strategic focus.
The Moat Duel: Analyzing Competitive Defensibility
A structural moat is the only reliable shield protecting long-term profits from relentless competitive erosion:
Adobe Inc.: Intangible Asset Moat with High Profit Durability
Adobe’s moat stems from its dominant Creative Cloud subscription ecosystem and brand power. It delivers a stellar 26% ROIC over WACC, reflecting margin stability and pricing power. In 2026, expanding Digital Experience offerings could deepen this advantage.
MongoDB, Inc.: Growth-Stage Technology Moat with Scaling Potential
MongoDB’s moat relies on its cloud-native, developer-focused database platform. Unlike Adobe, it has yet to convert growth into positive ROIC but shows a 63% ROIC trend increase. Its expanding Atlas cloud service signals rising competitive strength ahead.
Profitability Fortress vs. Growth Gambit
Adobe’s wider moat rests on strong, durable intangible assets and consistent value creation. MongoDB’s moat is narrower but improving rapidly, fueled by innovation and cloud adoption. Adobe is better equipped today to defend market share against competition.
Which stock offers better returns?
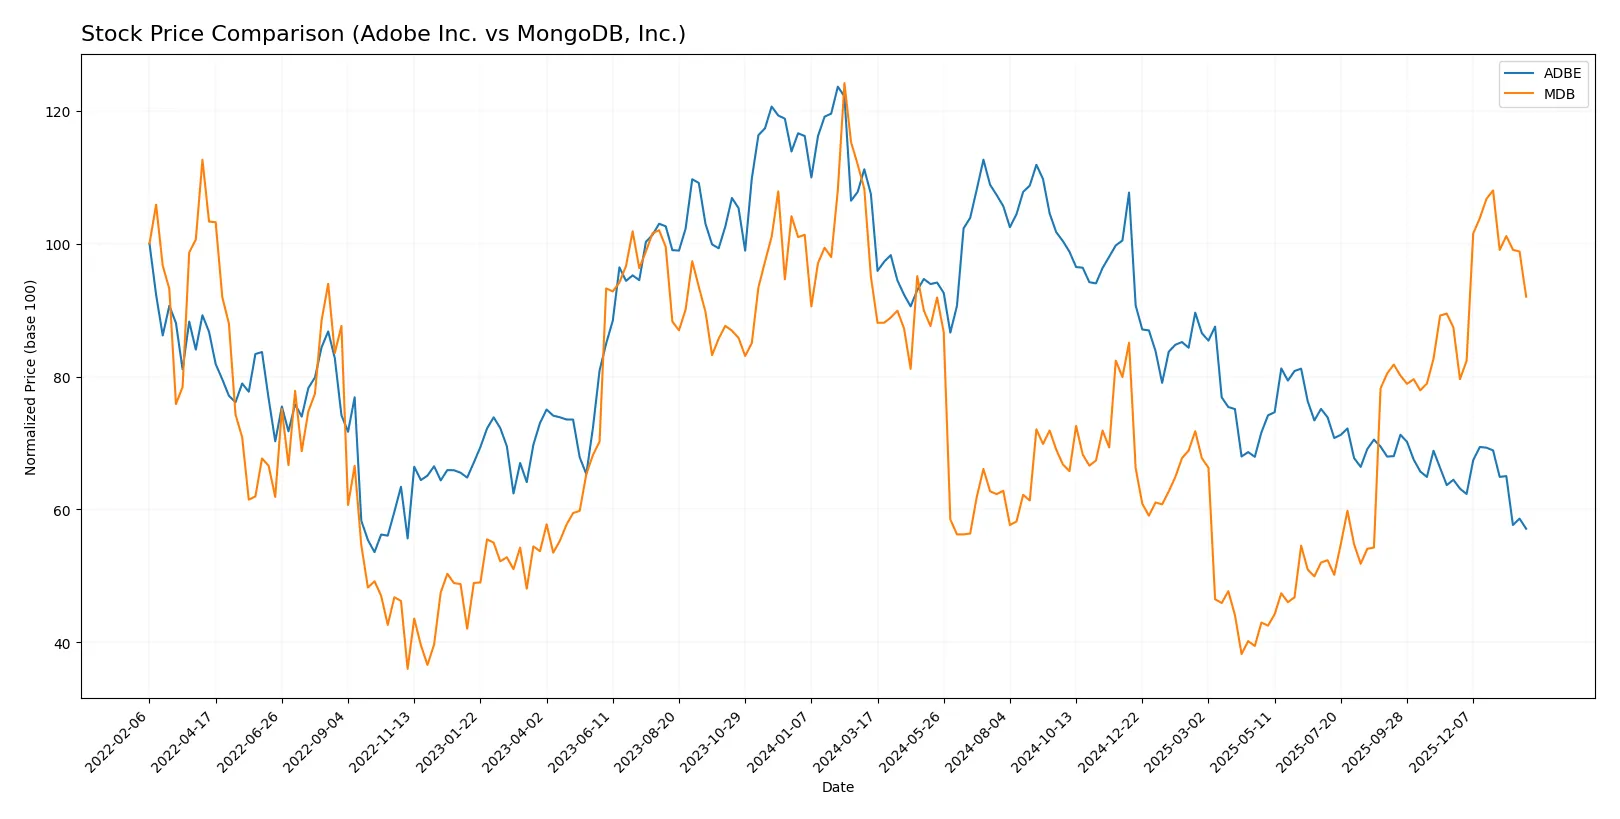
The past year shows contrasting price dynamics: Adobe Inc. declines sharply, while MongoDB, Inc. exhibits mild recovery with recent upward momentum.
Trend Comparison
Adobe Inc. experiences a significant 46.85% price decline over the past 12 months, reflecting a bearish trend with decelerating losses and high volatility. The stock peaked at 578.34 and bottomed at 293.25.
MongoDB, Inc. posts a 3.15% overall price drop, signaling a bearish trend but with accelerating movement. Recent gains of 5.31% indicate emerging bullish momentum despite notable volatility and a low of 154.39.
Comparing both, Adobe’s sharp decline contrasts with MongoDB’s modest loss and recent rebound, marking MongoDB as the better-performing stock over the last year.
Target Prices
Analysts show a bullish outlook for both Adobe Inc. and MongoDB, Inc., with target prices well above current market levels.
| Company | Target Low | Target High | Consensus |
|---|---|---|---|
| Adobe Inc. | 280 | 500 | 390.31 |
| MongoDB, Inc. | 375 | 500 | 445.2 |
Adobe’s consensus target at 390 exceeds its current price of 293, suggesting 33% upside potential. MongoDB’s target of 445 also significantly outpaces its 371 market price, reflecting strong growth expectations.

Don’t Let Luck Decide Your Entry Point
Optimize your entry points with our advanced ProRealTime indicators. You’ll get efficient buy signals with precise price targets for maximum performance. Start outperforming now!
How do institutions grade them?
Adobe Inc. Grades
Below is a summary of recent institutional grades for Adobe Inc.:
| Grading Company | Action | New Grade | Date |
|---|---|---|---|
| UBS | Maintain | Neutral | 2026-01-26 |
| Oppenheimer | Downgrade | Perform | 2026-01-13 |
| BMO Capital | Downgrade | Market Perform | 2026-01-09 |
| Jefferies | Downgrade | Hold | 2026-01-05 |
| Citigroup | Maintain | Neutral | 2025-12-17 |
| BMO Capital | Maintain | Outperform | 2025-12-15 |
| Keybanc | Downgrade | Underweight | 2025-12-15 |
| Wolfe Research | Maintain | Outperform | 2025-12-11 |
| TD Cowen | Maintain | Hold | 2025-12-11 |
| Oppenheimer | Maintain | Outperform | 2025-12-11 |
MongoDB, Inc. Grades
This table lists recent institutional grades for MongoDB, Inc.:
| Grading Company | Action | New Grade | Date |
|---|---|---|---|
| Needham | Maintain | Buy | 2026-01-20 |
| Barclays | Maintain | Overweight | 2026-01-12 |
| Needham | Maintain | Buy | 2026-01-12 |
| Truist Securities | Maintain | Buy | 2026-01-07 |
| Needham | Maintain | Buy | 2026-01-06 |
| RBC Capital | Maintain | Outperform | 2026-01-05 |
| Argus Research | Maintain | Buy | 2025-12-04 |
| Citigroup | Maintain | Buy | 2025-12-03 |
| Goldman Sachs | Maintain | Buy | 2025-12-03 |
| Oppenheimer | Maintain | Outperform | 2025-12-02 |
Which company has the best grades?
MongoDB, Inc. holds consistently bullish ratings, mostly “Buy” and “Outperform.” Adobe Inc. faces multiple downgrades and more cautious “Hold” and “Neutral” grades. Investors may view MongoDB as favored by analysts, indicating stronger near-term confidence.
Risks specific to each company
The following categories identify the critical pressure points and systemic threats facing both firms in the 2026 market environment:
1. Market & Competition
Adobe Inc.
- Dominates with strong brand and diversified product lines in software infrastructure.
MongoDB, Inc.
- Faces intense competition in cloud database services with evolving technology demands.
2. Capital Structure & Debt
Adobe Inc.
- Moderate leverage (D/E 0.57) with strong interest coverage (34x) supports sustainability.
MongoDB, Inc.
- Minimal debt (D/E 0.01) but negative interest coverage signals poor earnings to cover costs.
3. Stock Volatility
Adobe Inc.
- Higher beta (1.53) implies greater sensitivity to market swings.
MongoDB, Inc.
- Slightly lower beta (1.38) but still volatile given negative earnings profile.
4. Regulatory & Legal
Adobe Inc.
- Subject to data privacy and software licensing regulations globally.
MongoDB, Inc.
- Faces regulatory risks tied to cloud data security and cross-border data flows.
5. Supply Chain & Operations
Adobe Inc.
- Cloud-based delivery reduces physical supply chain risks but requires robust infrastructure.
MongoDB, Inc.
- Cloud platform dependent; operational risks tied to service reliability and scaling.
6. ESG & Climate Transition
Adobe Inc.
- Strong ESG focus with commitments to reduce carbon footprint and promote diversity.
MongoDB, Inc.
- Emerging ESG practices but less mature in formal climate transition strategies.
7. Geopolitical Exposure
Adobe Inc.
- Global operations expose it to trade tensions and geopolitical risks in key markets.
MongoDB, Inc.
- Concentrated US base reduces exposure but limits international growth amid geopolitical shifts.
Which company shows a better risk-adjusted profile?
Adobe’s most impactful risk lies in its exposure to fierce market competition and valuation concerns (high P/B). MongoDB’s principal risk is its negative profitability and weak capital efficiency, despite minimal debt. Adobe’s robust profitability and financial stability provide a better risk-adjusted profile. MongoDB’s negative margins and high operational leverage raise significant caution, underscored by its unfavorable interest coverage and earnings volatility.
Final Verdict: Which stock to choose?
Adobe Inc. shines with its superpower of durable value creation, evidenced by consistently high ROIC well above WACC. This cash-generating engine fuels innovation and growth. However, its tight liquidity position is a point of vigilance. Adobe suits portfolios seeking steady, long-term value and aggressive growth.
MongoDB, Inc. commands a strategic moat in its rapid revenue expansion and deep recurring cloud contracts. Its balance sheet shows exceptional liquidity and low leverage, offering relative safety compared to Adobe. Still, it currently destroys value and faces profitability challenges, fitting growth-at-a-reasonable-price (GARP) or high-risk growth portfolios.
If you prioritize durable profitability and value creation, Adobe outshines with its proven moat and financial strength. However, if you seek high-growth potential with better liquidity safety and can tolerate near-term losses, MongoDB offers a compelling, albeit riskier, scenario. Both require careful risk assessment aligned with your investment horizon.
Disclaimer: Investment carries a risk of loss of initial capital. The past performance is not a reliable indicator of future results. Be sure to understand risks before making an investment decision.
Go Further
I encourage you to read the complete analyses of Adobe Inc. and MongoDB, Inc. to enhance your investment decisions: