Home > Comparison > Technology > ADBE vs INFA
The strategic rivalry between Adobe Inc. and Informatica Inc. shapes the evolution of the technology software infrastructure sector. Adobe operates as a diversified software powerhouse with a broad portfolio spanning digital media and experience platforms. Informatica emphasizes AI-driven data management solutions tailored for multi-cloud environments. This analysis dissects their contrasting operational models to identify which company offers the superior risk-adjusted return potential for a diversified portfolio in 2026.
Table of contents
Companies Overview
Adobe Inc. and Informatica Inc. stand as influential players in the software infrastructure sector.
Adobe Inc.: Creative and Customer Experience Powerhouse
Adobe dominates as a diversified software company with a market cap of 123B. Its core revenue engine hinges on subscription-based access to Creative Cloud and its Digital Experience platform. In 2026, Adobe emphasizes expanding digital media and customer experience solutions, targeting content creators and enterprises worldwide to solidify its leadership in creative and marketing software.
Informatica Inc.: Data Integration and AI-Driven Insights Leader
Informatica operates as a specialized software firm focused on AI-powered data management platforms, holding a market cap near 7.5B. It generates revenue from enterprise-scale data integration, API management, and governance products. The company’s 2026 strategy centers on enhancing interoperability across multi-cloud and hybrid environments, aiming to unify complex data ecosystems for large enterprises.
Strategic Collision: Similarities & Divergences
Both companies build infrastructure software but diverge sharply: Adobe operates a closed ecosystem focused on creative content and customer experience, while Informatica champions an open, interoperable platform for data management. Their primary battleground lies in serving enterprise digital transformation needs, yet Adobe’s broader market reach contrasts with Informatica’s niche specialization. This difference shapes distinct risk profiles and growth trajectories for investors.
Income Statement Comparison
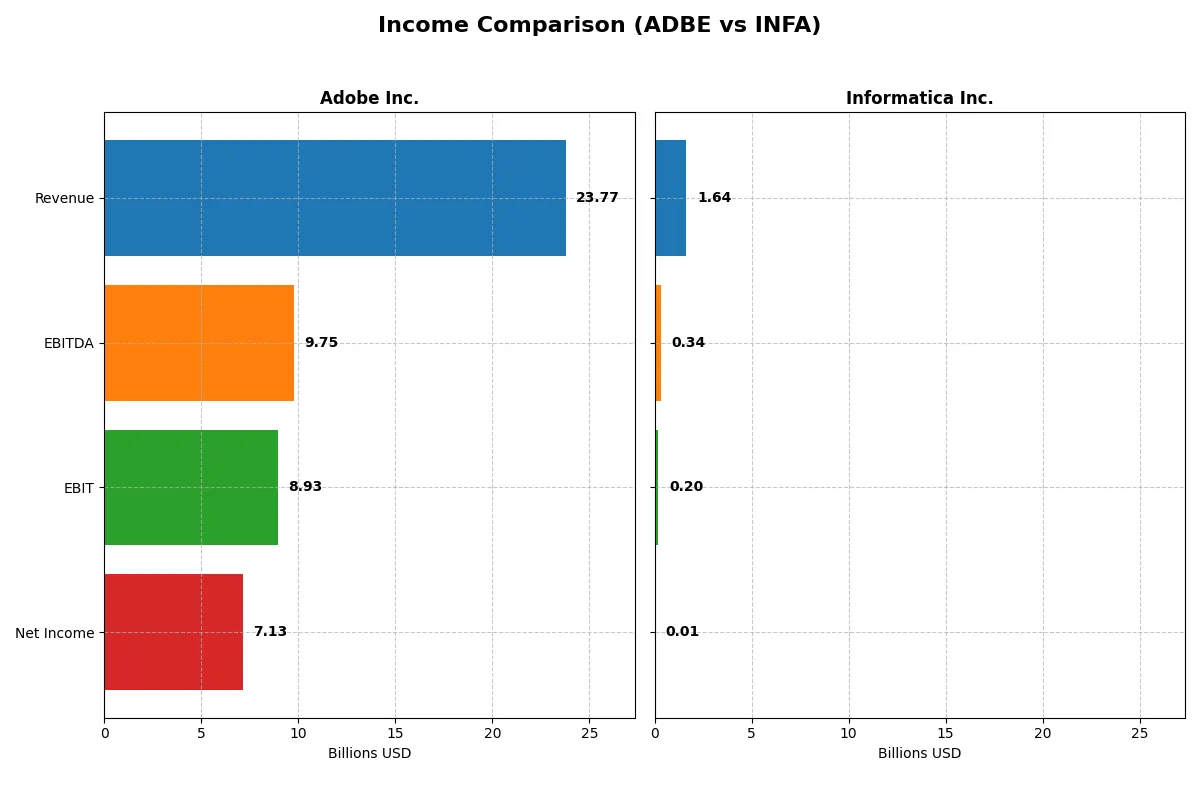
This data dissects the core profitability and scalability of both corporate engines to reveal who dominates the bottom line:
| Metric | Adobe Inc. (ADBE) | Informatica Inc. (INFA) |
|---|---|---|
| Revenue | 23.77B | 1.64B |
| Cost of Revenue | 2.71B | 326M |
| Operating Expenses | 12.36B | 1.19B |
| Gross Profit | 21.06B | 1.31B |
| EBITDA | 9.75B | 339M |
| EBIT | 8.93B | 199M |
| Interest Expense | 263M | 146M |
| Net Income | 7.13B | 9.93M |
| EPS | 16.73 | 0.0329 |
| Fiscal Year | 2025 | 2024 |
Income Statement Analysis: The Bottom-Line Duel
This income statement comparison reveals which company operates its business engine with superior efficiency and profit generation.
Adobe Inc. Analysis
Adobe shows a strong revenue climb from $15.8B in 2021 to $23.8B in 2025, with net income growing 48% overall. Its gross margin stays robust near 89%, while net margin hits a solid 30% in 2025. Adobe’s EBIT margin improved to 37.6%, reflecting excellent cost control and operational leverage, accelerating earnings per share by 35% last year.
Informatica Inc. Analysis
Informatica’s revenue grew more modestly, reaching $1.64B in 2024 from $1.32B in 2020, with net income turning positive in 2024 after losses. Gross margin remains healthy at 80%, but net margin hovers just above breakeven at 0.6%. EBIT margin improved sharply to 12.2% in 2024, signaling a profitable turnaround, while earnings per share more than doubled last year.
Margin Excellence vs. Recovery Momentum
Adobe clearly dominates with significantly higher margins and consistent profit growth, showcasing its operational efficiency and scale. Informatica makes impressive progress recovering from losses, but its narrow net margin limits profitability. Investors seeking sustained margin power find Adobe’s profile more compelling, while Informatica’s turnaround suits those focused on growth potential amid improving fundamentals.
Financial Ratios Comparison
These vital ratios act as a diagnostic tool to expose the underlying fiscal health, valuation premiums, and capital efficiency of the companies compared below:
| Ratios | Adobe Inc. (ADBE) | Informatica Inc. (INFA) |
|---|---|---|
| ROE | 61.3% | 0.43% |
| ROIC | 36.7% | 0.56% |
| P/E | 19.1 | 788 |
| P/B | 11.7 | 3.39 |
| Current Ratio | 1.0 | 1.82 |
| Quick Ratio | 1.0 | 1.82 |
| D/E | 0.57 | 0.81 |
| Debt-to-Assets | 22.5% | 35.2% |
| Interest Coverage | 33.1 | 0.87 |
| Asset Turnover | 0.81 | 0.31 |
| Fixed Asset Turnover | 10.9 | 8.75 |
| Payout ratio | 0 | 0.12% |
| Dividend yield | 0% | 0.00015% |
| Fiscal Year | 2025 | 2024 |
Efficiency & Valuation Duel: The Vital Signs
Ratios act as the company’s DNA, revealing hidden risks and operational excellence behind headline numbers.
Adobe Inc.
Adobe demonstrates strong profitability with a 61.34% ROE and a healthy 30% net margin, signaling operational excellence. The P/E ratio at 19.13 suggests a fairly valued stock, neither expensive nor cheap. Adobe refrains from dividends, opting instead to reinvest heavily in R&D, fueling growth and maintaining its competitive moat.
Informatica Inc.
Informatica’s ratio data is unavailable, limiting direct comparison. Without key profitability and valuation metrics, assessing its operational efficiency or valuation is impossible. This lack of transparency raises concerns about risk assessment and complicates evaluating shareholder returns or reinvestment strategies.
Clear Edge for Adobe Amid Ratio Transparency
Adobe clearly leads with robust profitability and reasonable valuation, coupled with reinvestment in innovation. Informatica’s missing ratio data hampers risk and reward evaluation. Investors favoring visible operational strength and disciplined capital allocation will find Adobe’s profile more fitting.
Which one offers the Superior Shareholder Reward?
I observe Adobe Inc. (ADBE) adopts a zero-dividend policy, focusing on robust free cash flow (FCF) generation of 23.1/share in 2025. Its aggressive buyback programs, supported by a low payout ratio of zero, signal capital reinvestment for growth. Conversely, Informatica Inc. (INFA) pays a negligible dividend yield near 0%, with a payout ratio close to zero, reflecting its limited net margin of 0.6% and struggling profitability. INFA’s free cash flow per share stands at only 1.35 in 2024, with a modest buyback presence. I conclude ADBE’s shareholder return model, driven by sustainable buybacks and reinvestment, offers a far superior total return profile in 2026.
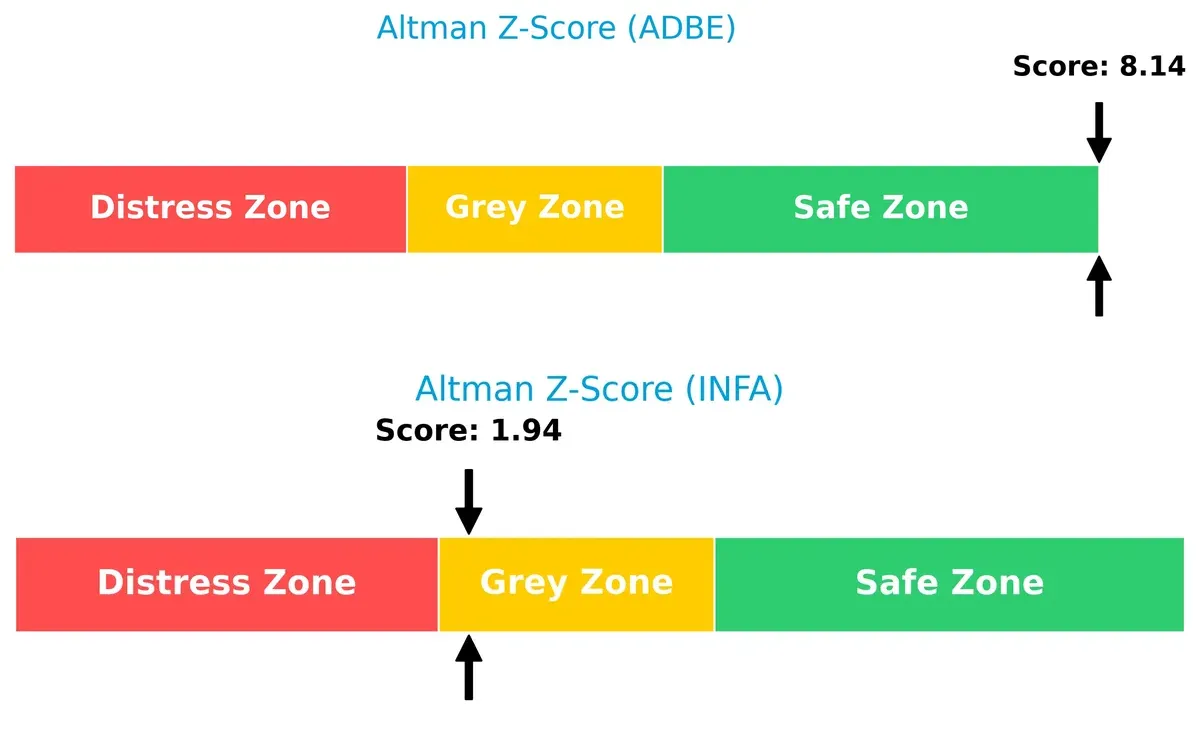
Bankruptcy Risk: Solvency Showdown
The Altman Z-Score comparison reveals Adobe Inc. firmly in the safe zone with 8.14, indicating strong long-term survival prospects. Informatica Inc., at 1.94 in the grey zone, faces moderate bankruptcy risk in this cycle:
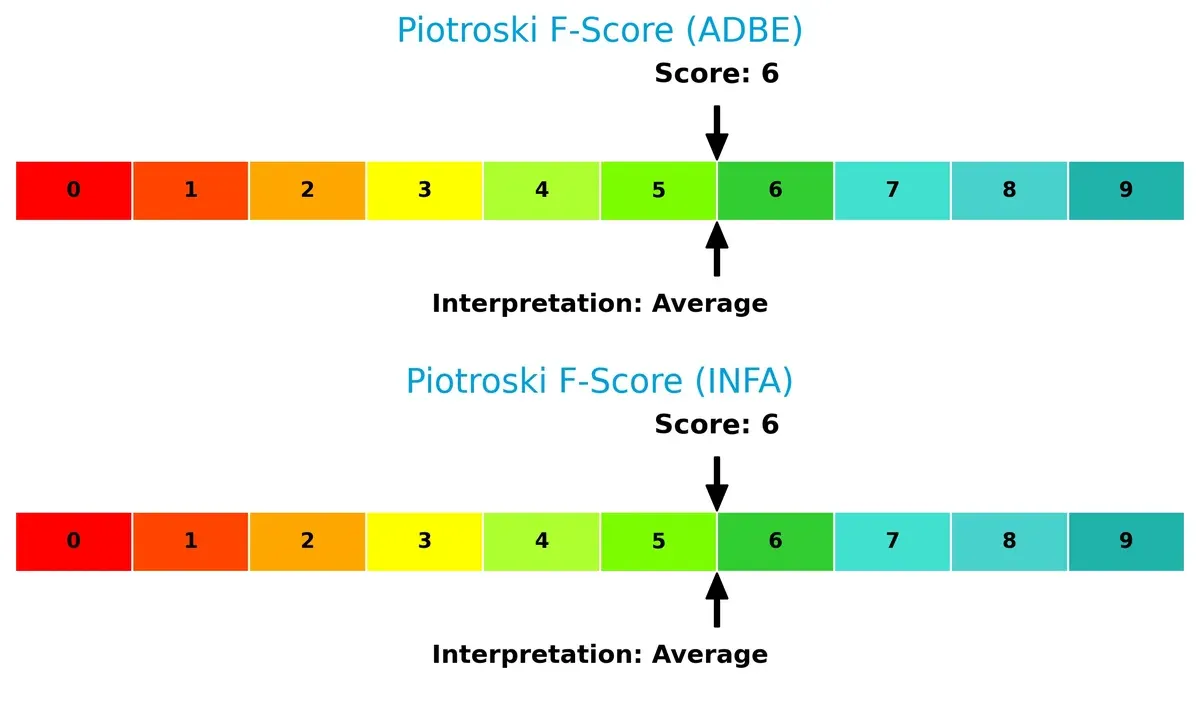
Financial Health: Quality of Operations
Both Adobe and Informatica score 6 on the Piotroski F-Score, signaling average financial health. Neither shows acute red flags, but neither excels in operational quality compared to top-tier peers:
How are the two companies positioned?
This section dissects the operational DNA of Adobe and Informatica by comparing their revenue distribution and internal dynamics. The goal is to confront their economic moats and identify which model offers the most resilient, sustainable competitive advantage today.
Revenue Segmentation: The Strategic Mix
This comparison dissects how Adobe Inc. and Informatica Inc. diversify their income streams and reveals where their primary sector bets lie:
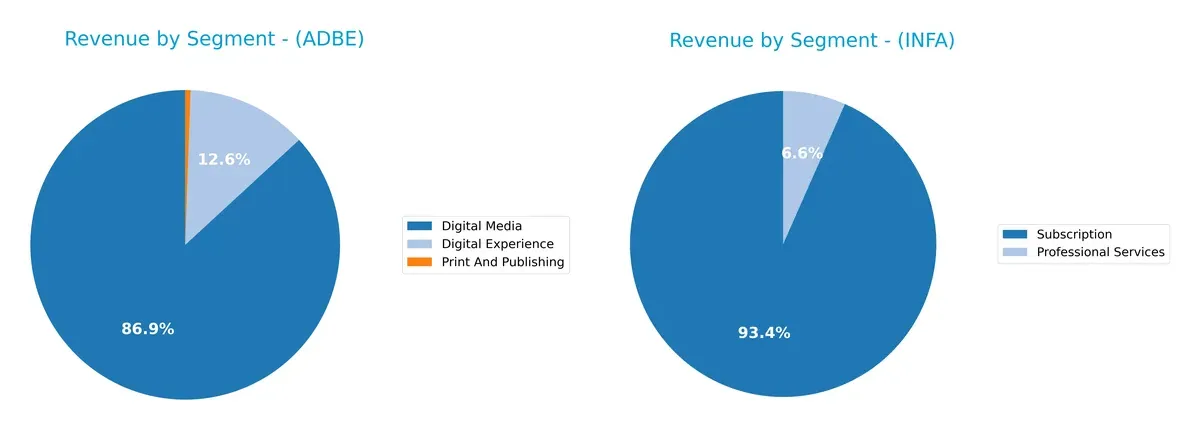
Adobe’s revenue pivots heavily on Digital Media, generating $40.4B in 2025, dwarfing its Digital Experience segment at $5.9B. This concentration anchors Adobe’s dominance in creative software. Informatica shows a more balanced mix, with Subscription revenue around $1.1B and License and Service close behind at $1B in 2024. Adobe’s reliance on one dominant segment poses concentration risk, while Informatica’s diversified streams suggest resilience through mixed licensing and cloud services.
Strengths and Weaknesses Comparison
This table compares the Strengths and Weaknesses of Adobe Inc. and Informatica Inc.:
Adobe Inc. Strengths
- Diversified revenue from Digital Experience, Media, and Print segments
- Strong profitability with 30% net margin and 61.34% ROE
- Global presence with significant Americas and EMEA sales
- Solid financial health with favorable debt to assets and interest coverage ratios
Informatica Inc. Strengths
- Revenue diversification between Subscription and Professional Services
- Geographic sales spread across North America, EMEA, Asia Pacific, and Latin America
Adobe Inc. Weaknesses
- Current ratio at 1.0 signals tight liquidity
- High price-to-book ratio indicates potentially overvalued equity
- Lack of dividend yield may deter income investors
Informatica Inc. Weaknesses
- Lack of publicly available financial ratios limits transparency
- Smaller revenue scale compared to large industry peers
- Limited disclosed profitability metrics restrict performance assessment
Adobe demonstrates a robust profitability profile and broad geographic reach but faces liquidity and valuation concerns. Informatica shows diversification but lacks detailed financial data, complicating a full assessment of its financial strength and market position.
The Moat Duel: Analyzing Competitive Defensibility
A structural moat is the only reliable shield protecting long-term profits from relentless competitive erosion. Let’s dissect the moats of two software infrastructure players:
Adobe Inc.: Intangible Assets Powerhouse
Adobe’s moat hinges on its intangible assets, especially the Creative Cloud subscription ecosystem. This drives high ROIC (26% above WACC) and margin stability near 30%. New AI-powered creative tools in 2026 promise to deepen this moat further.
Informatica Inc.: Data Integration Network Effects
Informatica’s competitive edge arises from its AI-driven data management platform, creating network effects around multi-cloud integration. Though smaller, it demonstrates rapid EBIT and net margin growth, signaling an expanding foothold in enterprise data ecosystems.
Moat Strength Showdown: Intangible Assets vs. Network Effects
Adobe boasts a wider, more durable moat with sustained high ROIC and global scale. Informatica’s network effect is promising but less proven at scale. Adobe remains better positioned to defend and expand its market share through innovation and entrenched customer relationships.
Which stock offers better returns?
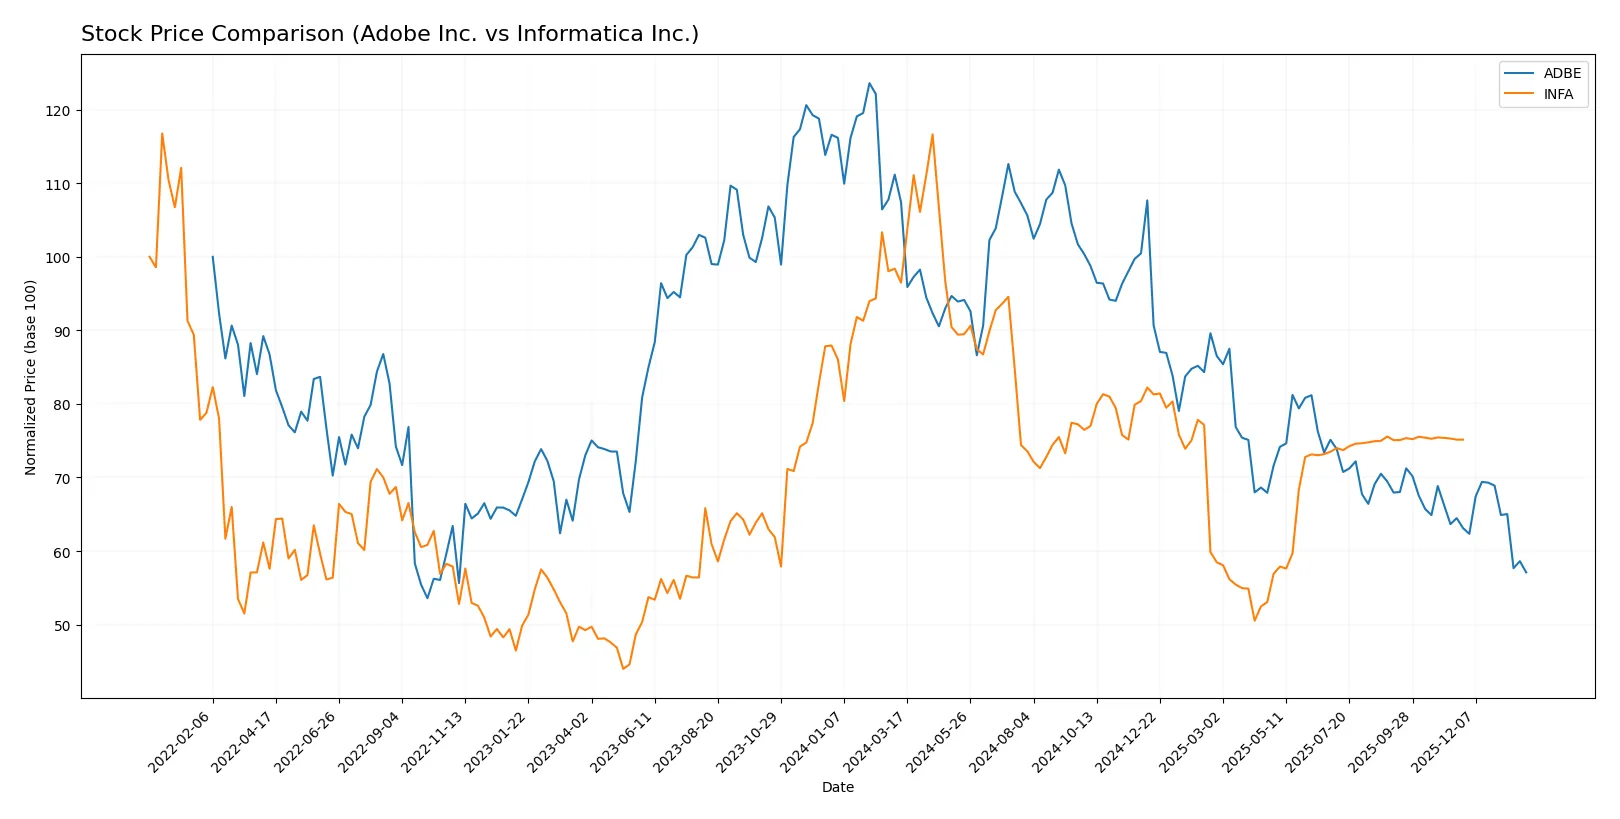
The past year shows significant price declines for both stocks, with Adobe Inc. experiencing heavier losses amid volatile trading, while Informatica Inc. faced milder declines with less price fluctuation.
Trend Comparison
Adobe Inc. stock dropped 46.85% over the past 12 months, marking a bearish trend with decelerating losses. Volatility is high, with prices ranging from $293 to $578.
Informatica Inc. declined 12.68% in the same period, also bearish but with accelerating losses. Price swings are modest, between $16.67 and $38.48, indicating lower volatility.
Adobe’s stock suffered the largest drop and greater volatility, delivering weaker market performance than Informatica over the past year.
Target Prices
Analysts present a cautiously optimistic consensus for Adobe Inc. and Informatica Inc.
| Company | Target Low | Target High | Consensus |
|---|---|---|---|
| Adobe Inc. | 280 | 500 | 390.31 |
| Informatica Inc. | 27 | 27 | 27 |
Adobe’s consensus target of 390.31 suggests a substantial upside from the current 293.25, reflecting confidence in its durable software moat. Informatica’s flat target at 27 offers modest upside from 24.79, indicating a more cautious outlook.

Don’t Let Luck Decide Your Entry Point
Optimize your entry points with our advanced ProRealTime indicators. You’ll get efficient buy signals with precise price targets for maximum performance. Start outperforming now!
How do institutions grade them?
Here is a summary of recent institutional grades for Adobe Inc. and Informatica Inc.:
Adobe Inc. Grades
The following table shows the latest grades from recognized institutions for Adobe Inc.:
| Grading Company | Action | New Grade | Date |
|---|---|---|---|
| UBS | Maintain | Neutral | 2026-01-26 |
| Oppenheimer | Downgrade | Perform | 2026-01-13 |
| BMO Capital | Downgrade | Market Perform | 2026-01-09 |
| Jefferies | Downgrade | Hold | 2026-01-05 |
| Citigroup | Maintain | Neutral | 2025-12-17 |
| BMO Capital | Maintain | Outperform | 2025-12-15 |
| Keybanc | Downgrade | Underweight | 2025-12-15 |
| Wolfe Research | Maintain | Outperform | 2025-12-11 |
| TD Cowen | Maintain | Hold | 2025-12-11 |
| Oppenheimer | Maintain | Outperform | 2025-12-11 |
Informatica Inc. Grades
The following table shows the latest grades from recognized institutions for Informatica Inc.:
| Grading Company | Action | New Grade | Date |
|---|---|---|---|
| Guggenheim | Downgrade | Neutral | 2025-08-07 |
| UBS | Maintain | Neutral | 2025-08-07 |
| Baird | Maintain | Neutral | 2025-05-28 |
| JP Morgan | Downgrade | Neutral | 2025-05-28 |
| RBC Capital | Maintain | Sector Perform | 2025-05-28 |
| Wolfe Research | Downgrade | Peer Perform | 2025-05-28 |
| Wells Fargo | Maintain | Equal Weight | 2025-05-28 |
| Truist Securities | Downgrade | Hold | 2025-05-28 |
| RBC Capital | Maintain | Sector Perform | 2025-05-27 |
| UBS | Maintain | Neutral | 2025-05-16 |
Which company has the best grades?
Adobe Inc. holds generally higher grades such as Outperform and Market Perform, despite recent downgrades. Informatica Inc. maintains mostly Neutral and Sector Perform ratings without upgrades. Investors may perceive Adobe as the stronger pick based on these institutional views.
Risks specific to each company
In 2026’s fast-evolving tech landscape, these categories expose critical pressure points and systemic threats confronting Adobe Inc. and Informatica Inc.:
1. Market & Competition
Adobe Inc.
- Dominates digital media with Creative Cloud but faces intense competition from cloud-native rivals.
Informatica Inc.
- Competes in AI-powered data management with fewer resources and less brand recognition.
2. Capital Structure & Debt
Adobe Inc.
- Maintains moderate leverage (D/E 0.57) and strong interest coverage (33.96), signaling financial stability.
Informatica Inc.
- Lacks detailed public debt data; potential risk for undisclosed leverage pressures.
3. Stock Volatility
Adobe Inc.
- Exhibits higher beta (1.53), indicating sensitivity to market swings and sector cyclicality.
Informatica Inc.
- Shows more moderate beta (1.14), suggesting somewhat lower market volatility exposure.
4. Regulatory & Legal
Adobe Inc.
- Faces regulatory scrutiny on data privacy and intellectual property in multiple jurisdictions.
Informatica Inc.
- Encounters compliance demands in data governance, with potential risks from emerging cloud regulations.
5. Supply Chain & Operations
Adobe Inc.
- Operates a global SaaS platform with risks from cloud infrastructure disruptions.
Informatica Inc.
- Relies on complex multi-cloud integrations, raising operational risks amid evolving tech standards.
6. ESG & Climate Transition
Adobe Inc.
- Invests in sustainability initiatives but must improve governance transparency.
Informatica Inc.
- Faces growing pressure to enhance ESG disclosures and align with climate-related data policies.
7. Geopolitical Exposure
Adobe Inc.
- Global footprint exposes it to US-China tensions impacting cloud and software exports.
Informatica Inc.
- Primarily US-focused, with limited but growing international exposure susceptible to geopolitical shifts.
Which company shows a better risk-adjusted profile?
Adobe’s dominant market position and solid financial metrics outweigh its high valuation and volatility. Informatica’s limited data transparency and grey-zone bankruptcy risk temper its appeal. Adobe’s Altman Z-Score of 8.14 places it firmly in the safe zone, while Informatica’s 1.94 signals caution. I see Adobe as better positioned on a risk-adjusted basis, despite industry headwinds.
Final Verdict: Which stock to choose?
Adobe Inc. excels as a cash-generating powerhouse with a durable competitive moat, evidenced by its strong ROIC far exceeding WACC. Its main point of vigilance lies in a tight liquidity position, which could pressure short-term flexibility. Adobe fits well in aggressive growth portfolios seeking sustained profitability and innovation.
Informatica Inc. offers strategic value through its niche in data management with consistent revenue streams and a safer liquidity profile than Adobe. However, it lags in profitability and carries higher leverage risks. Informatica suits investors targeting GARP strategies who value steady operational improvement with moderate risk tolerance.
If you prioritize robust value creation and market leadership, Adobe outshines with its strong profitability and moat. However, if you seek better liquidity safety and steady income growth, Informatica offers better stability despite weaker margins. Each scenario appeals to distinct investor profiles balancing growth and risk.
Disclaimer: Investment carries a risk of loss of initial capital. The past performance is not a reliable indicator of future results. Be sure to understand risks before making an investment decision.
Go Further
I encourage you to read the complete analyses of Adobe Inc. and Informatica Inc. to enhance your investment decisions: