Home > Comparison > Technology > ADBE vs GDDY
The strategic rivalry between Adobe Inc. and GoDaddy Inc. shapes the future of software infrastructure. Adobe operates a diversified, enterprise-focused software platform emphasizing digital media and experience. GoDaddy targets small businesses with cloud-based domain registration, hosting, and marketing tools. This analysis probes their contrasting operational models and growth strategies to determine which company offers superior risk-adjusted returns for a diversified portfolio in 2026.
Table of contents
Companies Overview
Adobe Inc. and GoDaddy Inc. both shape the software infrastructure landscape, serving distinct digital needs globally.
Adobe Inc.: Creative and Experience Software Leader
Adobe defines itself as a diversified software company focused on creative and marketing solutions. Its core revenue engine revolves around subscription-based access to Creative Cloud and integrated digital experience platforms. In 2026, Adobe emphasizes expanding its cloud-based document services and customer experience management to deepen enterprise relationships.
GoDaddy Inc.: Digital Identity and Web Presence Enabler
GoDaddy operates as a cloud-based technology provider specializing in domain registration and web hosting. It monetizes by offering hosting, security, and marketing tools to small businesses and individuals. The company’s 2026 strategy prioritizes enhancing its website builder and e-commerce capabilities to capture growing SMB digital adoption.
Strategic Collision: Similarities & Divergences
Adobe and GoDaddy share a focus on software infrastructure but diverge sharply in customer focus and product ecosystems. Adobe targets creative professionals and enterprises with integrated cloud suites, while GoDaddy serves SMBs with modular web presence tools. Their battleground lies in digital content creation versus digital identity management. This contrast creates distinct investment profiles: Adobe’s emphasis on innovation and scale contrasts with GoDaddy’s niche SMB growth trajectory.
Income Statement Comparison
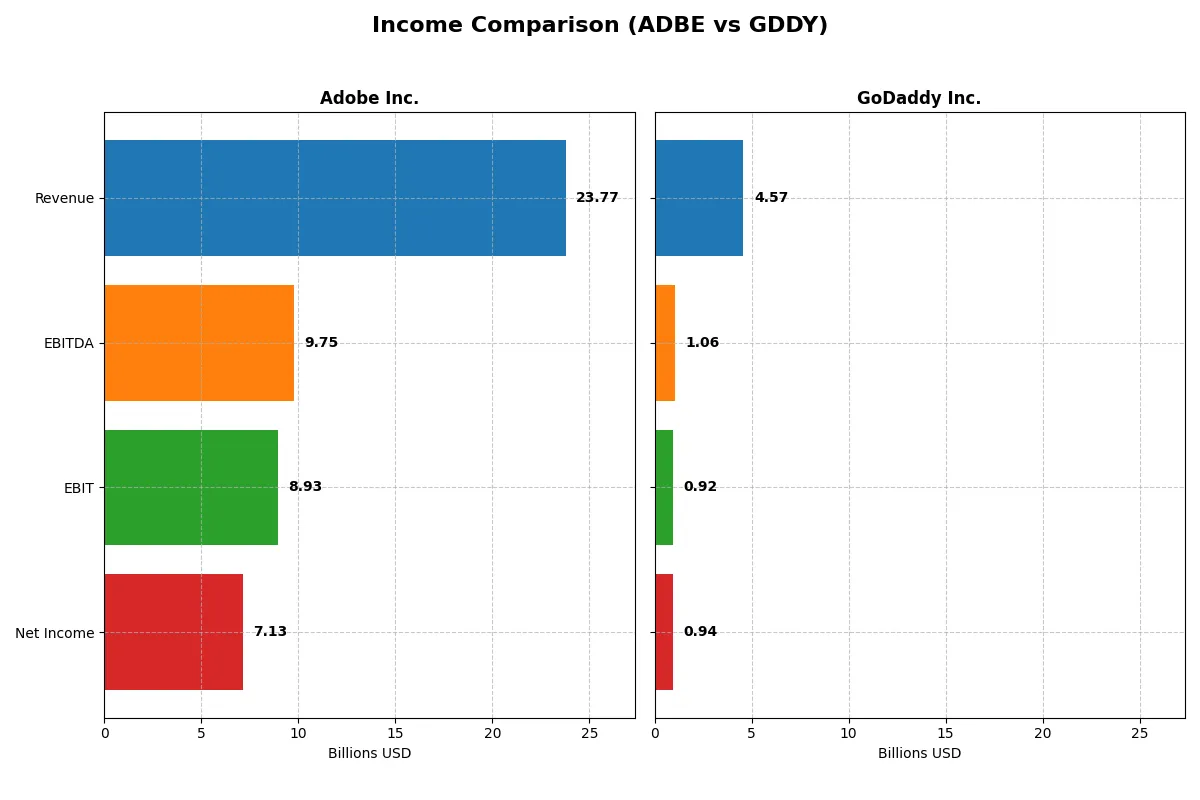
This data dissects the core profitability and scalability of both corporate engines to reveal who dominates the bottom line:
| Metric | Adobe Inc. (ADBE) | GoDaddy Inc. (GDDY) |
|---|---|---|
| Revenue | 23.8B | 4.57B |
| Cost of Revenue | 2.71B | 1.65B |
| Operating Expenses | 12.4B | 2.03B |
| Gross Profit | 21.1B | 2.92B |
| EBITDA | 9.75B | 1.06B |
| EBIT | 8.93B | 924M |
| Interest Expense | 263M | 158M |
| Net Income | 7.13B | 937M |
| EPS | 16.73 | 6.63 |
| Fiscal Year | 2025 | 2024 |
Income Statement Analysis: The Bottom-Line Duel
This income statement comparison reveals the true efficiency and profitability of Adobe Inc. and GoDaddy Inc.’s corporate engines over recent years.
Adobe Inc. Analysis
Adobe’s revenue climbs steadily from $15.8B in 2021 to $23.8B in 2025, with net income rising from $4.8B to $7.1B. The company sustains a robust gross margin near 89%, driving a strong 30% net margin in 2025. Its EBIT margin expands to 37.6%, signaling operational efficiency and solid earnings momentum.
GoDaddy Inc. Analysis
GoDaddy’s revenue grows from $3.3B in 2020 to $4.6B in 2024, with net income surging from a loss of $495M to $937M. Gross margin stabilizes around 64%, while net margin reaches 20.5% in 2024. Despite a recent dip in one-year net margin growth, the company shows significant long-term earnings expansion, reflecting improving profitability.
Margin Leadership vs. Earnings Growth
Adobe leads with superior margins and consistent revenue growth, delivering greater operational leverage and profit scale. GoDaddy impresses with rapid net income recovery and strong earnings growth over the period but maintains lower margin ratios. Adobe’s profile suits investors prioritizing margin stability; GoDaddy appeals to those focused on turnaround momentum.
Financial Ratios Comparison
These vital ratios act as a diagnostic tool to expose the underlying fiscal health, valuation premiums, and capital efficiency of the companies compared below:
| Ratios | Adobe Inc. (ADBE) | GoDaddy Inc. (GDDY) |
|---|---|---|
| ROE | 61.3% | 135.4% |
| ROIC | 36.7% | 16.0% |
| P/E | 19.1 | 29.8 |
| P/B | 11.7 | 40.3 |
| Current Ratio | 1.0 | 0.7 |
| Quick Ratio | 1.0 | 0.7 |
| D/E (Debt-to-Equity) | 0.57 | 5.63 |
| Debt-to-Assets | 22.5% | 47.3% |
| Interest Coverage | 33.1 | 5.6 |
| Asset Turnover | 0.81 | 0.56 |
| Fixed Asset Turnover | 10.9 | 22.2 |
| Payout ratio | 0% | 0% |
| Dividend yield | 0% | 0% |
| Fiscal Year | 2025 | 2024 |
Efficiency & Valuation Duel: The Vital Signs
Financial ratios act as a company’s DNA, exposing hidden risks and operational strengths behind headline figures.
Adobe Inc.
Adobe shows robust profitability with a 61.34% ROE and a strong 30% net margin, signaling operational excellence. Its P/E of 19.13 appears fairly valued amid a high ROIC of 36.69%, well above its 10.6% WACC. Adobe does not pay dividends, instead reinvesting heavily in R&D (18% of revenue), fueling growth.
GoDaddy Inc.
GoDaddy posts an exceptional 135.37% ROE but at a stretched P/E of 29.76 and a high P/B of 40.28, signaling expensive valuation. Its lower ROIC of 16.02% remains above the WACC of 7.37%, showing decent capital efficiency. GoDaddy also avoids dividends, focusing on growth investments and managing higher leverage (D/E 5.63).
Premium Valuation vs. Operational Safety
Adobe balances solid returns and reasonable valuation with prudent reinvestment, posing lower risk. GoDaddy demonstrates explosive ROE but suffers from stretched multiples and high debt, increasing risk. Investors seeking stable operational efficiency may prefer Adobe, while those tolerating valuation risk might consider GoDaddy’s growth profile.
Which one offers the Superior Shareholder Reward?
I compare Adobe Inc. and GoDaddy Inc. on distribution philosophy, dividend yields, payout ratios, and share buyback intensity. Neither pays dividends, focusing on reinvestment and buybacks. Adobe delivers FCF per share of $23.1B with zero dividend payout, signaling strong reinvestment and moderate buybacks. GoDaddy posts lower FCF per share at $8.9B, also zero dividends, but carries high debt and weaker cash flow coverage. Adobe’s sustainable FCF coverage and low leverage contrast with GoDaddy’s heavy debt burden and modest buybacks. I conclude Adobe offers a superior total return profile in 2026, balancing growth with prudent capital allocation.
Comparative Score Analysis: The Strategic Profile
The radar chart reveals the fundamental DNA and trade-offs of Adobe Inc. and GoDaddy Inc., highlighting their strategic strengths and vulnerabilities:
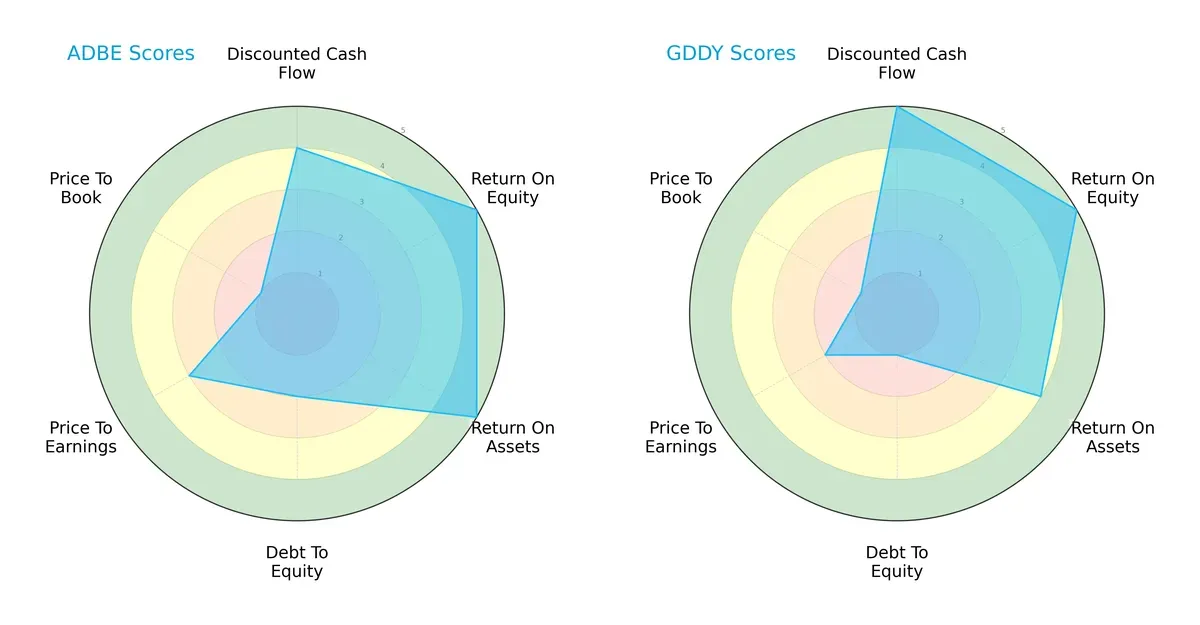
Adobe shows a balanced profile with strong ROE and ROA scores at 5 each, signaling efficient profit generation and asset use. GoDaddy leads in discounted cash flow with a perfect 5, reflecting robust future cash expectations, but suffers a weaker debt-to-equity score of 1, indicating higher financial risk. Adobe’s moderate debt-to-equity score of 2 provides more stability. Both companies share a very unfavorable price-to-book score of 1, suggesting market skepticism on book value. Overall, Adobe maintains a steadier, diversified financial stance, while GoDaddy relies more on cash flow strength.
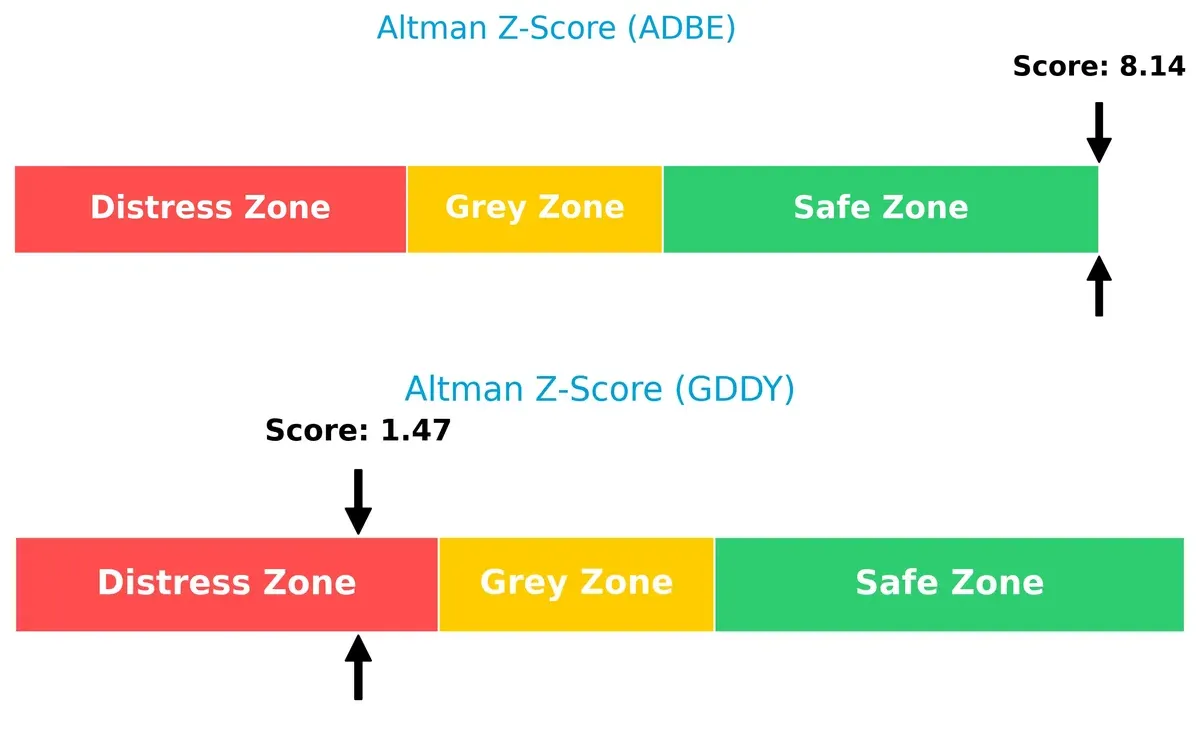
Bankruptcy Risk: Solvency Showdown
Adobe’s Altman Z-Score of 8.14 places it safely in the secure zone, while GoDaddy’s 1.47 signals distress. This stark gap implies Adobe’s superior long-term survival odds in the current economic cycle:
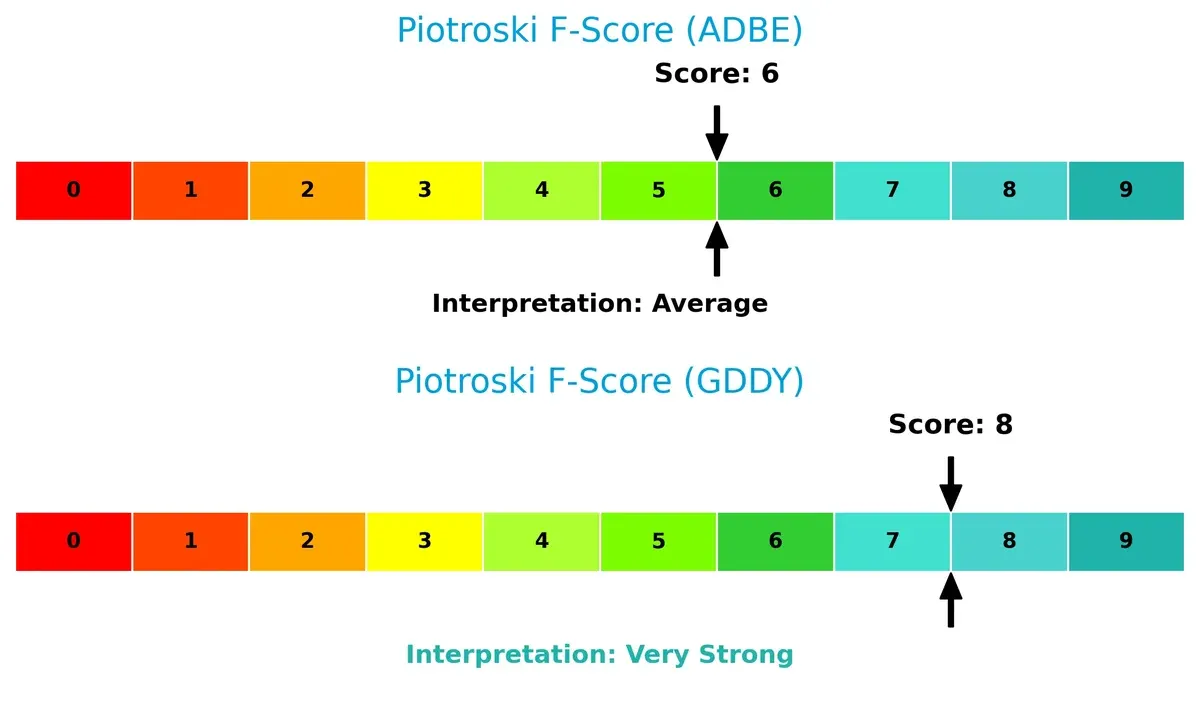
Financial Health: Quality of Operations
GoDaddy scores an impressive 8 on the Piotroski F-Score, indicating very strong financial health, whereas Adobe’s 6 suggests average robustness. GoDaddy shows fewer internal red flags, reflecting superior operational quality and value potential:
How are the two companies positioned?
This section dissects the operational DNA of Adobe and GoDaddy by comparing their revenue distribution and internal strengths and weaknesses. The goal is to confront their economic moats to determine which business model offers the most resilient, sustainable competitive advantage today.
Revenue Segmentation: The Strategic Mix
This visual comparison dissects how Adobe Inc. and GoDaddy Inc. diversify their income streams and where their primary sector bets lie:
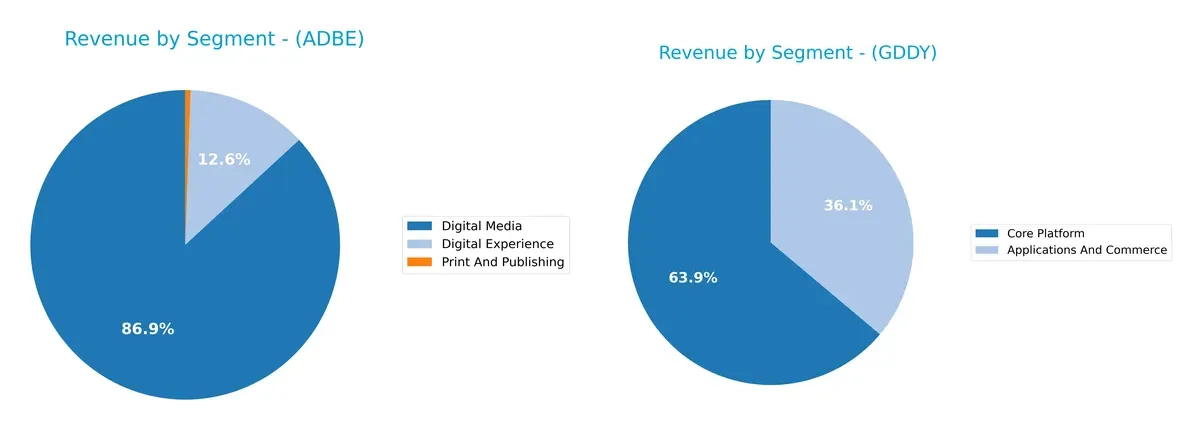
Adobe’s revenue pivots heavily on Digital Media, generating $40.4B in 2025, dwarfing its Digital Experience segment at $5.9B. This concentration anchors Adobe’s ecosystem lock-in through creative software dominance. GoDaddy presents a more balanced mix with Core Platform at $2.9B and Applications and Commerce at $1.7B, reflecting a diversified approach in web services. Adobe faces concentration risk, while GoDaddy leverages infrastructure breadth.
Strengths and Weaknesses Comparison
This table compares the Strengths and Weaknesses of Adobe Inc. and GoDaddy Inc.:
Adobe Inc. Strengths
- Strong profitability with 30% net margin
- High ROE at 61.34%
- Favorable ROIC of 36.69%
- Low debt-to-assets ratio at 22.54%
- Robust interest coverage ratio of 33.96
- Significant global revenue from Americas and EMEA
GoDaddy Inc. Strengths
- Exceptional ROE at 135.37%
- Favorable WACC at 7.37%
- Solid net margin of 20.49%
- Favorable interest coverage ratio of 5.84
- High fixed asset turnover at 22.22
- Growing Core Platform and Applications revenue segments
Adobe Inc. Weaknesses
- Unfavorable WACC at 10.6%
- High PB ratio of 11.73
- Weak current ratio at 1.0 indicating tight liquidity
- No dividend yield
- Moderate debt-to-equity ratio of 0.57
GoDaddy Inc. Weaknesses
- Low current and quick ratios at 0.72 indicating liquidity risk
- High debt-to-equity ratio of 5.63
- Unfavorable PE at 29.76
- Very high PB ratio of 40.28
- No dividend yield
Adobe shows strong profitability and financial health but faces liquidity and valuation concerns. GoDaddy boasts impressive returns and asset efficiency but carries higher debt and liquidity risks. These factors shape each company’s financial flexibility and strategic options.
The Moat Duel: Analyzing Competitive Defensibility
A structural moat shields long-term profits from relentless competitive pressures. Only durable moats ensure sustainable economic value creation:
Adobe Inc.: Subscription and Ecosystem Lock-in Moat
Adobe’s competitive edge lies in its subscription-based Creative Cloud ecosystem. This drives stable high margins (37.6% EBIT) and an ROIC far above WACC (+26%). New AI-powered creative tools in 2026 could further deepen this advantage.
GoDaddy Inc.: Scale and Customer Acquisition Moat
GoDaddy leverages scale in domain registration and hosting, with growing ROIC (+8.7% above WACC) and aggressive marketing. Unlike Adobe, its moat depends more on customer volume than ecosystem lock-in. Expansion into e-commerce services offers growth potential.
Creative Cloud Lock-in vs. Scale-Driven Customer Reach
Adobe’s subscription ecosystem builds a deeper moat than GoDaddy’s scale and marketing reach. Adobe’s superior ROIC and margin stability better defend market share against new entrants.
Which stock offers better returns?
The past year saw both Adobe Inc. and GoDaddy Inc. experience bearish price trends with notable declines and decelerating momentum in their stock prices. Trading volumes increased overall, reflecting active market participation.
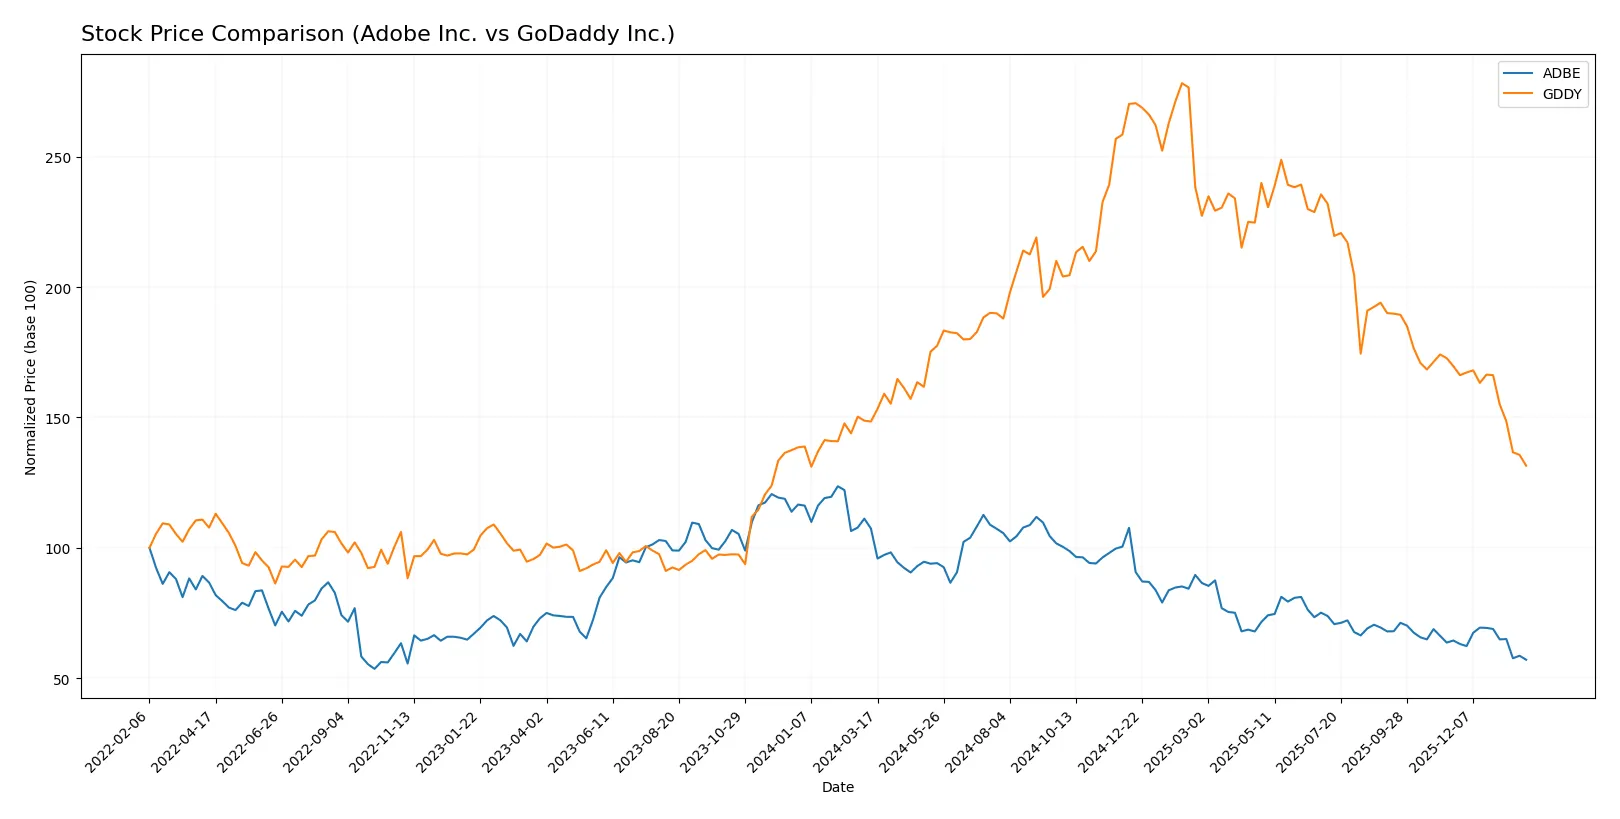
Trend Comparison
Adobe Inc. shows a bearish trend over the past 12 months with a -46.85% price change and decelerating decline. The stock hit a high of 578.34 and a low of 293.25, indicating significant volatility.
GoDaddy Inc. also displays a bearish trend with an -11.41% price drop and deceleration. Its trading range spans 100.52 to 212.65, with lower volatility than Adobe but recent sharper declines.
Adobe’s stock fell more sharply than GoDaddy’s, delivering the weakest market performance. GoDaddy’s smaller loss suggests relatively better resilience despite both trends being negative.
Target Prices
Analysts show a bullish consensus for Adobe Inc. and GoDaddy Inc., with target prices well above current market levels.
| Company | Target Low | Target High | Consensus |
|---|---|---|---|
| Adobe Inc. | 280 | 500 | 390.31 |
| GoDaddy Inc. | 70 | 182 | 143.33 |
Adobe’s target consensus at 390 significantly exceeds its current price of 293, implying strong growth expectations. GoDaddy’s target consensus at 143 also suggests substantial upside from the current 101 price.

Don’t Let Luck Decide Your Entry Point
Optimize your entry points with our advanced ProRealTime indicators. You’ll get efficient buy signals with precise price targets for maximum performance. Start outperforming now!
How do institutions grade them?
Adobe Inc. Grades
The following table summarizes recent institutional grades for Adobe Inc.:
| Grading Company | Action | New Grade | Date |
|---|---|---|---|
| UBS | Maintain | Neutral | 2026-01-26 |
| Oppenheimer | Downgrade | Perform | 2026-01-13 |
| BMO Capital | Downgrade | Market Perform | 2026-01-09 |
| Jefferies | Downgrade | Hold | 2026-01-05 |
| Citigroup | Maintain | Neutral | 2025-12-17 |
| BMO Capital | Maintain | Outperform | 2025-12-15 |
| Keybanc | Downgrade | Underweight | 2025-12-15 |
| Wolfe Research | Maintain | Outperform | 2025-12-11 |
| TD Cowen | Maintain | Hold | 2025-12-11 |
| Oppenheimer | Maintain | Outperform | 2025-12-11 |
GoDaddy Inc. Grades
Recent institutional grades for GoDaddy Inc. are shown in the table below:
| Grading Company | Action | New Grade | Date |
|---|---|---|---|
| Morgan Stanley | Maintain | Equal Weight | 2026-01-15 |
| Cantor Fitzgerald | Maintain | Neutral | 2026-01-08 |
| Jefferies | Maintain | Hold | 2026-01-05 |
| Evercore ISI Group | Maintain | In Line | 2025-10-31 |
| Benchmark | Maintain | Buy | 2025-10-31 |
| JP Morgan | Maintain | Overweight | 2025-10-31 |
| B. Riley Securities | Maintain | Buy | 2025-10-31 |
| UBS | Maintain | Neutral | 2025-10-31 |
| Citigroup | Maintain | Buy | 2025-10-31 |
| Wells Fargo | Maintain | Equal Weight | 2025-10-06 |
Which company has the best grades?
GoDaddy maintains consistently positive grades, including multiple “Buy” and “Overweight” ratings. Adobe’s grades have recently been downgraded toward “Hold” and “Neutral.” These trends may influence investor sentiment and valuation expectations differently for each company.
Risks specific to each company
The following categories identify critical pressure points and systemic threats facing Adobe Inc. and GoDaddy Inc. in the 2026 market environment:
1. Market & Competition
Adobe Inc.
- Dominates creative and digital experience software with strong brand moat. Faces intense competition from cloud and AI innovators.
GoDaddy Inc.
- Competes in domain registration and web hosting with many low-cost rivals. Growth depends on small business adoption and innovation.
2. Capital Structure & Debt
Adobe Inc.
- Moderate debt-to-equity (0.57), manageable interest coverage (33.96x). Capital structure supports growth without excessive risk.
GoDaddy Inc.
- High leverage (debt-to-equity 5.63) signals financial risk. Interest coverage (5.84x) adequate but more vulnerable to shocks.
3. Stock Volatility
Adobe Inc.
- Beta 1.53 indicates above-market volatility, reflecting tech sector cyclicality and innovation dependency.
GoDaddy Inc.
- Beta 0.95 suggests lower volatility, potentially more stable but less growth-driven.
4. Regulatory & Legal
Adobe Inc.
- Subject to global data privacy laws and IP regulations. Large scale spreads regulatory risk but also compliance costs.
GoDaddy Inc.
- Faces regulatory scrutiny over domain management and cybersecurity. Smaller scale may limit regulatory impact but also resilience.
5. Supply Chain & Operations
Adobe Inc.
- Operates a cloud-based delivery model reducing supply chain risks but reliant on data center uptime.
GoDaddy Inc.
- Also cloud-based; operational risks include server outages and cybersecurity threats affecting customer trust.
6. ESG & Climate Transition
Adobe Inc.
- Strong sustainability initiatives support brand and compliance with investor expectations. Risks arise from energy-intensive data centers.
GoDaddy Inc.
- ESG efforts emerging; must enhance transparency and energy efficiency to meet rising stakeholder demands.
7. Geopolitical Exposure
Adobe Inc.
- Global footprint exposes it to trade tensions and international data laws, but diversification mitigates impact.
GoDaddy Inc.
- Primarily US-focused, limiting geopolitical risk but also growth opportunities abroad.
Which company shows a better risk-adjusted profile?
Adobe’s key risk is its elevated stock volatility despite a solid capital structure and robust financial health. GoDaddy’s most impactful risk lies in its high leverage, exposing it to financial distress, as its Altman Z-score confirms. Adobe’s safe-zone bankruptcy score and moderate debt stance give it a better risk-adjusted profile. GoDaddy’s distress-zone Z-score and weaker liquidity signal higher vulnerability despite strong operational metrics. I remain cautious on GoDaddy’s capital structure, which demands close monitoring amid market uncertainties.
Final Verdict: Which stock to choose?
Adobe Inc. showcases a superpower in delivering robust profitability and value creation, backed by a durable competitive moat and steadily growing ROIC. Its point of vigilance lies in a stretched balance sheet liquidity, which could challenge short-term flexibility. Adobe fits well within aggressive growth portfolios seeking sustainable tech leadership.
GoDaddy Inc. commands a strategic moat through strong returns on equity and an improving capital efficiency trend, supported by a resilient recurring revenue model. Relative to Adobe, it presents higher financial leverage and liquidity risk, implying a more volatile safety profile. GoDaddy suits Growth at a Reasonable Price (GARP) investors who tolerate moderate risk for potential upside.
If you prioritize consistent value creation and operational excellence, Adobe is the compelling choice due to its proven ability to generate excess returns and maintain a wide moat. However, if you seek a higher-risk, potentially higher-reward scenario with improving profitability metrics, GoDaddy offers better growth stability in a more leveraged setting. Both require careful risk management given recent bearish price trends.
Disclaimer: Investment carries a risk of loss of initial capital. The past performance is not a reliable indicator of future results. Be sure to understand risks before making an investment decision.
Go Further
I encourage you to read the complete analyses of Adobe Inc. and GoDaddy Inc. to enhance your investment decisions: