Home > Comparison > Technology > ADBE vs FTNT
The strategic rivalry between Adobe Inc. and Fortinet, Inc. shapes the evolving landscape of the technology sector. Adobe operates as a diversified software powerhouse focused on creative and digital experience solutions. In contrast, Fortinet leads with integrated cybersecurity hardware and software offerings. This head-to-head pits creative innovation against security infrastructure. This analysis aims to identify which business model delivers superior risk-adjusted returns for a balanced portfolio in 2026.
Table of contents
Companies Overview
Adobe Inc. and Fortinet, Inc. dominate distinct niches within the software infrastructure market, shaping digital creativity and cybersecurity.
Adobe Inc.: Premier Creative and Digital Experience Platform
Adobe leads as a diversified software company specializing in creative and marketing tools. Its core revenue stems from subscription services like Creative Cloud, serving content creators and marketers globally. In 2026, Adobe focuses on expanding its Digital Experience segment to optimize customer analytics and commerce for enterprise clients.
Fortinet, Inc.: Integrated Cybersecurity Solutions Provider
Fortinet commands a strong presence in cybersecurity infrastructure, offering broad, automated protection via hardware and software licenses. Its revenue primarily derives from FortiGate products and security subscriptions. The company’s 2026 strategy emphasizes enhancing endpoint and network security solutions across diverse industries worldwide.
Strategic Collision: Similarities & Divergences
Both excel in software infrastructure, but Adobe prioritizes creative ecosystems, while Fortinet builds a fortified, integrated security platform. Their battlefront lies in enterprise digital transformation—content creation versus cybersecurity. Adobe appeals to innovation-driven growth; Fortinet targets risk-averse security demands, defining contrasting investment profiles.
Income Statement Comparison
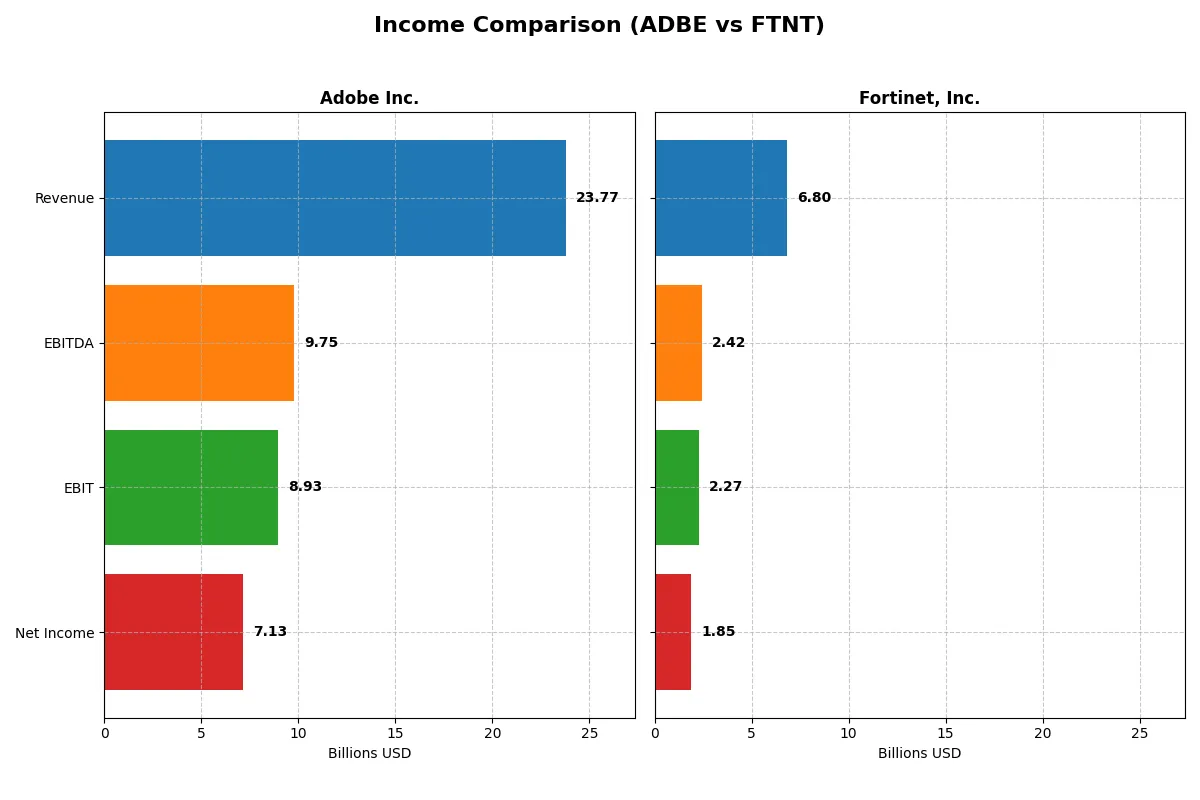
This table dissects the core profitability and scalability of both corporate engines to reveal who dominates the bottom line:
| Metric | Adobe Inc. (ADBE) | Fortinet, Inc. (FTNT) |
|---|---|---|
| Revenue | 23.8B | 6.8B |
| Cost of Revenue | 2.7B | 1.3B |
| Operating Expenses | 12.4B | 3.4B |
| Gross Profit | 21.1B | 5.5B |
| EBITDA | 9.7B | 2.4B |
| EBIT | 8.9B | 2.3B |
| Interest Expense | 0.3B | 0.02B |
| Net Income | 7.1B | 1.9B |
| EPS | 16.73 | 2.44 |
| Fiscal Year | 2025 | 2025 |
Income Statement Analysis: The Bottom-Line Duel
This income statement comparison reveals the true operating efficiency and profitability trends powering each company’s growth engine through fiscal 2025.
Adobe Inc. Analysis
Adobe’s revenue jumped 10.5% in 2025 to $23.8B, fueling a 28% net income rise to $7.13B. Its gross margin stays robust at 88.6%, reflecting strong pricing power and cost control. Adobe’s net margin of 30% and EBIT margin near 38% show elite profitability and efficient expense management, signaling healthy momentum.
Fortinet, Inc. Analysis
Fortinet’s revenue surged 14.2% to $6.8B in 2025, with net income growing 6.2% to $1.85B. Gross margin at 80.8% and EBIT margin at 33.4% demonstrate solid operational efficiency. However, net margin slightly declined to 27.3%, pointing to pressure on bottom-line growth despite impressive revenue and EPS gains.
Margin Power vs. Revenue Scale
Adobe delivers superior margins and higher absolute profits, leveraging scale with a 30% net margin versus Fortinet’s 27%. Fortinet’s revenue and net income have grown faster over the long term, but Adobe remains the fundamental winner in pure profitability and margin stability. Investors seeking a high-margin software leader will find Adobe’s profile more attractive.
Financial Ratios Comparison
These vital ratios act as a diagnostic tool to expose the underlying fiscal health, valuation premiums, and capital efficiency of each company:
| Ratios | Adobe Inc. (ADBE) | Fortinet, Inc. (FTNT) |
|---|---|---|
| ROE | 61.3% | 149.8% |
| ROIC | 36.7% | 28.8% |
| P/E | 19.1 | 32.5 |
| P/B | 11.7 | 48.6 |
| Current Ratio | 1.00 | 1.17 |
| Quick Ratio | 1.00 | 1.09 |
| D/E (Debt-to-Equity) | 0.57 | 0.81 |
| Debt-to-Assets | 22.5% | 9.6% |
| Interest Coverage | 33.1 | 103.7 |
| Asset Turnover | 0.81 | 0.65 |
| Fixed Asset Turnover | 10.9 | 4.20 |
| Payout ratio | 0 | 0 |
| Dividend yield | 0 | 0 |
| Fiscal Year | 2025 | 2025 |
Efficiency & Valuation Duel: The Vital Signs
Financial ratios act as a company’s DNA, unveiling hidden risks and operational efficiency essential for investment insight.
Adobe Inc.
Adobe posts a robust 61.3% ROE and a strong 30% net margin, demonstrating exceptional profitability. Its valuation at a 19.1 P/E is moderate, neither cheap nor stretched. Adobe invests heavily in R&D (18% of revenue), foregoing dividends to fuel long-term growth, reflecting a focus on innovation and shareholder value enhancement.
Fortinet, Inc.
Fortinet delivers an outstanding 149.8% ROE with a solid 27.3% net margin, highlighting operational efficiency. However, its 32.5 P/E and 48.6 P/B indicate a stretched valuation. Like Adobe, Fortinet pays no dividend but allocates significant resources to R&D (12% of revenue), driving growth and competitive positioning in cybersecurity.
Premium Growth vs. Balanced Profitability
Fortinet’s high ROE and aggressive valuation suggest premium growth expectations, while Adobe balances strong profitability with more reasonable valuation multiples. Adobe offers steadier operational metrics; Fortinet appeals to growth-focused investors willing to pay a premium. The choice depends on an investor’s appetite for growth versus valuation discipline.
Which one offers the Superior Shareholder Reward?
Adobe Inc. and Fortinet, Inc. both forego dividends, focusing on share buybacks and reinvestment. Adobe’s free cash flow per share stands at $23.1B in 2025, with a strong buyback capacity supported by a near 1 current ratio and low debt-to-equity at 0.57. Fortinet, with a free cash flow per share of $2.9B, shows higher financial leverage (8.4) and a more aggressive buyback posture, but weaker liquidity. Adobe’s sustainable capital allocation and robust margin profile (30% net margin) outpace Fortinet’s 27%, indicating Adobe offers a more durable total shareholder return in 2026.
Comparative Score Analysis: The Strategic Profile
The radar chart reveals the fundamental DNA and trade-offs of Adobe Inc. and Fortinet, Inc., highlighting their financial strengths and valuation challenges:
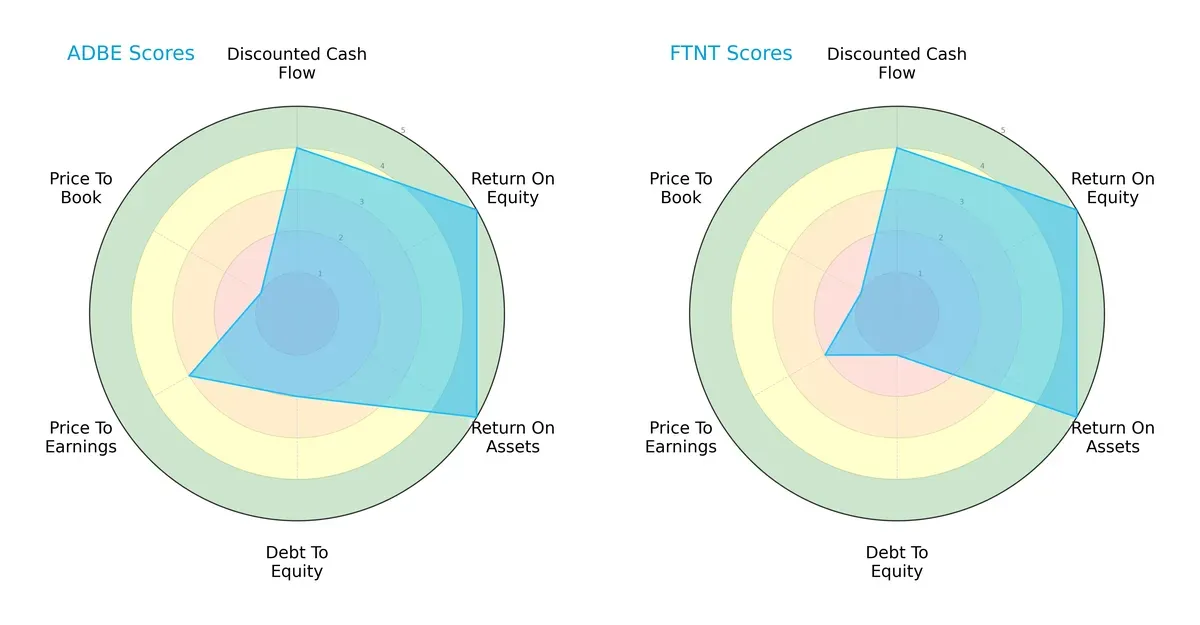
Adobe shows a more balanced profile with strong ROE and ROA scores (5 each) and favorable DCF (4). However, its debt-to-equity score (2) signals higher leverage risk. Fortinet matches Adobe’s operational efficiency but fares worse on debt-to-equity (1) and valuation metrics (P/E 2 vs. Adobe’s 3). Adobe leans on solid profitability, while Fortinet’s edge is a slightly lower DCF but riskier capital structure.
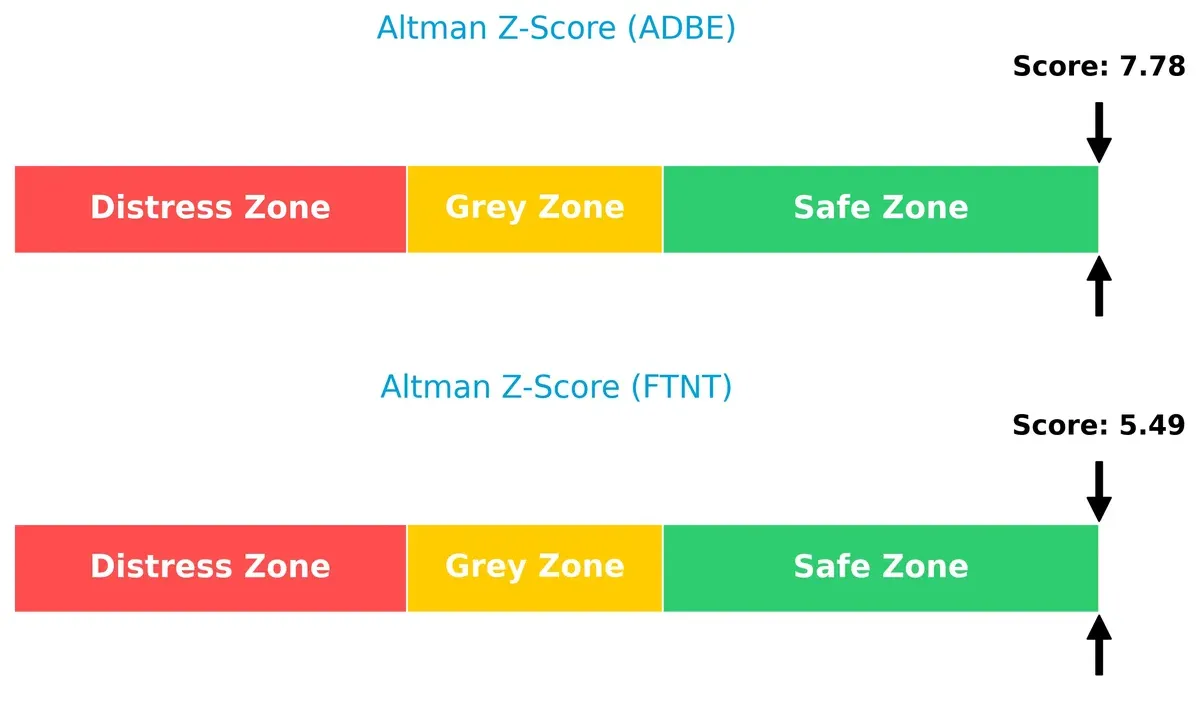
Bankruptcy Risk: Solvency Showdown
Adobe’s Altman Z-Score of 7.78 outperforms Fortinet’s 5.49, indicating superior financial stability and lower bankruptcy risk in this cycle:
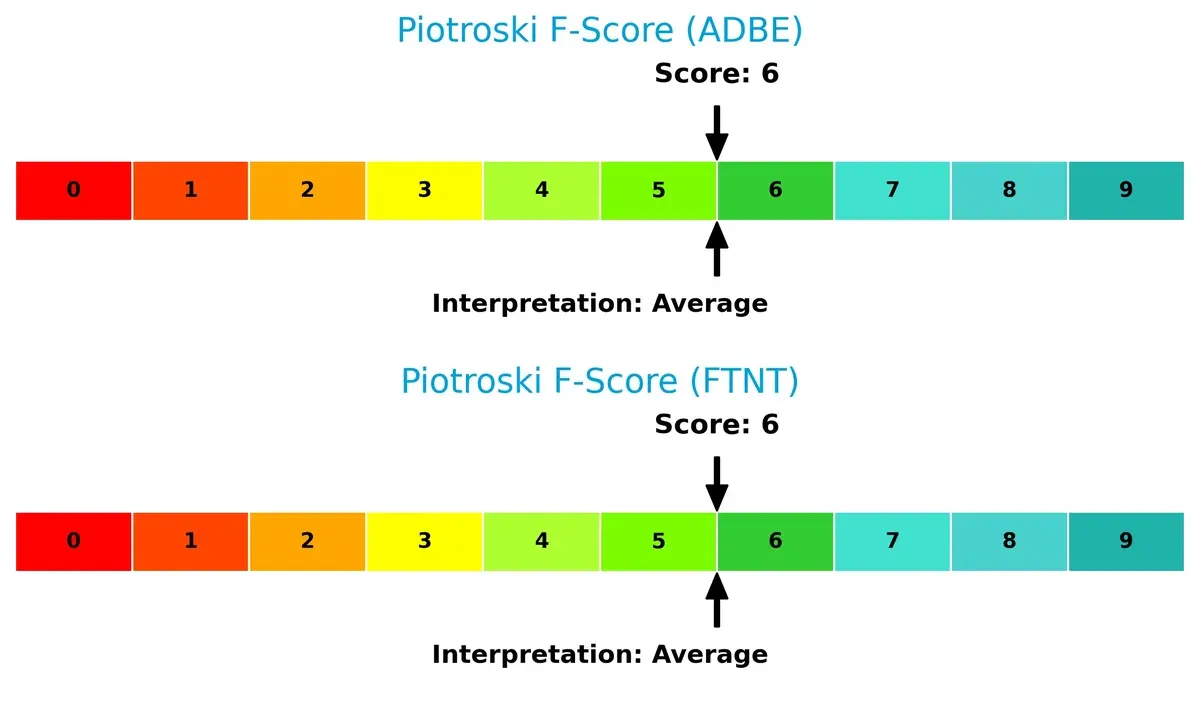
Financial Health: Quality of Operations
Both Adobe and Fortinet score 6 on the Piotroski F-Score, suggesting average financial health with no glaring red flags in internal metrics:
How are the two companies positioned?
This section dissects Adobe and Fortinet’s operational DNA by comparing their revenue distribution and internal strengths and weaknesses. The goal is to confront their economic moats to identify which business model offers the most resilient competitive advantage today.
Revenue Segmentation: The Strategic Mix
The following comparison dissects how Adobe Inc. and Fortinet, Inc. diversify their income streams and where their primary sector bets lie:
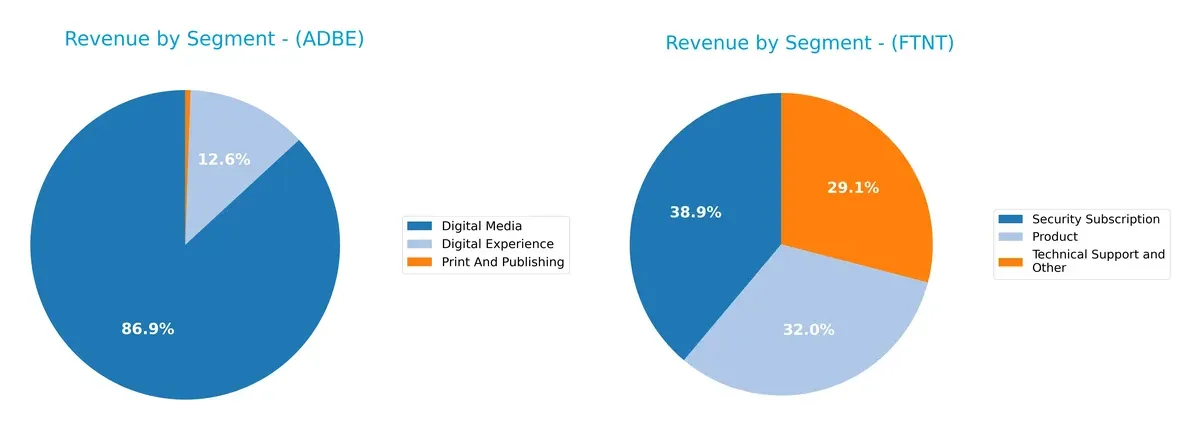
Adobe Inc. leans heavily on Digital Media, which dwarfs its other segments at $40.4B in 2025, anchoring its revenue. Digital Experience contributes $5.9B, showing moderate diversification. Fortinet presents a more balanced mix, with Security Subscription at $2.3B, Product at $1.9B, and Technical Support at $1.7B. Adobe’s reliance on a dominant segment risks concentration, while Fortinet’s spread supports ecosystem lock-in and steady growth.
Strengths and Weaknesses Comparison
This table compares the strengths and weaknesses of Adobe Inc. and Fortinet, Inc.:
Adobe Inc. Strengths
- Strong profitability with 30% net margin and 61.34% ROE
- Favorable asset turnover and fixed asset turnover
- Diverse product segments including Digital Experience and Media
- Solid global presence with significant Americas and EMEA revenues
Fortinet, Inc. Strengths
- Exceptional ROE at 149.77% and solid net margin of 27.26%
- Favorable debt management and high interest coverage
- Balanced revenue streams from Product, Security Subscription, and Support
- Robust global reach across Americas, Asia Pacific, and EMEA
Adobe Inc. Weaknesses
- Unfavorable WACC and high PB ratio indicate costly capital and valuation concerns
- Marginal current ratio of 1.0 signals liquidity risks
- No dividend yield limits income appeal
Fortinet, Inc. Weaknesses
- High PE and PB ratios suggest expensive valuation
- Slightly weaker asset turnover compared to Adobe
- No dividend yield restricts shareholder return options
Adobe’s strengths lie in profitability and diversified digital products, but liquidity and valuation metrics caution prudence. Fortinet excels in return metrics and balanced global revenue but faces valuation and turnover concerns. These contrasts highlight differing strategic priorities and financial profiles.
The Moat Duel: Analyzing Competitive Defensibility
A structural moat protects long-term profits from relentless competitive erosion. Without it, market share and pricing power quickly vanish:
Adobe Inc.: Intangible Assets Fueled by Brand and Innovation
Adobe’s moat arises from its dominant Creative Cloud ecosystem and brand loyalty. This delivers stable 37.6% EBIT margins and a 26% ROIC premium over WACC. Expansion into AI-driven content tools in 2026 could deepen this moat.
Fortinet, Inc.: Cost Advantage through Integrated Cybersecurity
Fortinet’s competitive edge lies in cost-efficient, broad cybersecurity solutions that scale across industries. It sustains a strong 33.4% EBIT margin with a 20% ROIC premium over WACC. Growth in cloud security and AI-based threat detection offers new expansion avenues.
Moat Strength Battle: Intangible Assets vs. Cost Leadership
Adobe’s deeper moat stems from its intangible assets and subscription lock-in, generating superior profitability and pricing power. Fortinet’s cost advantage is robust but narrower. Adobe appears better equipped to defend and extend its market dominance.
Which stock offers better returns?
Over the past 12 months, Adobe Inc. experienced a pronounced price decline, while Fortinet, Inc. showed steady gains, reflecting contrasting market dynamics and investor sentiment.
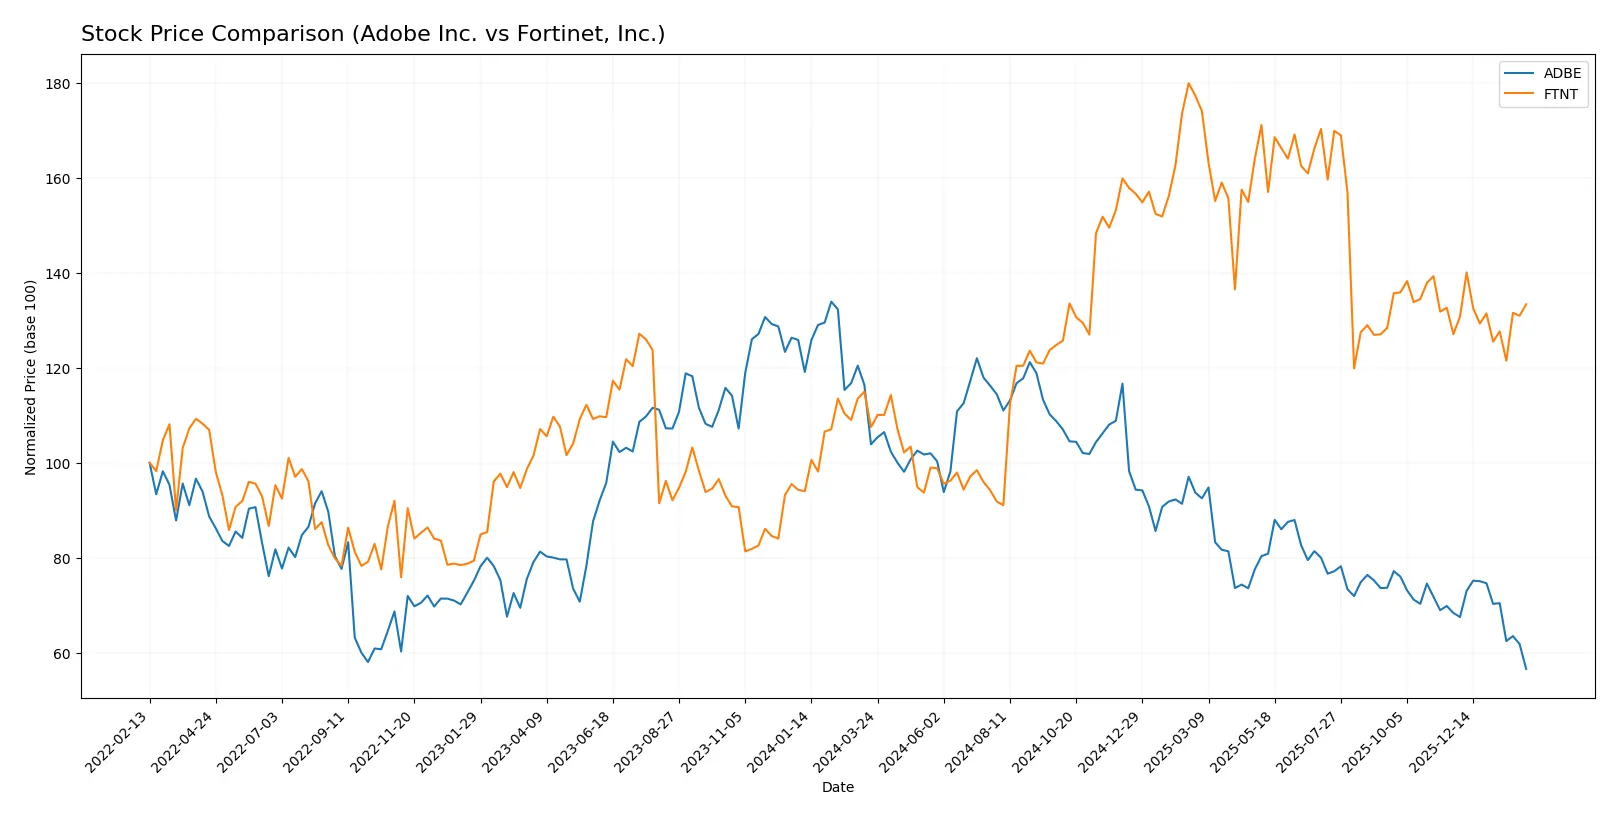
Trend Comparison
Adobe’s stock dropped 45.5% over the last year, marking a bearish trend with decelerating declines and high volatility. The price fell from a 578.34 peak to a low near 268.38.
Fortinet’s shares rose 24.04% in the same period, signaling a bullish trend despite deceleration. Its price moved between 56.51 and 111.64, showing moderate volatility.
Fortinet outperformed Adobe by a wide margin, delivering the highest market returns over the analyzed 12-month span.
Target Prices
Analysts present a moderately bullish consensus for both Adobe Inc. and Fortinet, Inc.
| Company | Target Low | Target High | Consensus |
|---|---|---|---|
| Adobe Inc. | 280 | 500 | 386.76 |
| Fortinet, Inc. | 70 | 90 | 85 |
Adobe’s target consensus at 387 implies a 44% upside from the current 268. Fortinet’s consensus at 85 suggests modest upside from 83, reflecting cautious optimism.

Don’t Let Luck Decide Your Entry Point
Optimize your entry points with our advanced ProRealTime indicators. You’ll get efficient buy signals with precise price targets for maximum performance. Start outperforming now!
How do institutions grade them?
The following tables summarize recent institutional grades for Adobe Inc. and Fortinet, Inc.:
Adobe Inc. Grades
Here are the latest grades assigned to Adobe Inc. by reputable firms.
| Grading Company | Action | New Grade | Date |
|---|---|---|---|
| Piper Sandler | Downgrade | Neutral | 2026-02-03 |
| UBS | Maintain | Neutral | 2026-01-26 |
| Oppenheimer | Downgrade | Perform | 2026-01-13 |
| BMO Capital | Downgrade | Market Perform | 2026-01-09 |
| Jefferies | Downgrade | Hold | 2026-01-05 |
| Citigroup | Maintain | Neutral | 2025-12-17 |
| Keybanc | Downgrade | Underweight | 2025-12-15 |
| BMO Capital | Maintain | Outperform | 2025-12-15 |
| Wolfe Research | Maintain | Outperform | 2025-12-11 |
| Jefferies | Maintain | Buy | 2025-12-11 |
Fortinet, Inc. Grades
Below are the recent institutional ratings for Fortinet, Inc. from verified sources.
| Grading Company | Action | New Grade | Date |
|---|---|---|---|
| RBC Capital | Maintain | Sector Perform | 2026-02-06 |
| JP Morgan | Maintain | Underweight | 2026-02-06 |
| Rosenblatt | Maintain | Buy | 2026-02-06 |
| Wedbush | Maintain | Outperform | 2026-02-06 |
| Mizuho | Maintain | Underperform | 2026-02-06 |
| Scotiabank | Downgrade | Sector Perform | 2026-02-02 |
| JP Morgan | Maintain | Underweight | 2026-01-30 |
| Rosenblatt | Upgrade | Buy | 2026-01-29 |
| TD Cowen | Upgrade | Buy | 2026-01-23 |
| Citigroup | Maintain | Neutral | 2026-01-13 |
Which company has the best grades?
Fortinet shows a stronger consensus with multiple buy and outperform ratings. Adobe has several downgrades and more neutral to hold grades. Fortinet’s ratings could suggest higher investor confidence.
Risks specific to each company
The following categories identify critical pressure points and systemic threats facing Adobe Inc. and Fortinet, Inc. in the 2026 market environment:
1. Market & Competition
Adobe Inc.
- Faces intense competition in diversified software and digital experience sectors, with innovation pace pressure.
Fortinet, Inc.
- Competes aggressively in cybersecurity hardware and software, with rapid technological shifts demanding constant upgrades.
2. Capital Structure & Debt
Adobe Inc.
- Moderate debt-to-equity ratio at 0.57, manageable but less conservative, raising mild financial leverage concerns.
Fortinet, Inc.
- Higher debt-to-equity ratio at 0.81, indicating more leverage and increased financial risk relative to Adobe.
3. Stock Volatility
Adobe Inc.
- Beta of 1.515 suggests higher volatility than the market, implying greater price swings.
Fortinet, Inc.
- Beta of 1.047 indicates volatility close to market average, offering relatively steadier price movements.
4. Regulatory & Legal
Adobe Inc.
- Subject to global data privacy and software compliance regulations, with risks of costly legal actions.
Fortinet, Inc.
- Faces stringent cybersecurity and data protection regulations, with significant exposure to compliance risks.
5. Supply Chain & Operations
Adobe Inc.
- Heavy reliance on cloud infrastructure and global distribution networks exposes it to operational disruptions.
Fortinet, Inc.
- Hardware-dependent supply chains face semiconductor shortages and logistics challenges affecting product delivery.
6. ESG & Climate Transition
Adobe Inc.
- Increasing pressure to meet sustainability targets in digital operations and reduce environmental footprint.
Fortinet, Inc.
- Must address energy consumption of hardware products and align with evolving ESG standards in tech manufacturing.
7. Geopolitical Exposure
Adobe Inc.
- Global operations subject to trade tensions and export controls, especially in Asia-Pacific markets.
Fortinet, Inc.
- Geopolitical risks heightened by cybersecurity export regulations and potential government contract dependencies.
Which company shows a better risk-adjusted profile?
Adobe’s primary risk lies in market competition and elevated stock volatility, driven by its broad software exposure and beta above 1.5. Fortinet’s dominant risk is higher leverage combined with supply chain vulnerabilities in hardware. Despite Fortinet’s better debt-to-assets ratio and stable Beta, its high debt-to-equity score and elevated P/E ratio signal valuation risk. Adobe shows a slightly better risk-adjusted profile due to stronger profitability metrics and lower financial risk, though its stock volatility warrants caution. The 2025 debt-to-equity scores reveal Fortinet’s balance sheet risk as a key concern amid market uncertainties.
Final Verdict: Which stock to choose?
Adobe Inc. wields unmatched operational efficiency, generating robust returns well above its cost of capital. Its superpower lies in scaling high-margin software services with durable pricing power. A point of vigilance is its stretched valuation multiples and near-par liquidity, which could pressure resilience in downturns. Adobe suits aggressive growth portfolios ready to tolerate premium pricing for quality.
Fortinet, Inc. stands on a strategic moat of cybersecurity dominance with sticky, recurring revenue streams. It offers a safer profile through conservative leverage and strong free cash flow conversion, though its elevated P/E and price-to-book ratios suggest stretched expectations. Fortinet fits well in Growth at a Reasonable Price (GARP) portfolios seeking both innovation and relative stability.
If you prioritize aggressive growth and can stomach valuation risk, Adobe outshines through superior capital efficiency and market leadership. However, if you seek a blend of growth with enhanced financial stability and recurring revenues, Fortinet offers better risk-adjusted potential. Both companies demonstrate sustainable moats, but investor preference hinges on tolerance for premium multiples and desired exposure to enterprise software versus cybersecurity.
Disclaimer: Investment carries a risk of loss of initial capital. The past performance is not a reliable indicator of future results. Be sure to understand risks before making an investment decision.
Go Further
I encourage you to read the complete analyses of Adobe Inc. and Fortinet, Inc. to enhance your investment decisions: