Home > Comparison > Technology > ADBE vs FIG
The strategic rivalry between Adobe Inc. and Figma, Inc. shapes the future of the technology sector. Adobe, a capital-intensive software infrastructure titan, contrasts with Figma’s agile, high-growth application software model. This head-to-head reflects a battle between established scale and innovative disruption in digital design tools. This analysis aims to identify which company offers a superior risk-adjusted return, guiding investors seeking resilient exposure to evolving software markets.
Table of contents
Companies Overview
Adobe Inc. and Figma, Inc. shape the future of digital creativity and collaboration tools in a competitive tech landscape.
Adobe Inc.: The Creative Cloud Powerhouse
Adobe dominates the software infrastructure market with its Creative Cloud subscription, fueling revenue through digital media, experience, and publishing segments. Its 2026 strategy sharpens focus on integrated cloud-based solutions, targeting enterprises and creative professionals. This approach leverages Adobe’s broad product suite to deepen user engagement and expand cross-segment synergies.
Figma, Inc.: Collaborative Design Innovator
Figma specializes in browser-based design tools that streamline UI/UX workflows and team collaboration. Its core revenue derives from subscription access to products like Figma Design and AI-enhanced prototyping tools. In 2026, Figma prioritizes enhancing real-time collaboration and AI integration to accelerate product development cycles and capture a growing market of design teams.
Strategic Collision: Similarities & Divergences
Adobe and Figma both focus on empowering creative professionals but diverge on platform philosophy: Adobe offers a comprehensive closed ecosystem, while Figma champions open, browser-based collaboration. Their primary battleground is enterprise adoption of design and content creation tools. Adobe’s scale contrasts with Figma’s innovation agility, defining distinct investment profiles in software infrastructure versus application niches.
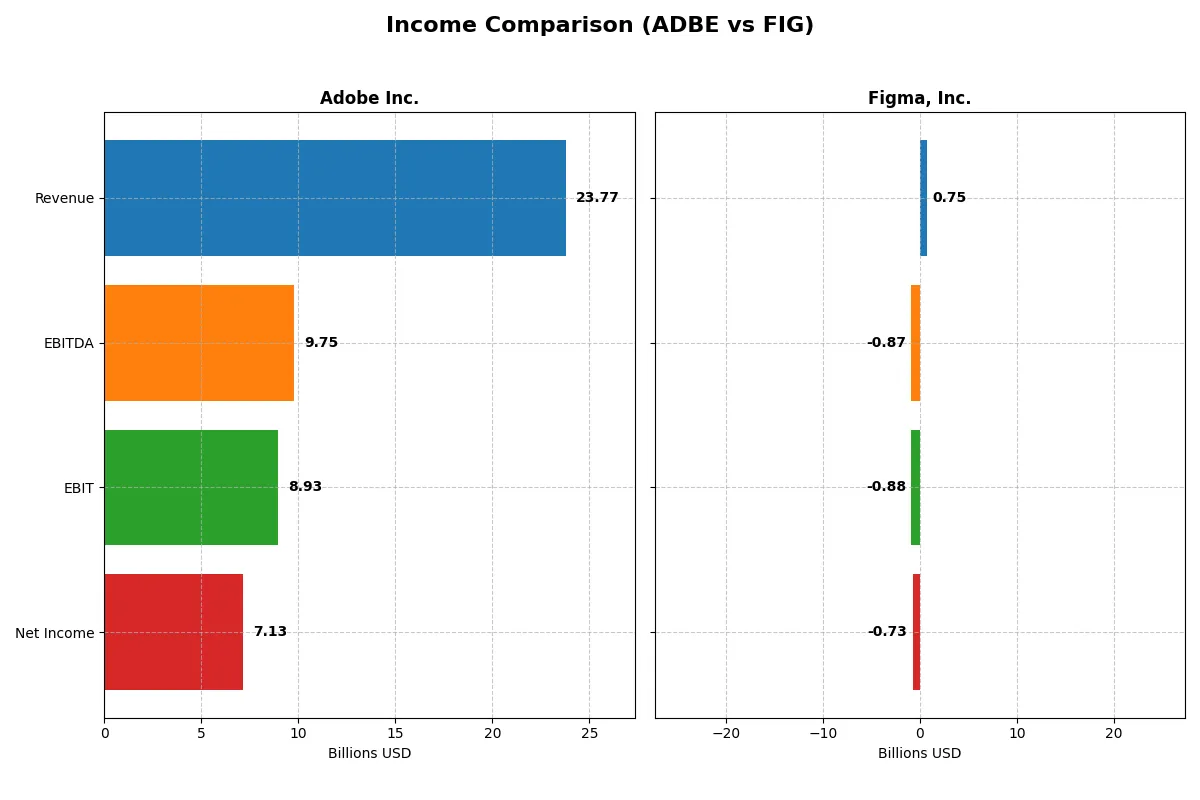
Income Statement Comparison
This data dissects the core profitability and scalability of both corporate engines to reveal who dominates the bottom line:
| Metric | Adobe Inc. (ADBE) | Figma, Inc. (FIG) |
|---|---|---|
| Revenue | 23.8B | 749M |
| Cost of Revenue | 2.71B | 88M |
| Operating Expenses | 12.4B | 1.54B |
| Gross Profit | 21.1B | 661M |
| EBITDA | 9.75B | -870M |
| EBIT | 8.93B | -877M |
| Interest Expense | 263M | 0 |
| Net Income | 7.13B | -732M |
| EPS | 16.73 | -3.11 |
| Fiscal Year | 2025 | 2024 |
Income Statement Analysis: The Bottom-Line Duel
This income statement comparison reveals the true efficiency and profitability of two distinct corporate engines over recent years.
Adobe Inc. Analysis
Adobe Inc. exhibits strong revenue growth from $15.8B in 2021 to $23.8B in 2025. Net income surged from $4.8B to $7.1B, reflecting robust earnings expansion. Margins remain healthy, with a gross margin above 88% and a net margin around 30%. The 2025 fiscal year shows accelerated momentum, with EBITDA and net income rising significantly, indicating efficient cost management and solid operational leverage.
Figma, Inc. Analysis
Figma’s revenue jumped 48% from $505M in 2023 to $749M in 2024, signaling rapid top-line expansion. However, net income swung from a positive $286M in 2023 to a negative $732M in 2024, driven by high operating expenses. The gross margin stays strong near 88%, but the net margin collapses to -98%, showing that growth currently sacrifices profitability. The latest year highlights a struggle to convert revenue gains into bottom-line results.
Margin Mastery vs. Growth Struggles
Adobe dominates with consistent profitability and margin strength, achieving nearly 30% net margins and double-digit revenue growth. Figma impresses with rapid revenue growth but suffers from deep losses and negative net margins. Adobe’s profile appeals to investors seeking stable, efficient profit engines. Figma represents a high-growth yet riskier proposition, lacking current earnings sustainability.
Financial Ratios Comparison
These vital ratios act as a diagnostic tool to expose the underlying fiscal health, valuation premiums, and capital efficiency of each company:
| Ratios | Adobe Inc. (ADBE) | Figma, Inc. (FIG) |
|---|---|---|
| ROE | 61.3% | -55.3% |
| ROIC | 36.7% | -59.7% |
| P/E | 19.1 | -70.7 |
| P/B | 11.7 | 39.1 |
| Current Ratio | 1.0 | 3.7 |
| Quick Ratio | 1.0 | 3.7 |
| D/E | 0.57 | 0.02 |
| Debt-to-Assets | 22.5% | 1.6% |
| Interest Coverage | 33.1 | 0 |
| Asset Turnover | 0.81 | 0.42 |
| Fixed Asset Turnover | 10.9 | 17.1 |
| Payout Ratio | 0 | 0 |
| Dividend Yield | 0 | 0 |
| Fiscal Year | 2025 | 2024 |
Efficiency & Valuation Duel: The Vital Signs
Financial ratios act as a company’s DNA, uncovering hidden risks and operational strengths that raw numbers alone cannot reveal.
Adobe Inc.
Adobe delivers robust profitability with a 61.3% ROE and a strong 30% net margin, signaling operational excellence. The stock trades at a reasonable P/E of 19.1 and an EV/Sales of 5.8, reflecting moderate valuation. Adobe reinvests heavily in R&D (18% of revenue), foregoing dividends to fuel growth and sustain its competitive moat.
Figma, Inc.
Figma shows distressed profitability, with a -55.3% ROE and a net margin near -98%, highlighting significant operational challenges. Its P/E ratio is negative but EV/Sales soars above 68, suggesting a highly stretched valuation. Figma invests aggressively in R&D, exceeding 100% of revenue, indicating a growth-focused strategy without shareholder returns via dividends.
Steady Profitability vs. High-Growth Risk
Adobe balances strong returns and sensible valuation, underpinning a stable risk-reward profile. Figma’s metrics reveal high risk and valuation excess amid operational losses. Investors seeking stability and proven profitability find Adobe’s profile more fitting, while those targeting speculative growth must brace for volatility with Figma.
Which one offers the Superior Shareholder Reward?
Adobe Inc. (ADBE) and Figma, Inc. (FIG) both forego dividends, focusing on reinvestment and buybacks, but their shareholder rewards diverge sharply. Adobe shows zero dividend yield and payout but boasts robust free cash flow of 23.1B per share with a near 1.0 FCF to operating cash flow ratio. It supports buybacks as a key return tool, sustained by a solid operating margin near 30% and prudent leverage (debt to equity at 0.57). Conversely, Figma remains unprofitable with negative margins and free cash flow, relying entirely on growth investments and minimal debt. Its current ratio of 3.66 signals liquidity but no shareholder distributions. Adobe’s mature, cash-generative model funds buybacks sustainably, while Figma’s loss-making status precludes near-term returns. I conclude Adobe offers a superior total return profile for 2026 investors prioritizing shareholder reward and capital discipline.
Comparative Score Analysis: The Strategic Profile
The radar chart reveals the fundamental DNA and trade-offs of Adobe Inc. and Figma, Inc., highlighting their distinct strategic strengths and weaknesses:
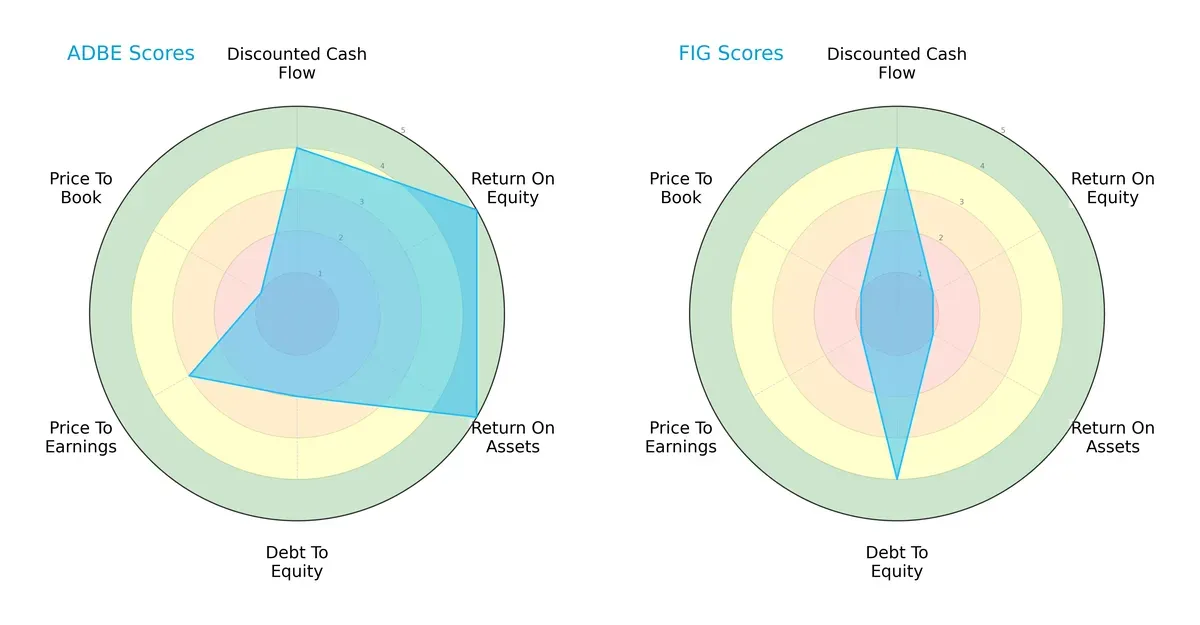
Adobe exhibits a more balanced profile with strong ROE and ROA scores (5 each), indicating efficient profit generation and asset utilization. Figma matches Adobe in discounted cash flow (DCF) with a score of 4 but lags significantly in profitability metrics (ROE 1, ROA 1). Figma’s debt-to-equity score (4) shows better leverage management compared to Adobe’s moderate 2. Adobe’s valuation scores (PE 3, PB 1) suggest mixed market perceptions, while Figma struggles with very unfavorable PE and PB scores (1 each). Overall, Adobe dominates with operational efficiency, whereas Figma relies on financial prudence.
Bankruptcy Risk: Solvency Showdown
The Altman Z-Score comparison indicates both companies reside comfortably in the safe zone, but Figma’s higher score suggests superior solvency:
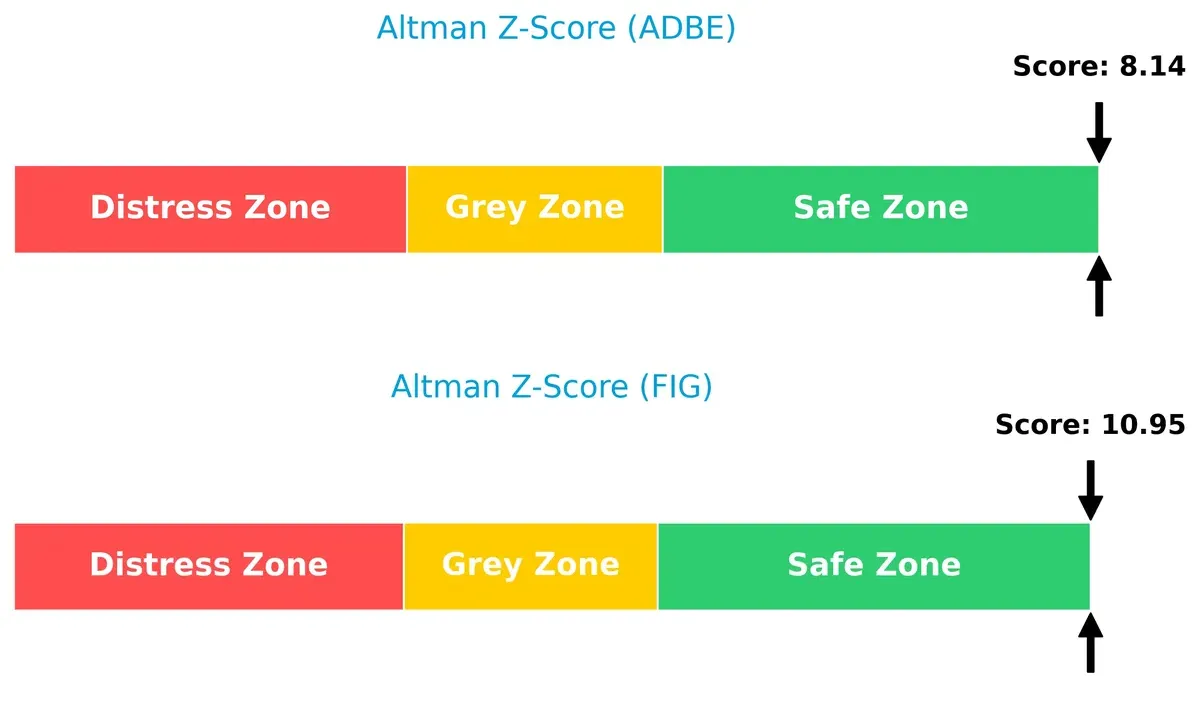
Figma’s Altman Z-Score of 10.95 far exceeds Adobe’s 8.14. Both firms exhibit strong long-term survival potential, yet Figma’s higher buffer against bankruptcy risk reflects a more conservative financial structure in this cycle.
Financial Health: Quality of Operations
The Piotroski F-Score analysis shows Adobe holds a clear edge in operational quality and financial health:
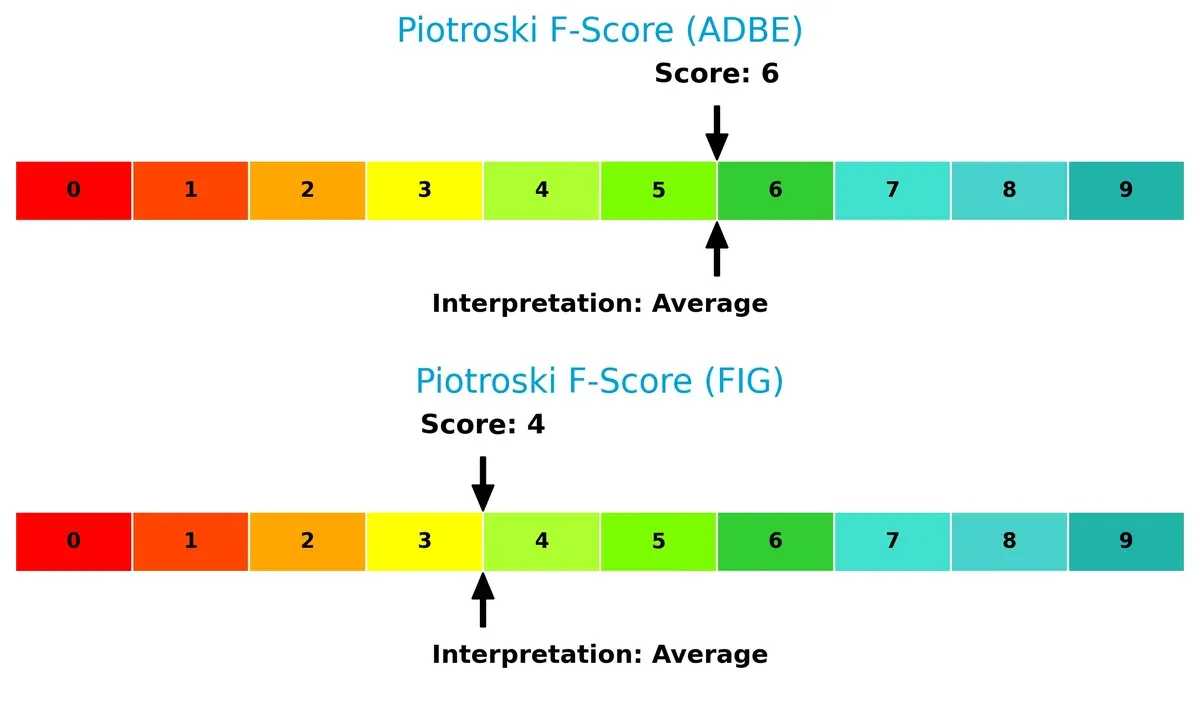
Adobe’s score of 6 stands above Figma’s 4, signaling stronger profitability, liquidity, and efficiency metrics. Neither company reaches peak financial health, but Figma’s lower score raises caution on internal fundamentals compared to Adobe’s steadier position.
How are the two companies positioned?
This section dissects Adobe and Figma’s operational DNA by comparing revenue distribution across segments and analyzing their internal strengths and weaknesses. The goal is to confront their economic moats to determine which model delivers the most resilient, sustainable advantage today.
Revenue Segmentation: The Strategic Mix
This visual comparison dissects how Adobe Inc. and Figma, Inc. diversify their income streams and highlights their primary sector bets:
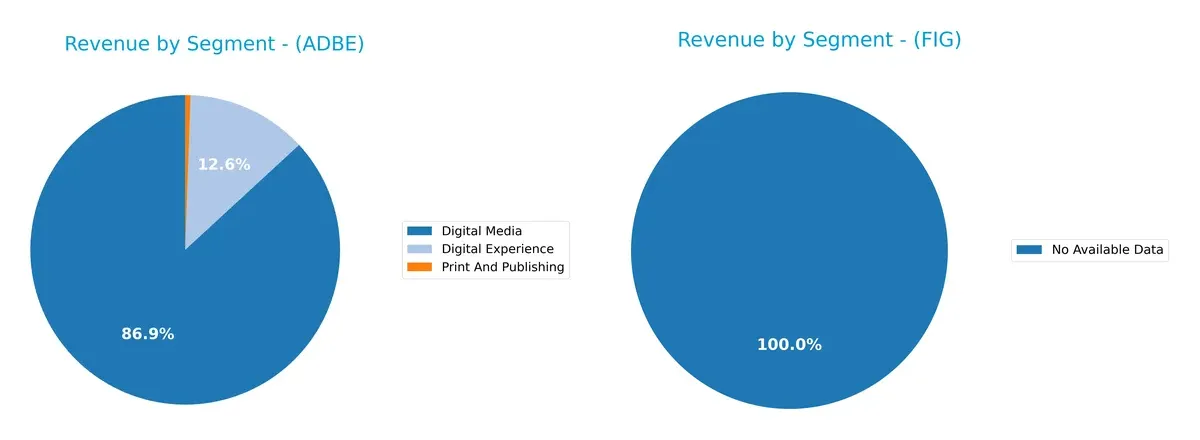
Adobe’s revenue heavily pivots on Digital Media, generating $40.4B in 2025 and dwarfing its other segments. Digital Experience anchors $5.9B, showing strategic expansion. Figma lacks available segmentation data, preventing comparison. Adobe’s concentrated reliance on Digital Media signals strong ecosystem lock-in but raises concentration risk if market disruptions occur. Its growing Digital Experience segment suggests infrastructure dominance, balancing long-term sustainability.
Strengths and Weaknesses Comparison
This table compares the strengths and weaknesses of Adobe Inc. and Figma, Inc.:
Adobe Inc. Strengths
- Strong profitability with 30% net margin and 61.34% ROE
- Favorable ROIC at 36.69% exceeding WACC
- Solid debt management with 22.54% debt to assets
- High interest coverage ratio at 33.96
- Diversified revenue streams across Digital Media and Experience
- Established global presence with significant Americas and EMEA sales
Figma, Inc. Strengths
- Low debt levels with 0.02 debt to equity and 1.6% debt to assets
- Favorable WACC at 4.73% indicating cheap capital
- High fixed asset turnover at 17.09
- Strong liquidity with quick ratio at 3.66
- Favorable P/E in context of growth company valuation
Adobe Inc. Weaknesses
- Unfavorable WACC at 10.6% above ROIC could pressure returns
- Weak current ratio at 1.0 signals tight liquidity
- High price to book ratio at 11.73 suggests rich valuation
- No dividend yield limits income appeal
- Moderate asset turnover at 0.81
Figma, Inc. Weaknesses
- Negative net margin at -97.74% and large losses
- Negative ROE at -55.29% and ROIC at -59.68% reflect poor profitability
- Zero interest coverage indicates high financial risk
- Unfavorable P/B at 39.1 signals expensive valuation
- Unfavorable asset turnover at 0.42 shows low efficiency
Adobe demonstrates robust profitability and diversified global revenues but faces liquidity and valuation challenges. Figma benefits from low debt and liquidity but struggles with substantial losses and operational inefficiencies. These contrasts highlight different strategic stages and risk profiles for each company.
The Moat Duel: Analyzing Competitive Defensibility
A structural moat protects long-term profits from relentless competitive erosion. Without one, sustainable earnings simply vanish:
Adobe Inc.: Intangible Asset Powerhouse
Adobe’s moat stems from its dominant Creative Cloud ecosystem, creating strong switching costs. High ROIC above 26% confirms efficient capital use and margin stability. Expansion into AI-driven creative tools in 2026 could deepen this moat further.
Figma, Inc.: Emerging Network Effects
Figma relies on collaborative design network effects but lacks Adobe’s scale and profitability. Negative ROIC and steep margin losses signal value destruction. Growth in user base offers upside, yet cost control remains a critical challenge for 2026.
Moat Strength Showdown: Intangible Assets vs. Network Effects
Adobe’s wide, durable intangible asset moat outmatches Figma’s nascent network effects. Adobe’s proven value creation and margin discipline better defend market share amid intensifying competition.
Which stock offers better returns?
The past 12 months saw both Adobe Inc. and Figma, Inc. endure sharp price declines, with Adobe’s trend showing deceleration and Figma’s accelerating downside momentum.
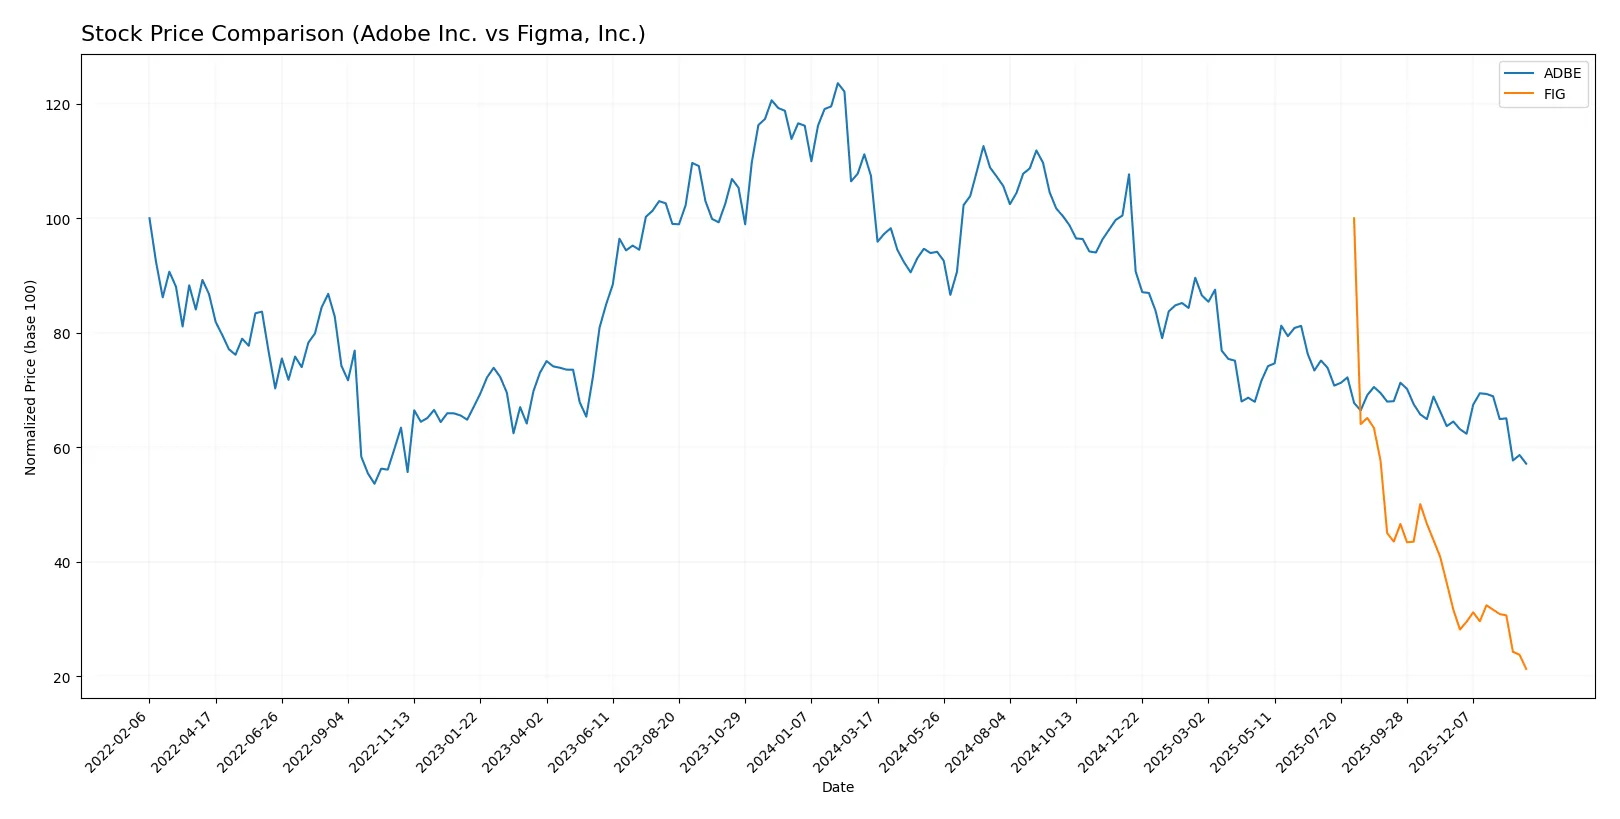
Trend Comparison
Adobe Inc. exhibits a bearish trend with a -46.85% price drop over the past year, showing deceleration in its decline despite high volatility around a 78.57 std deviation.
Figma, Inc. reveals a steeper bearish trend, falling -78.75% in the same period, with accelerating losses and lower volatility at a 20.35 std deviation.
Figma’s stock has delivered the weakest market performance, declining more sharply than Adobe across the analyzed timeframe.
Target Prices
Analysts present a strong upside consensus for Adobe Inc. and moderate expectations for Figma, Inc.
| Company | Target Low | Target High | Consensus |
|---|---|---|---|
| Adobe Inc. | 280 | 500 | 390.31 |
| Figma, Inc. | 38 | 52 | 43.6 |
Adobe’s consensus target of 390.31 implies a ~33% upside from the current 293.25 price, signaling robust growth expectations. Figma’s target consensus at 43.6 suggests nearly 68% upside from 25.92, reflecting high growth potential but also higher risk.

Don’t Let Luck Decide Your Entry Point
Optimize your entry points with our advanced ProRealTime indicators. You’ll get efficient buy signals with precise price targets for maximum performance. Start outperforming now!
How do institutions grade them?
Here is a summary of recent institutional grades for Adobe Inc. and Figma, Inc.:
Adobe Inc. Grades
The following table shows recent grade actions from reputable firms on Adobe Inc.:
| Grading Company | Action | New Grade | Date |
|---|---|---|---|
| UBS | Maintain | Neutral | 2026-01-26 |
| Oppenheimer | Downgrade | Perform | 2026-01-13 |
| BMO Capital | Downgrade | Market Perform | 2026-01-09 |
| Jefferies | Downgrade | Hold | 2026-01-05 |
| Citigroup | Maintain | Neutral | 2025-12-17 |
| BMO Capital | Maintain | Outperform | 2025-12-15 |
| Keybanc | Downgrade | Underweight | 2025-12-15 |
| Wolfe Research | Maintain | Outperform | 2025-12-11 |
| TD Cowen | Maintain | Hold | 2025-12-11 |
| Oppenheimer | Maintain | Outperform | 2025-12-11 |
Figma, Inc. Grades
The following table shows recent grade actions from reputable firms on Figma, Inc.:
| Grading Company | Action | New Grade | Date |
|---|---|---|---|
| Morgan Stanley | Maintain | Equal Weight | 2026-01-15 |
| Wells Fargo | Upgrade | Overweight | 2026-01-08 |
| RBC Capital | Maintain | Sector Perform | 2026-01-05 |
| Goldman Sachs | Maintain | Neutral | 2025-11-07 |
| JP Morgan | Maintain | Neutral | 2025-11-06 |
| Piper Sandler | Maintain | Overweight | 2025-11-06 |
| Wells Fargo | Maintain | Equal Weight | 2025-11-05 |
| Wells Fargo | Maintain | Equal Weight | 2025-09-04 |
| Morgan Stanley | Maintain | Equal Weight | 2025-09-04 |
| RBC Capital | Maintain | Sector Perform | 2025-09-04 |
Which company has the best grades?
Adobe Inc. shows a trend of downgrades, mostly to neutral or hold ratings. Figma, Inc. has mostly stable or upgraded ratings, including overweight from Wells Fargo. Figma’s grades suggest a more positive near-term outlook. Investors may interpret this divergence as differing confidence levels from analysts.
Risks specific to each company
The following categories identify the critical pressure points and systemic threats facing both firms in the 2026 market environment:
1. Market & Competition
Adobe Inc.
- Dominates diversified software infrastructure with strong market presence and mature segments.
Figma, Inc.
- Faces intense competition in application software with a newer product and narrower focus.
2. Capital Structure & Debt
Adobe Inc.
- Moderate debt-to-equity of 0.57; solid interest coverage at 33.96 indicates manageable leverage.
Figma, Inc.
- Very low debt-to-equity of 0.02 but zero interest coverage signals lack of earnings to service debt.
3. Stock Volatility
Adobe Inc.
- Beta of 1.53 suggests above-market volatility but within typical tech range.
Figma, Inc.
- Negative beta of -3.80 indicates unusual, potentially unstable price behavior and investor sentiment.
4. Regulatory & Legal
Adobe Inc.
- Subject to standard technology sector data privacy and IP regulations; no major legal red flags.
Figma, Inc.
- As a newer public company, faces evolving regulatory scrutiny and potential IP litigation risks.
5. Supply Chain & Operations
Adobe Inc.
- Established global operations with diversified distribution reduce supply chain risks.
Figma, Inc.
- Smaller scale and recent IPO may expose Figma to operational and scaling challenges.
6. ESG & Climate Transition
Adobe Inc.
- Larger company with increasing ESG initiatives; pressure to meet evolving climate standards.
Figma, Inc.
- Still developing ESG policies; smaller footprint but less visibility on climate strategy.
7. Geopolitical Exposure
Adobe Inc.
- Global footprint exposes Adobe to geopolitical tensions impacting technology exports.
Figma, Inc.
- More US-centric with limited international exposure, reducing geopolitical risk but limiting growth.
Which company shows a better risk-adjusted profile?
Adobe’s primary risk lies in its high price-to-book ratio and moderate leverage, but it boasts strong profitability and stable cash flow. Figma struggles with severe profitability deficits and unusual stock volatility but benefits from a pristine debt profile. Adobe’s established market position and financial strength offer a superior risk-adjusted profile amid 2026’s volatile tech landscape.
Final Verdict: Which stock to choose?
Adobe Inc. wields unmatched operational efficiency and robust free cash flow generation, creating durable value above its cost of capital. Its point of vigilance lies in a borderline current ratio, signaling working capital management challenges. Adobe fits well within aggressive growth portfolios seeking resilient tech leaders with proven profitability.
Figma, Inc. boasts a strategic moat in its rapid revenue growth and strong liquidity, supported by a lean debt profile. However, ongoing value destruction and negative profitability metrics raise caution. Figma suits investors favoring high-risk, high-reward scenarios within early-stage innovation plays or speculative growth allocations.
If you prioritize durable economic moats and consistent value creation, Adobe outshines with superior profitability and capital efficiency. However, if you seek explosive growth potential and can tolerate elevated risk, Figma offers a compelling, albeit volatile, opportunity in emerging software markets. Analytical prudence suggests monitoring liquidity and profitability dynamics closely regardless of choice.
Disclaimer: Investment carries a risk of loss of initial capital. The past performance is not a reliable indicator of future results. Be sure to understand risks before making an investment decision.
Go Further
I encourage you to read the complete analyses of Adobe Inc. and Figma, Inc. to enhance your investment decisions: