Home > Comparison > Technology > ADBE vs FFIV
The strategic rivalry between Adobe Inc. and F5, Inc. shapes the infrastructure software landscape. Adobe operates a diversified digital media and experience platform with a subscription-based model, while F5 focuses on multi-cloud application security and delivery solutions targeting enterprise clients. This contrast highlights a contest between broad-based digital creativity and specialized cloud security. This analysis seeks to identify which company offers a superior risk-adjusted return, vital for a balanced, technology-focused portfolio.
Table of contents
Companies Overview
Adobe Inc. and F5, Inc. shape the software infrastructure landscape with distinct yet impactful market roles.
Adobe Inc.: Creative and Digital Experience Powerhouse
Adobe leads as a diversified software company focused on creative and customer experience solutions. Its revenue engine centers on subscription services like Creative Cloud and Document Cloud, targeting content creators and enterprises. In 2026, Adobe emphasizes expanding integrated digital media and experience platforms, blending analytics with commerce to boost customer engagement.
F5, Inc.: Multi-Cloud Application Security Specialist
F5 anchors its identity in application security and delivery across multi-cloud environments. It generates revenue from hardware appliances, software modules, and cloud security offerings, serving enterprises and public sectors. The company’s 2026 strategy prioritizes enhancing cloud-native security and performance solutions, leveraging partnerships with AWS, Azure, and Google Cloud to secure and optimize application ecosystems.
Strategic Collision: Similarities & Divergences
Adobe and F5 both operate in software infrastructure but diverge sharply in philosophy. Adobe pursues a content-driven, subscription-based model with a closed ecosystem of creative and marketing tools. F5 adopts an open, multi-cloud approach focused on security and application delivery. Their primary battleground lies in the enterprise digital transformation space. Adobe appeals through integrated experience platforms, while F5 targets security-conscious cloud-native deployments. Both present distinct risk and growth profiles for investors.
Income Statement Comparison
This data dissects the core profitability and scalability of both corporate engines to reveal who dominates the bottom line:

| Metric | Adobe Inc. (ADBE) | F5, Inc. (FFIV) |
|---|---|---|
| Revenue | 23.8B | 3.1B |
| Cost of Revenue | 2.7B | 564M |
| Operating Expenses | 12.4B | 1.76B |
| Gross Profit | 21.1B | 2.52B |
| EBITDA | 9.75B | 901M |
| EBIT | 8.93B | 808M |
| Interest Expense | 263M | 0 |
| Net Income | 7.13B | 692M |
| EPS | 16.73 | 11.95 |
| Fiscal Year | 2025 | 2025 |
Income Statement Analysis: The Bottom-Line Duel
This income statement comparison reveals which company runs a more efficient corporate engine through revenue growth and margin analysis.
Adobe Inc. Analysis
Adobe’s revenue climbed steadily from $15.8B in 2021 to $23.8B in 2025, reflecting a robust 50.6% growth over five years. Net income surged 47.9%, reaching $7.13B in 2025. Adobe maintains exceptional margin health, with a gross margin near 88.6% and net margin at 30%, signaling strong cost control and pricing power. The 2025 jump in EBIT by 25.8% highlights operational momentum.
F5, Inc. Analysis
F5’s revenue grew more modestly, from $2.6B in 2021 to $3.1B in 2025, marking an 18.6% increase. Yet net income more than doubled, soaring 109% to $692M in 2025. Gross margin stands at a solid 81.7%, with a respectable net margin of 22.4%. Despite slower revenue gains, F5’s net margin expanded 76.2% overall, showing improving profitability and operational leverage.
Margin Power vs. Revenue Scale
Adobe excels in scale and margin dominance, delivering strong top-line growth with industry-leading profitability. F5 impresses with sharper net income growth and margin expansion despite smaller revenues. Adobe’s profile suits those prioritizing robust, large-scale cash flow. F5 appeals more to investors focused on accelerating profit improvement and margin gains.
Financial Ratios Comparison
These vital ratios act as a diagnostic tool to expose the underlying fiscal health, valuation premiums, and capital efficiency of the companies compared below:
| Ratios | Adobe Inc. (ADBE) | F5, Inc. (FFIV) |
|---|---|---|
| ROE | 61.3% | 19.3% |
| ROIC | 36.7% | 14.0% |
| P/E | 19.1 | 26.9 |
| P/B | 11.7 | 5.2 |
| Current Ratio | 1.0 | 1.56 |
| Quick Ratio | 1.0 | 1.51 |
| D/E (Debt-to-Equity) | 0.57 | 0.06 |
| Debt-to-Assets | 22.5% | 3.7% |
| Interest Coverage | 33.1 | N/A |
| Asset Turnover | 0.81 | 0.49 |
| Fixed Asset Turnover | 10.9 | 9.0 |
| Payout Ratio | 0% | 0% |
| Dividend Yield | 0% | 0% |
| Fiscal Year | 2025 | 2025 |
Efficiency & Valuation Duel: The Vital Signs
Financial ratios serve as the company’s DNA, exposing hidden risks and operational excellence that shape long-term investor outcomes.
Adobe Inc.
Adobe exhibits exceptional profitability with a 61.34% ROE and a strong 30% net margin, highlighting operational efficiency. Its P/E ratio of 19.13 marks a neutral valuation, neither cheap nor expensive. Adobe refrains from dividends, reinvesting heavily in R&D (18% of revenue), fueling growth and innovation.
F5, Inc.
F5 posts solid but lower profitability, with a 19.28% ROE and a 22.42% net margin. The stock trades at a stretched P/E of 26.91, reflecting premium valuation. F5 maintains no dividend, instead focusing on moderate R&D investment (17.5% of revenue) to sustain competitive positioning in its niche.
Balanced Profitability vs. Valuation Premium
Adobe’s superior profitability and efficient capital use contrast with F5’s higher valuation and moderate returns. Adobe offers a more robust operational profile with growth reinvestment, while F5 demands a premium for less efficiency. Investors seeking stable operational excellence may lean toward Adobe’s profile, whereas those favoring growth at a higher price might consider F5.
Which one offers the Superior Shareholder Reward?
Adobe Inc. (ADBE) and F5, Inc. (FFIV) both forgo dividends, focusing on reinvestment and buybacks. Adobe’s free cash flow per share hits 23.1 vs. F5’s 15.7 in 2025, fueling aggressive buybacks. Adobe’s payout ratio is zero, but its capital expenditure coverage ratio (56x) signals ample cash flow to sustain repurchases. F5’s buyback capacity is solid but more modest with a capital expenditure coverage of 22x. Adobe’s higher profit margins and robust operating cash flow underpin a more sustainable distribution model. I conclude Adobe offers the superior total shareholder return profile in 2026.
Comparative Score Analysis: The Strategic Profile
The radar chart reveals the fundamental DNA and trade-offs of Adobe Inc. and F5, Inc., highlighting their core financial strengths and valuation challenges:
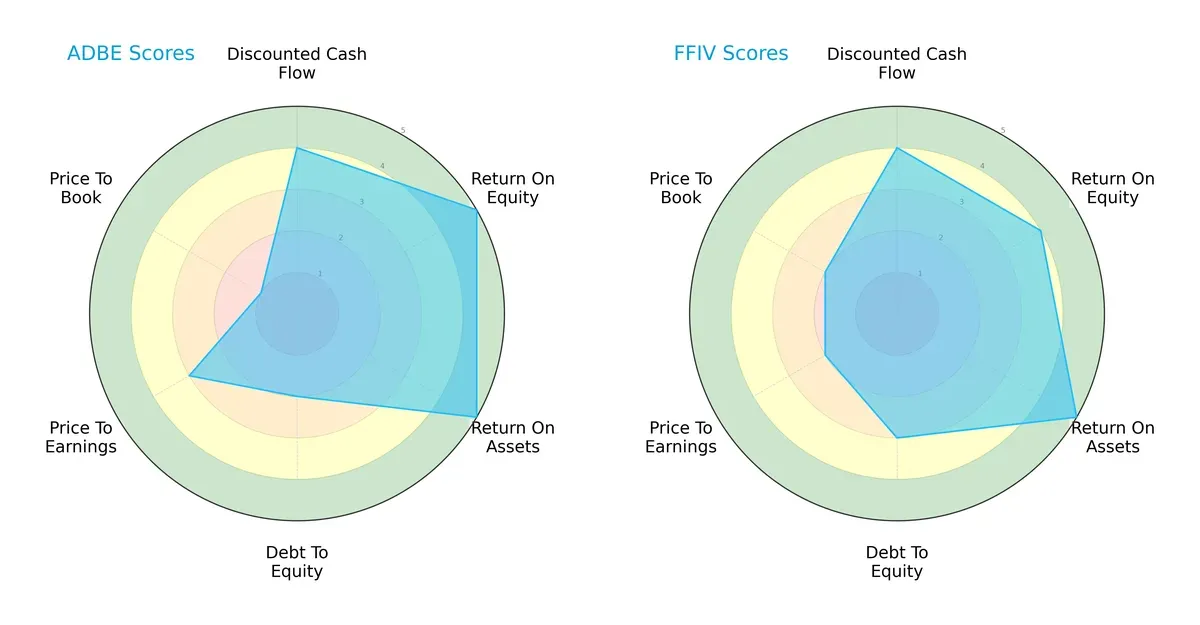
Adobe leads in return on equity (5 vs. 4) and return on assets (5 vs. 5 tied), showing superior profitability and asset efficiency. F5 holds a slight edge in debt-to-equity (3 vs. 2) and price-to-book valuation (2 vs. 1), suggesting a more conservative balance sheet and better market pricing. Adobe’s profile leans heavily on operational efficiency but struggles on price-to-book, while F5 offers a more balanced albeit moderate risk-return setup.
—
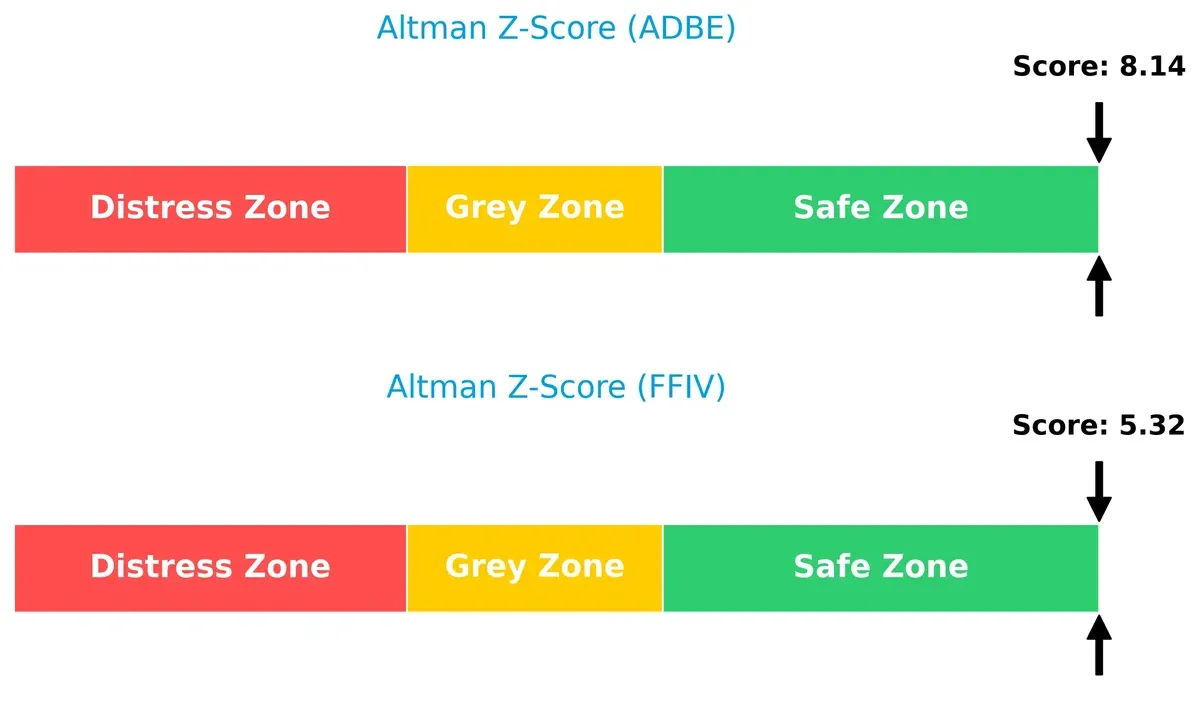
Bankruptcy Risk: Solvency Showdown
Adobe’s Altman Z-Score of 8.14 significantly outpaces F5’s 5.32, indicating a stronger buffer against bankruptcy risks in this late-cycle environment:
—
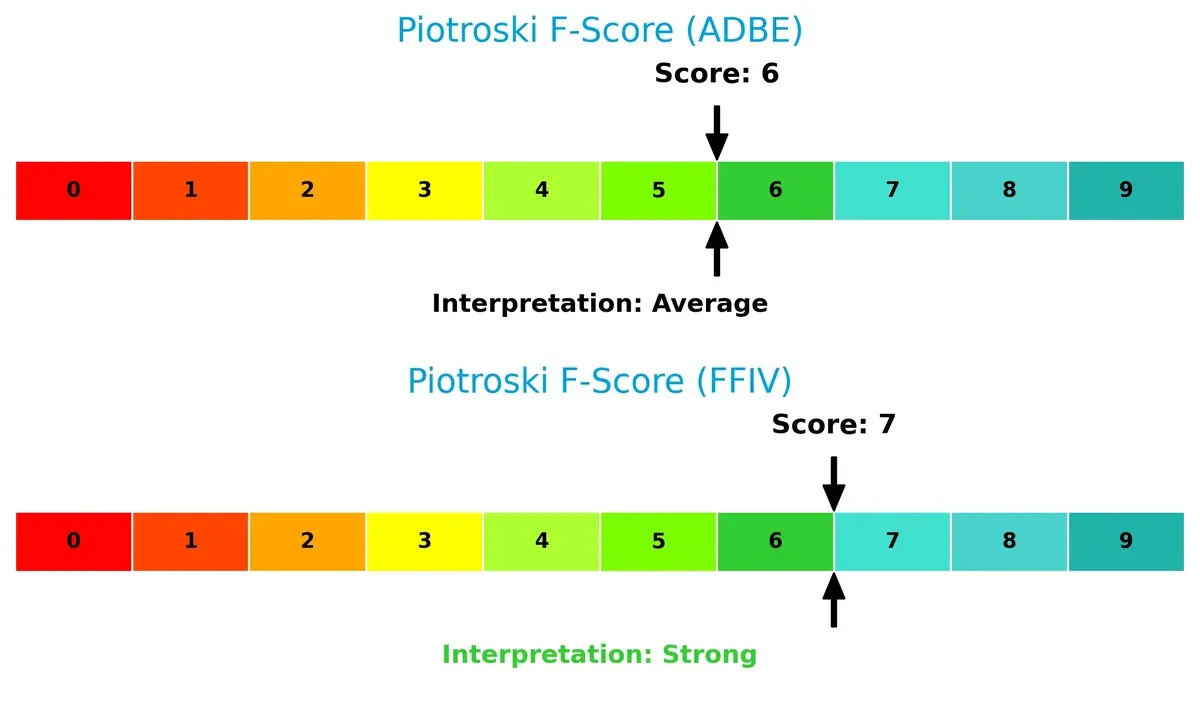
Financial Health: Quality of Operations
F5’s Piotroski F-Score of 7 surpasses Adobe’s 6, signaling marginally stronger fundamentals and fewer red flags in operational quality:
How are the two companies positioned?
This section dissects Adobe and F5’s operational DNA by comparing their revenue distribution and internal strengths and weaknesses. The goal is to confront their economic moats and reveal which model offers the most resilient competitive advantage today.
Revenue Segmentation: The Strategic Mix
This comparison dissects how Adobe Inc. and F5, Inc. diversify their income streams and where their primary sector bets lie:
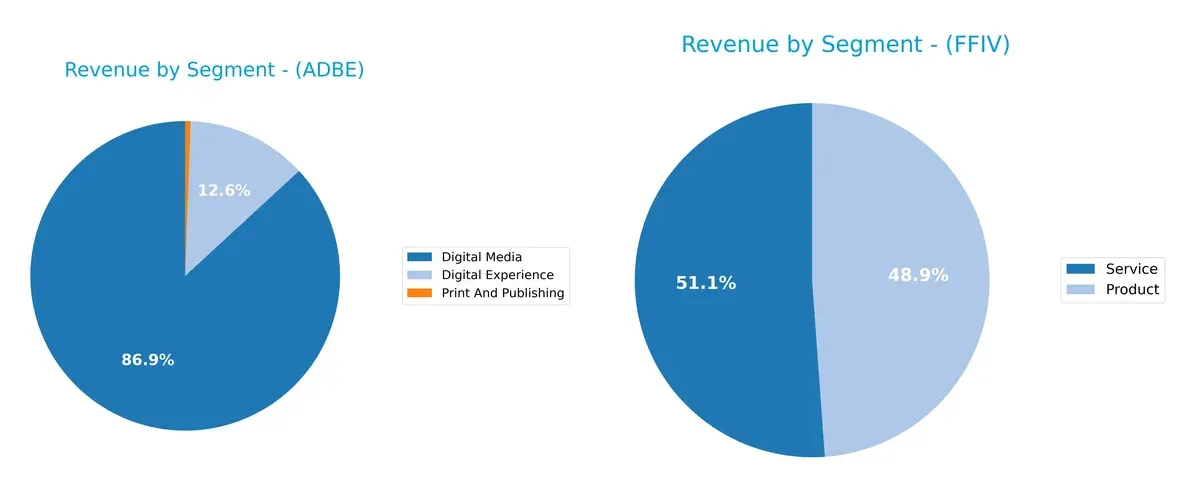
Adobe Inc. dwarfs F5 with a heavy reliance on its Digital Media segment, generating $40.4B in 2025, anchoring its revenue. Digital Experience adds $5.9B, showing some diversification. F5 shows a balanced split: $1.51B in Product and $1.58B in Service revenue in 2025. Adobe’s concentration in Digital Media signals ecosystem lock-in risk, while F5’s mix reduces dependency on one segment, supporting stable revenue resilience.
Strengths and Weaknesses Comparison
This table compares the Strengths and Weaknesses of Adobe Inc. and F5, Inc.:
Adobe Inc. Strengths
- High profitability with 30% net margin and 61.34% ROE
- Strong ROIC at 36.69% above WACC
- Robust global presence with $14.1B Americas and $6.3B EMEA revenue
- Diversified revenue streams including Digital Media and Digital Experience
- Favorable debt-to-assets at 22.54% supports financial stability
- Efficient fixed asset turnover at 10.88
F5, Inc. Strengths
- Favorable net margin at 22.42% and positive ROE of 19.28%
- Strong balance sheet with current ratio 1.56 and low debt-to-assets 3.65%
- Favorable interest coverage with infinite ratio
- Balanced revenue from Products and Services segments
- Global reach includes $1.8B Americas and $827M EMEA sales
- Consistent fixed asset turnover at 9.02
Adobe Inc. Weaknesses
- Current ratio at 1.0 signals tight liquidity
- High price-to-book ratio at 11.73 may indicate overvaluation
- WACC at 10.6% is unfavorable compared to ROIC
- Zero dividend yield limits income appeal
- Moderate asset turnover at 0.81 could constrain growth
- Heavy reliance on Digital Media segment
F5, Inc. Weaknesses
- Elevated price-to-earnings at 26.91 suggests premium valuation
- Asset turnover low at 0.49 reflects operational efficiency concerns
- Zero dividend yield reduces income for shareholders
- Smaller revenue base limits scale compared to Adobe
- Slightly lower ROIC at 13.99% could pressure returns
- Limited diversification beyond Products and Services
Both companies show solid profitability and global presence but face valuation and liquidity challenges. Adobe’s strength lies in innovation and diversified segments, while F5 benefits from a strong balance sheet and operational stability. These factors shape their strategic positioning and risk profiles.
The Moat Duel: Analyzing Competitive Defensibility
A structural moat protects long-term profits from competition’s erosion and ensures enduring value creation for shareholders:
Adobe Inc.: Intangible Assets Powerhouse
Adobe leverages its vast intangible assets, especially Creative Cloud’s brand and ecosystem, reflected in a strong 88.6% gross margin and stable 30% net margin. Continued innovation in digital media and experience deepens this moat in 2026.
F5, Inc.: Specialized Technology and Integration Edge
F5’s moat centers on its specialized multi-cloud application security and delivery technology, with a solid 81.7% gross margin and improving net margin growth. Its partnerships with cloud giants fuel expansion opportunities, challenging Adobe’s broader software dominance.
Intangible Assets vs. Specialized Tech: Who Holds the Stronger Moat?
Adobe’s wider moat stems from higher ROIC excess over WACC (26% vs. 5.7%) and a dominant brand ecosystem. While F5 grows efficiently, Adobe is better positioned to protect market share and sustain profitability long term.
Which stock offers better returns?
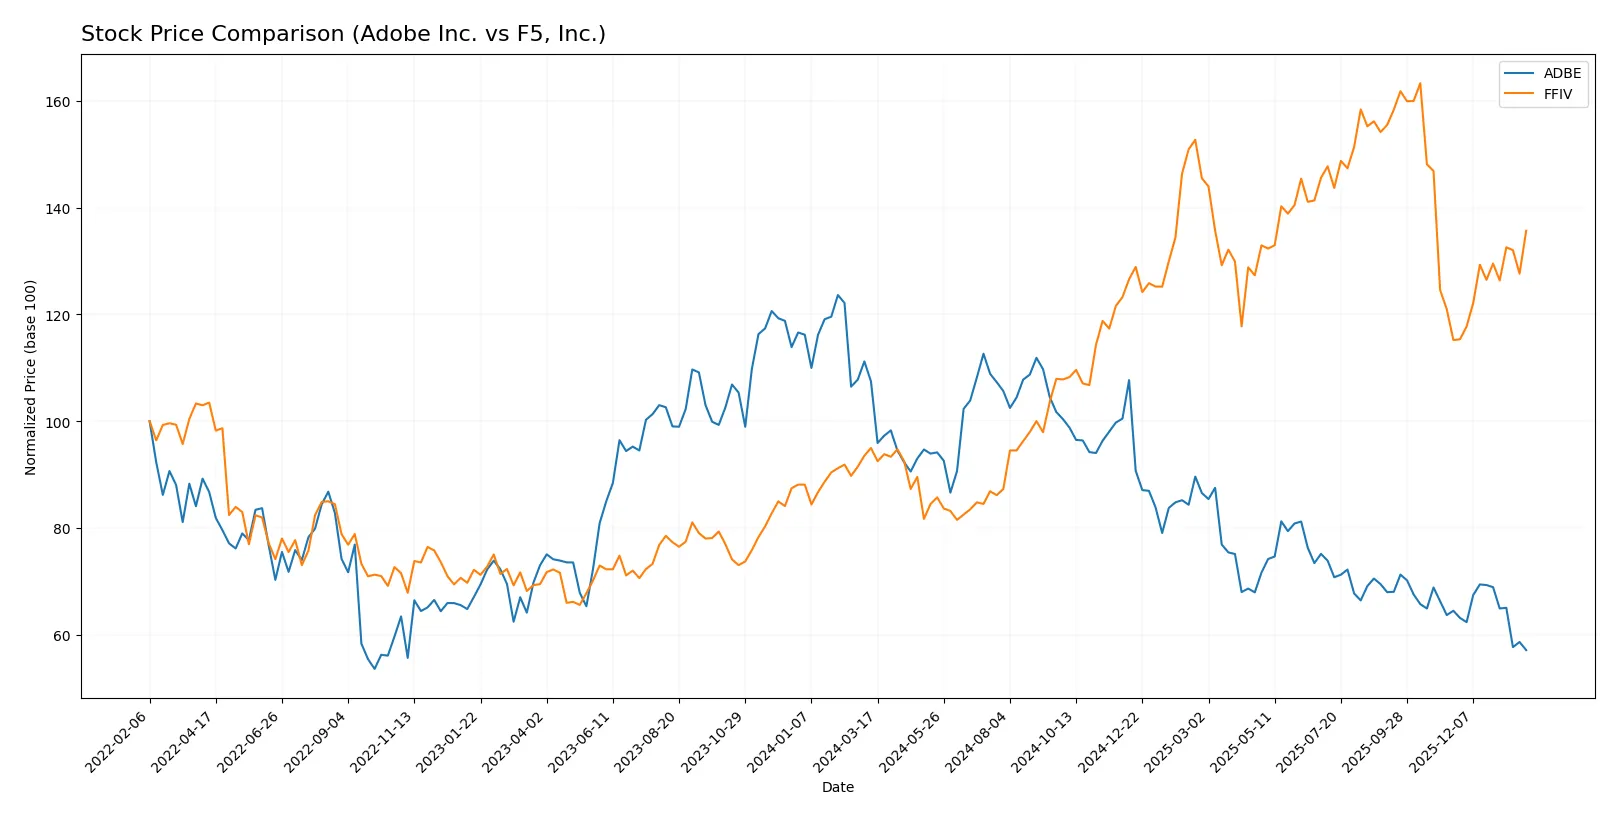
The past year reveals starkly contrasting trends for Adobe Inc. and F5, Inc., with Adobe enduring a sharp decline while F5 rallies with accelerating momentum.
Trend Comparison
Adobe Inc. shows a bearish trend with a -47% price drop over the past 12 months. The trend decelerates, hitting a low of 293.25 from a high of 578.34, signaling weakening investor confidence.
F5, Inc. exhibits a bullish trend with a 43% gain over the same period. The upward momentum accelerates, reaching a high of 331.75 from a low of 165.57, reflecting growing market enthusiasm.
F5 outperforms Adobe significantly, delivering the highest market return with sustained upward acceleration versus Adobe’s prolonged decline.
Target Prices
Analysts provide a positive outlook on both Adobe Inc. and F5, Inc., indicating upside potential from current prices.
| Company | Target Low | Target High | Consensus |
|---|---|---|---|
| Adobe Inc. | 280 | 500 | 390.31 |
| F5, Inc. | 295 | 352 | 328.25 |
Adobe’s consensus target of 390.31 implies about a 33% upside from the current 293.25 price. F5’s 328.25 target suggests a 19% gain over the 275.61 market price.

Don’t Let Luck Decide Your Entry Point
Optimize your entry points with our advanced ProRealTime indicators. You’ll get efficient buy signals with precise price targets for maximum performance. Start outperforming now!
How do institutions grade them?
Adobe Inc. Grades
The following table summarizes recent grades assigned to Adobe Inc. by major institutions.
| Grading Company | Action | New Grade | Date |
|---|---|---|---|
| UBS | Maintain | Neutral | 2026-01-26 |
| Oppenheimer | Downgrade | Perform | 2026-01-13 |
| BMO Capital | Downgrade | Market Perform | 2026-01-09 |
| Jefferies | Downgrade | Hold | 2026-01-05 |
| Citigroup | Maintain | Neutral | 2025-12-17 |
| BMO Capital | Maintain | Outperform | 2025-12-15 |
| Keybanc | Downgrade | Underweight | 2025-12-15 |
| Wolfe Research | Maintain | Outperform | 2025-12-11 |
| TD Cowen | Maintain | Hold | 2025-12-11 |
| Oppenheimer | Maintain | Outperform | 2025-12-11 |
F5, Inc. Grades
This table presents recent grades assigned to F5, Inc. by reputable grading firms.
| Grading Company | Action | New Grade | Date |
|---|---|---|---|
| RBC Capital | Maintain | Outperform | 2026-01-28 |
| Needham | Maintain | Hold | 2026-01-28 |
| Goldman Sachs | Maintain | Neutral | 2026-01-28 |
| Piper Sandler | Maintain | Overweight | 2026-01-28 |
| Barclays | Maintain | Equal Weight | 2026-01-28 |
| JP Morgan | Upgrade | Overweight | 2026-01-15 |
| Piper Sandler | Upgrade | Overweight | 2026-01-05 |
| RBC Capital | Upgrade | Outperform | 2026-01-05 |
| Morgan Stanley | Maintain | Equal Weight | 2025-12-17 |
| Morgan Stanley | Maintain | Equal Weight | 2025-10-28 |
Which company has the best grades?
F5, Inc. consistently earns upgrades and maintains Outperform and Overweight ratings. Adobe Inc. shows multiple downgrades and predominantly Neutral to Hold grades. Investors may view F5’s stronger institutional sentiment as a signal of greater confidence.
Risks specific to each company
The following categories identify the critical pressure points and systemic threats facing both firms in the 2026 market environment:
1. Market & Competition
Adobe Inc.
- Adobe dominates with diversified software platforms but faces intense competition in creative cloud and digital experience segments.
F5, Inc.
- F5 contends with stiff competition in multi-cloud security and application delivery, relying heavily on partnerships with major cloud providers.
2. Capital Structure & Debt
Adobe Inc.
- Moderate debt level (D/E 0.57) with favorable interest coverage; however, current ratio at 1.0 signals tight liquidity.
F5, Inc.
- Very low debt (D/E 0.06) and strong liquidity ratios (current ratio 1.56) indicate a conservative capital structure with cushion for downturns.
3. Stock Volatility
Adobe Inc.
- High beta of 1.526 implies elevated stock volatility, increasing market risk exposure.
F5, Inc.
- Lower beta of 0.975 suggests more stable stock behavior, reducing downside risk in volatile markets.
4. Regulatory & Legal
Adobe Inc.
- Global operations expose Adobe to complex data privacy and intellectual property regulations, increasing compliance costs.
F5, Inc.
- F5 faces evolving cybersecurity regulations impacting product design and service delivery, with potential legal liabilities.
5. Supply Chain & Operations
Adobe Inc.
- Cloud-based model reduces traditional supply chain risks but depends on data center reliability and software development cycles.
F5, Inc.
- Hardware-dependent appliances expose F5 to component shortages and manufacturing delays, heightening operational risks.
6. ESG & Climate Transition
Adobe Inc.
- Adobe invests in sustainable cloud infrastructure but must maintain transparency to meet rising ESG investor demands.
F5, Inc.
- F5’s energy-intensive hardware business faces pressure to reduce carbon footprint amid tightening climate regulations.
7. Geopolitical Exposure
Adobe Inc.
- Extensive international presence subjects Adobe to trade tensions and geopolitical instability risks.
F5, Inc.
- F5’s global sales and supply chains are vulnerable to geopolitical disruptions, especially in Asia-Pacific regions.
Which company shows a better risk-adjusted profile?
Adobe’s largest risk lies in elevated stock volatility and tight liquidity, raising concerns about market shocks and operational flexibility. F5’s primary risk is supply chain vulnerability due to hardware reliance. F5’s conservative capital structure and lower volatility offer a more balanced risk profile. Notably, Adobe’s current ratio of 1.0 signals potential liquidity strain, while F5’s strong liquidity ratios enhance resilience. Overall, F5 presents a better risk-adjusted profile in today’s uncertain market.
Final Verdict: Which stock to choose?
Adobe Inc. wields unmatched efficiency as its superpower, delivering exceptional returns on invested capital well above its cost of capital. Its point of vigilance lies in a tight liquidity position, which might pressure short-term operations. Adobe suits portfolios targeting aggressive growth and durable competitive advantages.
F5, Inc. benefits from a strategic moat rooted in solid balance sheet health and strong free cash flow yield, underpinning its financial stability. Compared to Adobe, F5 offers a safer profile with moderate but consistent profitability, fitting well into GARP (Growth at a Reasonable Price) portfolios focused on stability and value.
If you prioritize high return on invested capital and aggressive growth, Adobe outshines due to its robust profitability and durable moat despite liquidity risks. However, if you seek better financial stability with steady growth and less volatility, F5 offers a compelling alternative with a safer balance sheet and accelerating stock momentum.
Disclaimer: Investment carries a risk of loss of initial capital. The past performance is not a reliable indicator of future results. Be sure to understand risks before making an investment decision.
Go Further
I encourage you to read the complete analyses of Adobe Inc. and F5, Inc. to enhance your investment decisions: