Home > Comparison > Technology > ADBE vs CYBR
The strategic rivalry between Adobe Inc. and CyberArk Software Ltd. shapes the software infrastructure landscape. Adobe operates as a diversified technology giant with a broad digital media and experience platform. CyberArk focuses on specialized cybersecurity software, emphasizing privileged access management. This analysis contrasts Adobe’s expansive model with CyberArk’s niche expertise to identify which offers superior risk-adjusted growth potential for a diversified portfolio in today’s evolving tech environment.
Table of contents
Companies Overview
The software infrastructure market features Adobe Inc. and CyberArk Software Ltd., two influential players with distinct focuses.
Adobe Inc.: Creative and Digital Experience Powerhouse
Adobe dominates as a diversified software leader with a core business in Digital Media, Digital Experience, and Publishing. It generates revenue mainly through Creative Cloud subscriptions and cloud-based document services. In 2026, Adobe’s strategic focus centers on expanding integrated marketing platforms and enhancing customer experience analytics.
CyberArk Software Ltd.: Cybersecurity Specialist
CyberArk leads in cybersecurity software, specializing in privileged access management and identity services. It monetizes through SaaS solutions securing enterprise credentials, endpoints, and cloud entitlements. Its 2026 strategy prioritizes strengthening cloud-native security and expanding identity access management services across regulated industries.
Strategic Collision: Similarities & Divergences
Both operate in software infrastructure but differ sharply: Adobe builds broad digital ecosystems for creators and marketers, while CyberArk focuses on niche, high-stakes cybersecurity. Their primary battleground lies in securing enterprise digital assets versus enabling digital content creation. Adobe offers scale and integration, CyberArk delivers targeted security sophistication—two distinct investment profiles reflecting divergent risk and growth dynamics.
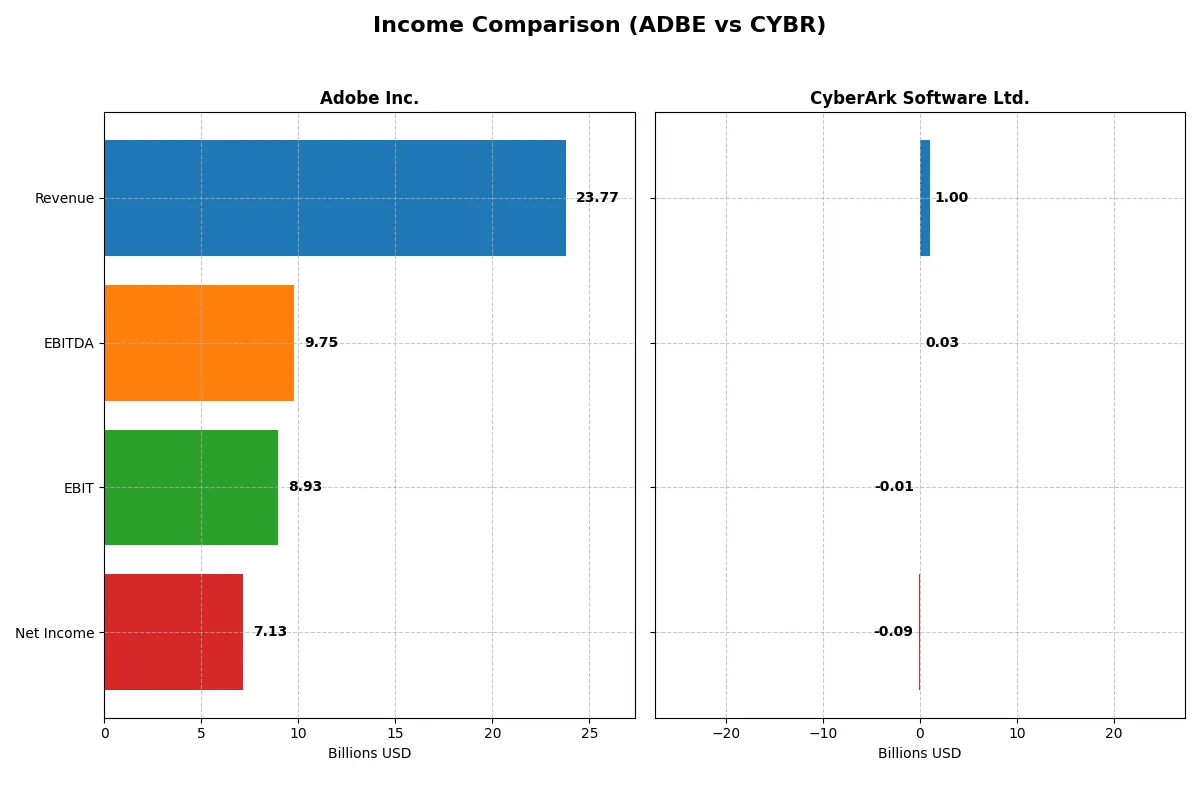
Income Statement Comparison
The following data dissects the core profitability and scalability of both corporate engines to reveal who dominates the bottom line:
| Metric | Adobe Inc. (ADBE) | CyberArk Software Ltd. (CYBR) |
|---|---|---|
| Revenue | 23.8B | 1.0B |
| Cost of Revenue | 2.7B | 208M |
| Operating Expenses | 12.4B | 865M |
| Gross Profit | 21.1B | 792M |
| EBITDA | 9.7B | 29M |
| EBIT | 8.9B | -13M |
| Interest Expense | 263M | 4.1M |
| Net Income | 7.1B | -93M |
| EPS | 16.73 | -2.12 |
| Fiscal Year | 2025 | 2024 |
Income Statement Analysis: The Bottom-Line Duel
The following income statement comparison reveals the core efficiency and profitability of Adobe Inc. and CyberArk Software Ltd.’s business models.
Adobe Inc. Analysis
Adobe’s revenue grew steadily from $15.8B in 2021 to $23.8B in 2025, driving net income from $4.8B to $7.1B. Its gross margin remained exceptionally strong near 88.6%, while net margins held at a favorable 30%. In 2025, Adobe demonstrated robust operational momentum with 25.8% EBIT growth and a 35.1% EPS increase, reflecting disciplined cost control and scalable profitability.
CyberArk Software Ltd. Analysis
CyberArk’s revenue more than doubled from $464M in 2020 to $1.0B in 2024, but it sustained net losses throughout, reaching -$93M in 2024. Gross margin stayed healthy at about 79%, yet the company struggled with negative EBIT and net margins (-1.3% and -9.3%, respectively). Despite strong revenue and EBIT growth rates, losses and deteriorating net margins signal ongoing challenges in translating scale into profitability.
Profitability Strength vs. Growth Struggles
Adobe clearly leads with sizable profits and margin resilience, leveraging scale to boost earnings efficiently. CyberArk impresses with rapid top-line expansion but remains unprofitable with negative net margins. For investors prioritizing solid, consistent returns, Adobe’s profile aligns better with sustainable value creation, while CyberArk reflects a higher-risk growth story still searching for profitability.
Financial Ratios Comparison
These vital ratios act as a diagnostic tool to expose the underlying fiscal health, valuation premiums, and capital efficiency for each company:
| Ratios | Adobe Inc. (ADBE) | CyberArk Software Ltd. (CYBR) |
|---|---|---|
| ROE | 61.3% | -3.9% |
| ROIC | 36.7% | -2.9% |
| P/E | 19.1 | -157.5 |
| P/B | 11.7 | 6.2 |
| Current Ratio | 1.00 | 1.48 |
| Quick Ratio | 1.00 | 1.48 |
| D/E (Debt-to-Equity) | 0.57 | 0.01 |
| Debt-to-Assets | 22.5% | 0.9% |
| Interest Coverage | 33.1 | -17.9 |
| Asset Turnover | 0.81 | 0.30 |
| Fixed Asset Turnover | 10.9 | 51.1 |
| Payout Ratio | 0 | 0 |
| Dividend Yield | 0 | 0 |
| Fiscal Year | 2025 | 2024 |
Efficiency & Valuation Duel: The Vital Signs
Financial ratios act as a company’s DNA, revealing hidden risks and operational excellence essential for investment decisions.
Adobe Inc.
Adobe demonstrates strong profitability with a 61.3% ROE and a robust 30% net margin, reflecting operational efficiency. Its P/E of 19.13 suggests a fairly valued stock amid solid growth. The company reinvests heavily in R&D (18% of revenue), foregoing dividends to fuel innovation and shareholder value creation.
CyberArk Software Ltd.
CyberArk struggles with negative profitability, posting a -3.9% ROE and a -9.3% net margin, signaling operational challenges. Despite a negative P/E, the valuation appears stretched with a 6.2 PB ratio. The firm lacks dividends, instead allocating over 24% of revenue to R&D to pursue future growth amid current losses.
Strong Profitability vs. Growth Challenges
Adobe offers a superior balance of profitability and valuation, with efficient capital use and sustained reinvestment. CyberArk faces higher risks due to negative returns but invests aggressively for growth. Investors prioritizing stability may lean toward Adobe, while those seeking turnaround potential might consider CyberArk’s profile.
Which one offers the Superior Shareholder Reward?
I compare Adobe Inc. (ADBE) and CyberArk Software Ltd. (CYBR) on shareholder reward through dividends, buybacks, and sustainability. Neither pays dividends, so I focus on reinvestment and buyback intensity. Adobe boasts robust free cash flow (~23.1/share in 2025) and no dividend payout. Its buyback program is strong, enabling capital return without sacrificing growth. CyberArk, conversely, posts negative net margins and inconsistent operating cash flow, limiting buyback capacity. Adobe’s model of reinvesting cash flow into growth while executing buybacks presents a more sustainable, superior total return profile. I favor Adobe for total shareholder reward in 2026.
Comparative Score Analysis: The Strategic Profile
The radar chart reveals the fundamental DNA and trade-offs of Adobe Inc. and CyberArk Software Ltd., highlighting their distinct strategic strengths and weaknesses:
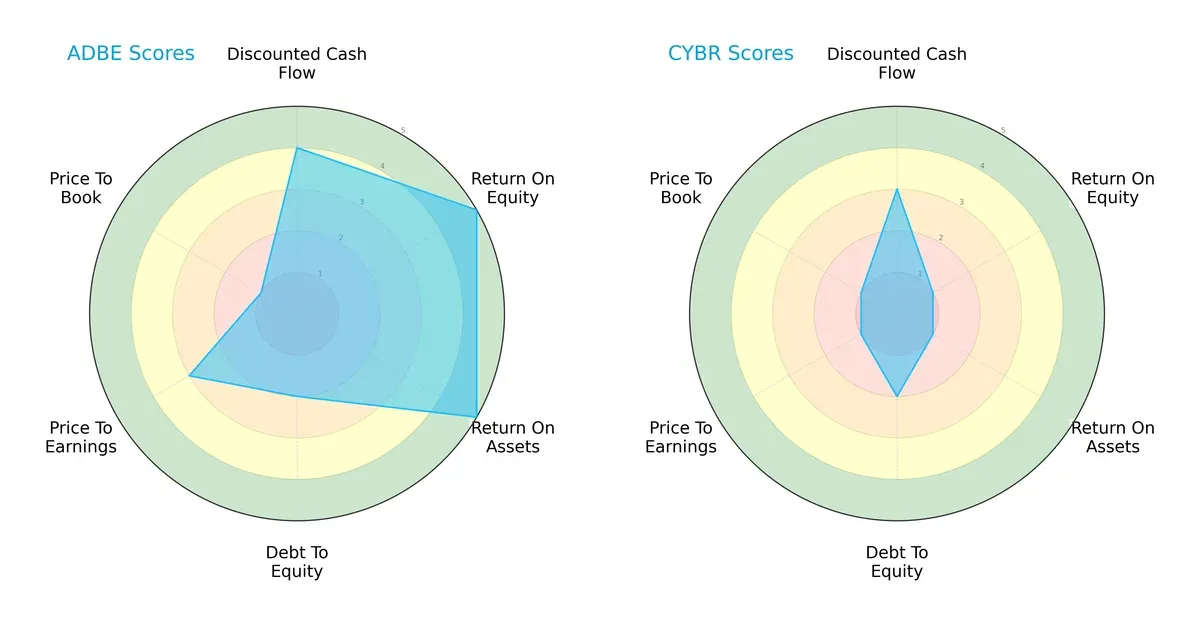
Adobe shows a balanced profile with strong ROE and ROA scores (5 each), signaling efficient profit and asset use. CyberArk lags with very low ROE and ROA (1 each), indicating operational challenges. Both have moderate debt-to-equity scores (2), but Adobe’s valuation scores suggest mixed investor sentiment, while CyberArk’s low scores reflect undervaluation risk. Adobe leverages broad strengths; CyberArk relies heavily on cost structure management.
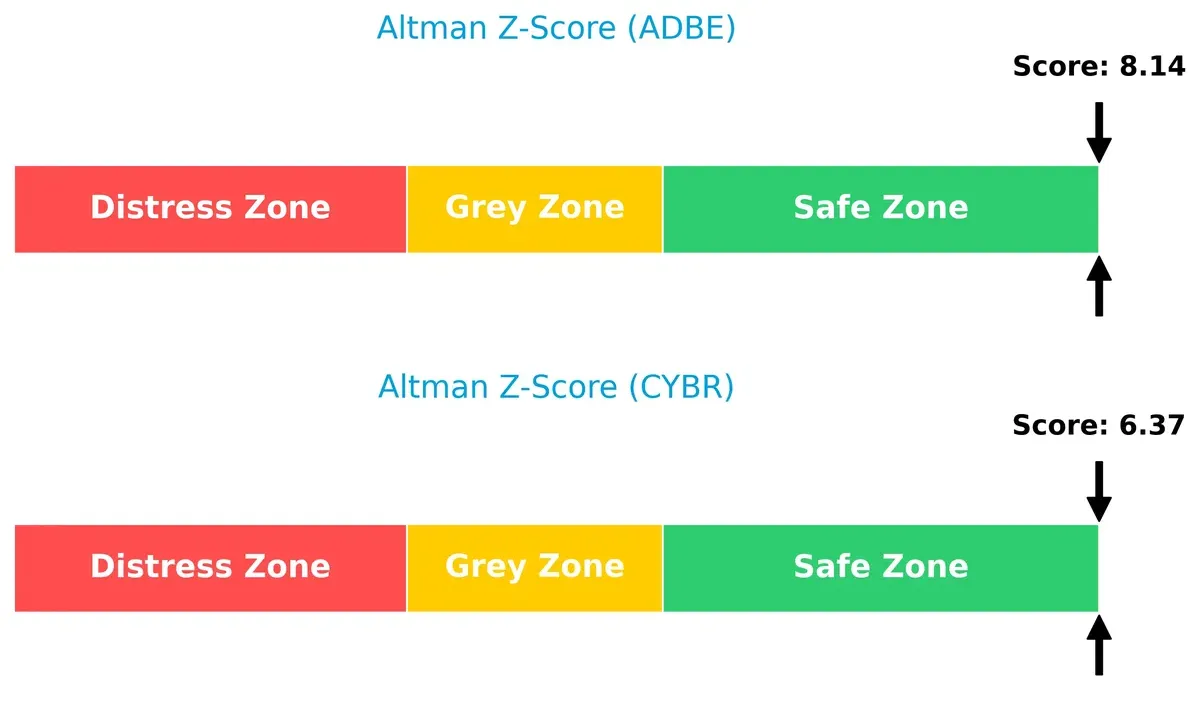
Bankruptcy Risk: Solvency Showdown
Adobe’s Altman Z-Score of 8.14 versus CyberArk’s 6.37 indicates both firms are in the safe zone, but Adobe exhibits superior financial stability and lower bankruptcy risk:
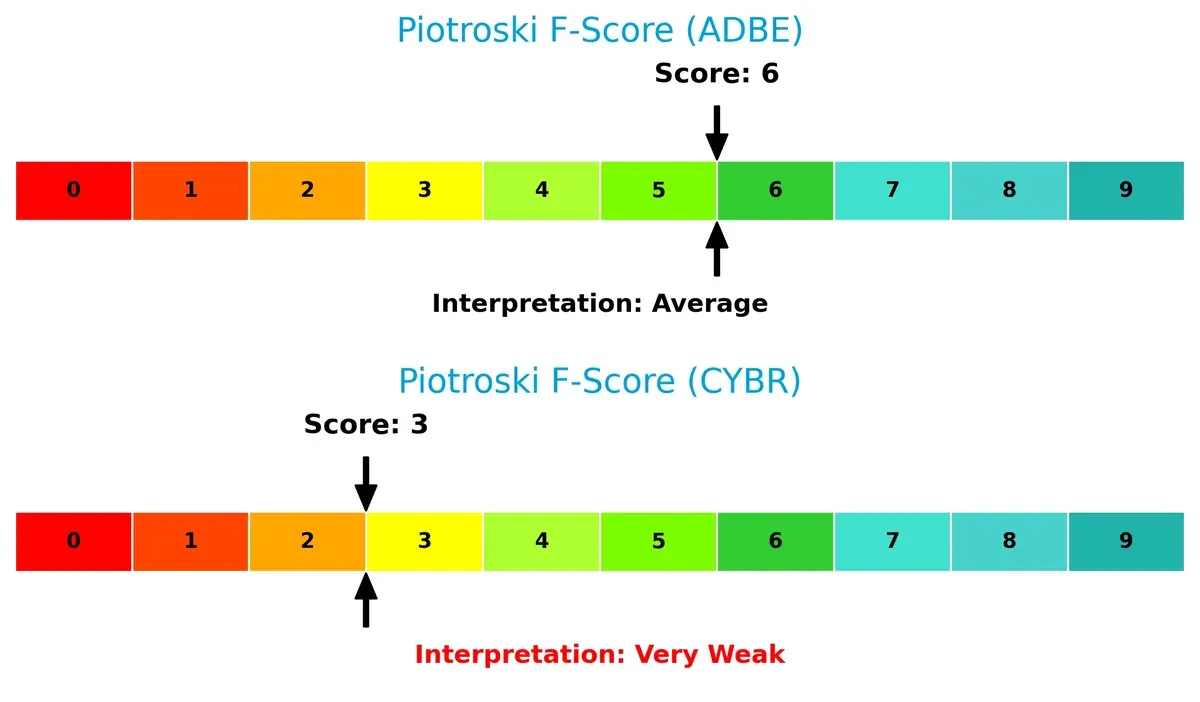
Financial Health: Quality of Operations
Adobe’s Piotroski F-Score of 6 signals average financial health, outperforming CyberArk’s weaker score of 3, which raises red flags about operational efficiency and internal controls:
How are the two companies positioned?
This section dissects Adobe and CyberArk’s operational DNA by comparing their revenue distribution and internal dynamics. The goal is to confront their economic moats and identify which model offers the most resilient competitive advantage today.
Revenue Segmentation: The Strategic Mix
The following visual comparison dissects how Adobe Inc. and CyberArk Software Ltd. diversify their income streams and where their primary sector bets lie:
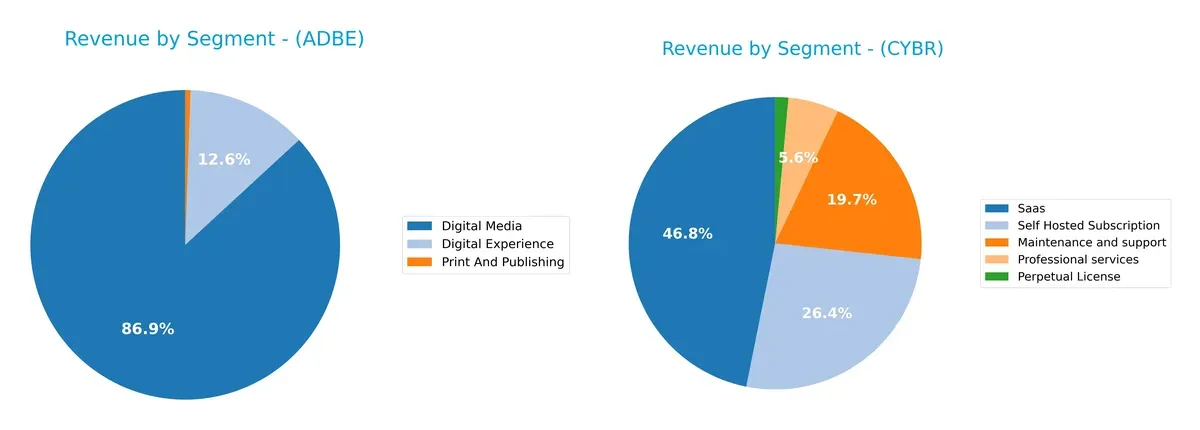
Adobe Inc. anchors its revenue in Digital Media with $40.4B in 2025, dwarfing its Digital Experience segment at $5.86B. This concentration signals a dominant creative ecosystem lock-in. CyberArk shows a more diversified mix, with SaaS at $469M, Self Hosted Subscription $265M, and Maintenance $197M, reflecting a balanced approach across software delivery models. Adobe’s focus risks dependence on one segment, while CyberArk pivots on multiple streams, reducing concentration risk.
Strengths and Weaknesses Comparison
This table compares the strengths and weaknesses of Adobe Inc. and CyberArk Software Ltd.:
Adobe Inc. Strengths
- Strong profitability with 30% net margin and 61.34% ROE
- Favorable debt metrics with 22.54% debt-to-assets
- High fixed asset turnover at 10.88
- Diverse product segments led by Digital Media at $40.4B
- Broad geographic presence, especially Americas at $14.1B
CyberArk Software Ltd. Strengths
- Favorable quick ratio at 1.48 and low debt-to-equity at 0.01
- High fixed asset turnover at 51.11
- Diverse revenue streams including SaaS $469M, subscriptions $265M
- Solid geographic diversification with $503M US revenue and growth in EMEA
Adobe Inc. Weaknesses
- Current ratio of 1.0 signals liquidity risk
- High price-to-book at 11.73 may limit upside
- WACC unfavorable at 10.6%
- No dividend yield
- Moderate asset turnover at 0.81
CyberArk Software Ltd. Weaknesses
- Negative profitability metrics: -9.34% net margin, -3.94% ROE
- Unfavorable interest coverage at -3.27
- Lower asset turnover at 0.3
- Unfavorable price-to-book at 6.21
- No dividend yield
Adobe’s strengths lie in robust profitability and broad global scale, though liquidity and valuation metrics raise caution. CyberArk shows operational efficiency and revenue diversification but struggles with profitability and financial stability. These contrasts highlight divergent strategic priorities and risk profiles.
The Moat Duel: Analyzing Competitive Defensibility
A structural moat alone defends long-term profits from competitive erosion. Let’s dissect the core advantages of these two tech firms:
Adobe Inc.: Intangible Assets Powerhouse
Adobe’s moat stems from strong intangible assets—its Creative Cloud brand and integrated digital experience platform. This drives a high ROIC of 26%, reflecting efficient capital use and margin stability. In 2026, expansion into AI-driven content tools could deepen this advantage.
CyberArk Software Ltd.: Niche Security Specialist
CyberArk’s moat relies on specialized cybersecurity software for privileged access management, contrasting Adobe’s broad digital media focus. However, its negative ROIC signals value destruction. Growth in cloud security could offer opportunities, but profitability challenges persist.
Intangible Assets vs. Niche Specialization: The Moat Verdict
Adobe’s wide moat, reinforced by a growing ROIC and stable margins, clearly outmatches CyberArk’s shrinking value and narrow focus. Adobe stands better equipped to defend and expand its market share in 2026.
Which stock offers better returns?
The past year saw divergent price trajectories: Adobe Inc. faced a sharp decline, while CyberArk Software Ltd. posted strong gains before recent pullbacks.
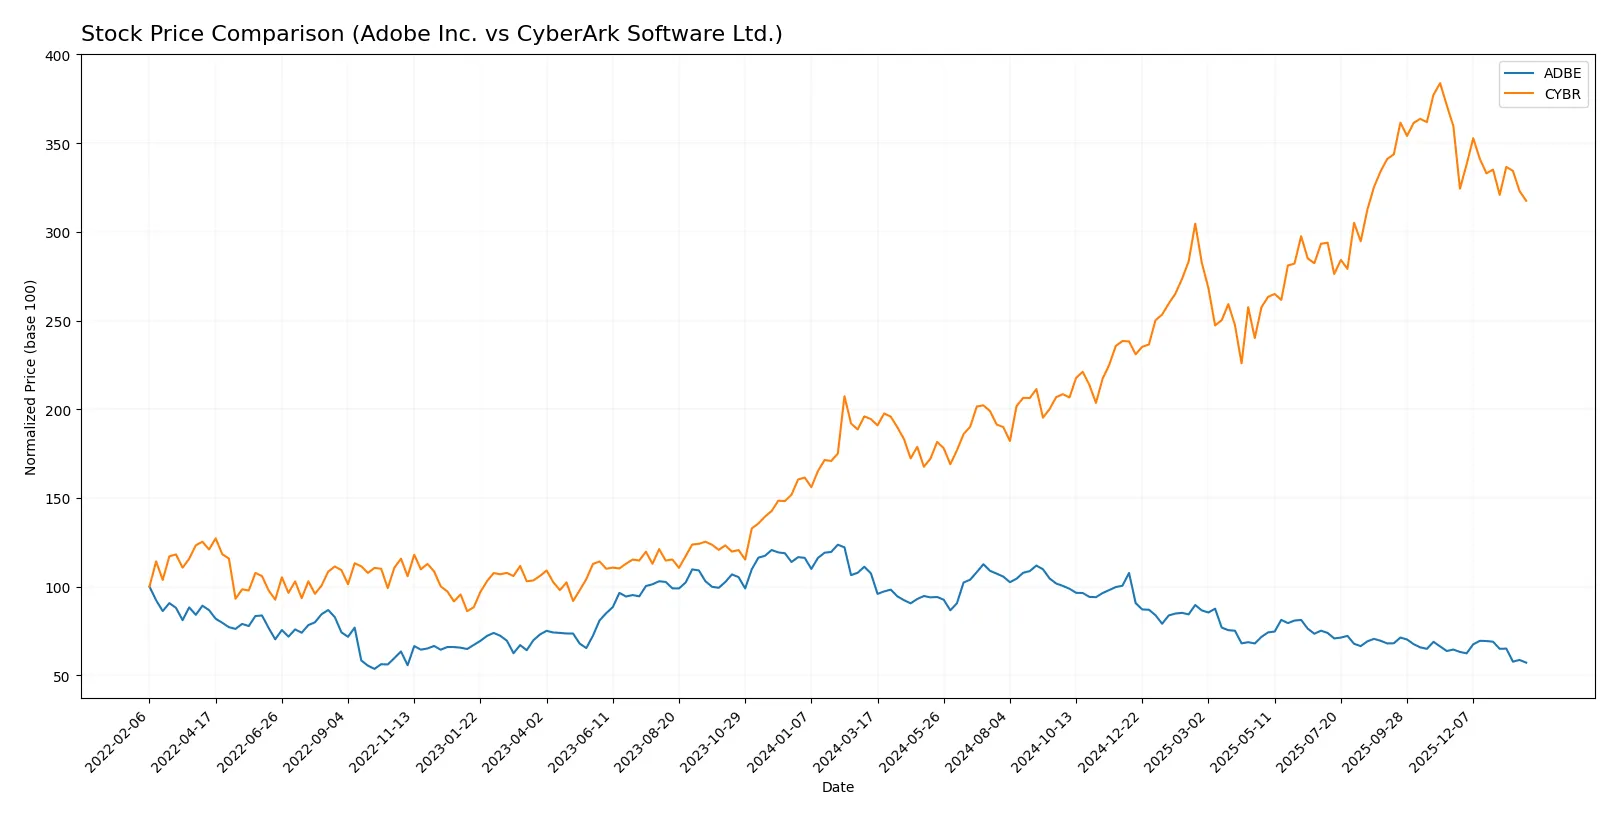
Trend Comparison
Adobe Inc.’s stock dropped 46.85% over the last 12 months, marking a bearish trend with decelerating losses. It hit a high of 578.34 and a low of 293.25.
CyberArk Software Ltd. gained 63.33% over the same period, showing a bullish trend with deceleration. It ranged between 227.32 and 520.78 before recent weakness.
Comparing trends, CyberArk delivered the highest market performance, outperforming Adobe’s significant price retreat over the past year.
Target Prices
Analysts present a robust target price consensus for Adobe Inc. and CyberArk Software Ltd., reflecting strong growth expectations.
| Company | Target Low | Target High | Consensus |
|---|---|---|---|
| Adobe Inc. | 280 | 500 | 390.31 |
| CyberArk Software Ltd. | 440 | 520 | 475.5 |
Adobe’s target consensus at 390.31 implies a significant upside from the current 293.25 stock price. CyberArk’s consensus target of 475.5 also suggests substantial growth potential from its 430.83 price.

Don’t Let Luck Decide Your Entry Point
Optimize your entry points with our advanced ProRealTime indicators. You’ll get efficient buy signals with precise price targets for maximum performance. Start outperforming now!
How do institutions grade them?
Adobe Inc. Grades
The following table summarizes recent institutional grades for Adobe Inc.:
| Grading Company | Action | New Grade | Date |
|---|---|---|---|
| UBS | Maintain | Neutral | 2026-01-26 |
| Oppenheimer | Downgrade | Perform | 2026-01-13 |
| BMO Capital | Downgrade | Market Perform | 2026-01-09 |
| Jefferies | Downgrade | Hold | 2026-01-05 |
| Citigroup | Maintain | Neutral | 2025-12-17 |
| BMO Capital | Maintain | Outperform | 2025-12-15 |
| Keybanc | Downgrade | Underweight | 2025-12-15 |
| Wolfe Research | Maintain | Outperform | 2025-12-11 |
| TD Cowen | Maintain | Hold | 2025-12-11 |
| Oppenheimer | Maintain | Outperform | 2025-12-11 |
CyberArk Software Ltd. Grades
Here is a summary of recent institutional grades for CyberArk Software Ltd.:
| Grading Company | Action | New Grade | Date |
|---|---|---|---|
| Oppenheimer | Maintain | Outperform | 2024-10-22 |
| Keybanc | Maintain | Overweight | 2024-10-18 |
| Mizuho | Maintain | Outperform | 2024-10-17 |
| BTIG | Maintain | Buy | 2024-10-09 |
| Barclays | Maintain | Overweight | 2024-10-07 |
| Wedbush | Maintain | Outperform | 2024-10-01 |
| Jefferies | Maintain | Buy | 2024-09-24 |
| DA Davidson | Maintain | Buy | 2024-08-09 |
| Rosenblatt | Maintain | Buy | 2024-08-09 |
| Susquehanna | Maintain | Positive | 2024-08-09 |
Which company has the best grades?
CyberArk Software Ltd. consistently maintains strong positive grades, mostly Buy and Outperform, with no downgrades. Adobe Inc. shows recent downgrades and more neutral or hold ratings. This contrast may influence investor sentiment and perceived momentum.
Risks specific to each company
The following categories identify the critical pressure points and systemic threats facing both firms in the 2026 market environment:
1. Market & Competition
Adobe Inc.
- Dominates broad software infrastructure with diversified segments and strong market cap of 123B. Faces intense competition in digital media and experience platforms.
CyberArk Software Ltd.
- Specializes in cybersecurity niche with 21.7B market cap. Faces fierce competition from larger security firms and rapid tech changes.
2. Capital Structure & Debt
Adobe Inc.
- Moderate leverage with debt-to-assets at 22.5%. Interest coverage very strong at 34x, signaling good debt management.
CyberArk Software Ltd.
- Minimal debt (debt-to-assets 0.9%) but negative interest coverage -3.27 signals poor ability to service debt from earnings.
3. Stock Volatility
Adobe Inc.
- High beta at 1.53 indicates above-market volatility, reflecting sensitivity to tech sector swings.
CyberArk Software Ltd.
- Lower beta at 0.92 shows below-market volatility, potentially less sensitive to broad market movements.
4. Regulatory & Legal
Adobe Inc.
- Operates globally, exposed to data privacy laws and digital content regulations.
CyberArk Software Ltd.
- Cybersecurity focus increases exposure to regulatory scrutiny on data protection and government contracts.
5. Supply Chain & Operations
Adobe Inc.
- Cloud-based subscription model reduces supply chain risks. Dependent on continuous innovation to retain users.
CyberArk Software Ltd.
- SaaS delivery model limits supply chain risks but relies heavily on cloud infrastructure stability and security.
6. ESG & Climate Transition
Adobe Inc.
- Strong ESG initiatives expected given large US footprint and investor focus on sustainability.
CyberArk Software Ltd.
- ESG risks moderate but growing, especially around data security and ethical use of AI and cloud services.
7. Geopolitical Exposure
Adobe Inc.
- US-based with global operations facing trade tensions, especially with China and EU data regulations.
CyberArk Software Ltd.
- Israel-based with significant US and global sales; geopolitical tensions in Middle East could pose risks.
Which company shows a better risk-adjusted profile?
Adobe’s biggest risk lies in market competition and high valuation multiples, yet it benefits from strong profitability and financial stability. CyberArk faces severe operational risks from poor profitability and negative interest coverage, despite low debt. Adobe’s Altman Z-score (8.1) vs. CyberArk’s (6.4) confirms stronger financial health. CyberArk’s weak Piotroski score (3 vs. Adobe’s 6) signals weaker fundamentals. Adobe’s diversified revenue and robust debt servicing present a superior risk-adjusted profile amid sector volatility.
Final Verdict: Which stock to choose?
Adobe Inc. wields unmatched efficiency as its superpower, consistently generating high returns on invested capital well above its cost of capital. Its main point of vigilance is the stretched valuation multiples and a barely adequate liquidity position. Adobe suits portfolios focused on long-term value creation with an appetite for moderate risk.
CyberArk Software Ltd. commands a strategic moat through its niche cybersecurity expertise and recurring revenue streams. It offers a safer balance sheet with lower leverage but currently struggles with profitability and declining returns on capital. CyberArk fits growth-at-a-reasonable-price (GARP) portfolios willing to tolerate operational volatility for potential market share gains.
If you prioritize durable competitive advantage and proven capital efficiency, Adobe outshines with superior profitability and financial strength. However, if you seek growth exposure with a focus on emerging cybersecurity trends and balance sheet conservatism, CyberArk offers better stability despite its current challenges. Both present distinct analytical scenarios for specific investor profiles.
Disclaimer: Investment carries a risk of loss of initial capital. The past performance is not a reliable indicator of future results. Be sure to understand risks before making an investment decision.
Go Further
I encourage you to read the complete analyses of Adobe Inc. and CyberArk Software Ltd. to enhance your investment decisions: