Home > Comparison > Technology > ADBE vs CPAY
The strategic rivalry between Adobe Inc. and Corpay, Inc. shapes the evolving landscape of the technology sector. Adobe operates as a diversified software powerhouse focused on creative and digital experience solutions. Corpay, in contrast, specializes in payment infrastructure serving global corporate and consumer markets. This analysis pits Adobe’s growth-oriented innovation against Corpay’s steady transactional model to identify the superior risk-adjusted opportunity for a diversified portfolio in 2026.

Table of contents
Companies Overview
Adobe Inc. and Corpay, Inc. stand as pivotal players in the software infrastructure market, each commanding distinct niches.
Adobe Inc.: Creative and Experience Software Leader
Adobe dominates the digital media and experience software space, generating revenue primarily through subscription services like Creative Cloud. In 2026, Adobe’s strategic focus centers on enhancing its integrated digital marketing and content creation platforms, targeting enterprises and creative professionals worldwide. This positions Adobe as a core enabler of digital transformation across industries.
Corpay, Inc.: Corporate Payments and Expense Management Specialist
Corpay specializes in corporate payment solutions and vehicle-related expense management, monetizing through transactional and subscription fees. Its 2026 strategy emphasizes expanding cross-border payment services and automation technologies, aiming to streamline business travel and fleet expense management globally. Corpay’s focus on operational efficiency supports its competitive edge in payment processing.
Strategic Collision: Similarities & Divergences
Both companies operate in software infrastructure but pursue divergent philosophies: Adobe builds a closed ecosystem focused on creative and marketing workflows, while Corpay offers open, transaction-driven platforms for payments. Their competition centers on enterprise software budgets, yet their distinct end markets reduce direct overlap. Adobe appeals to creative-centric investors; Corpay attracts those favoring fintech innovation and operational scale.
Income Statement Comparison
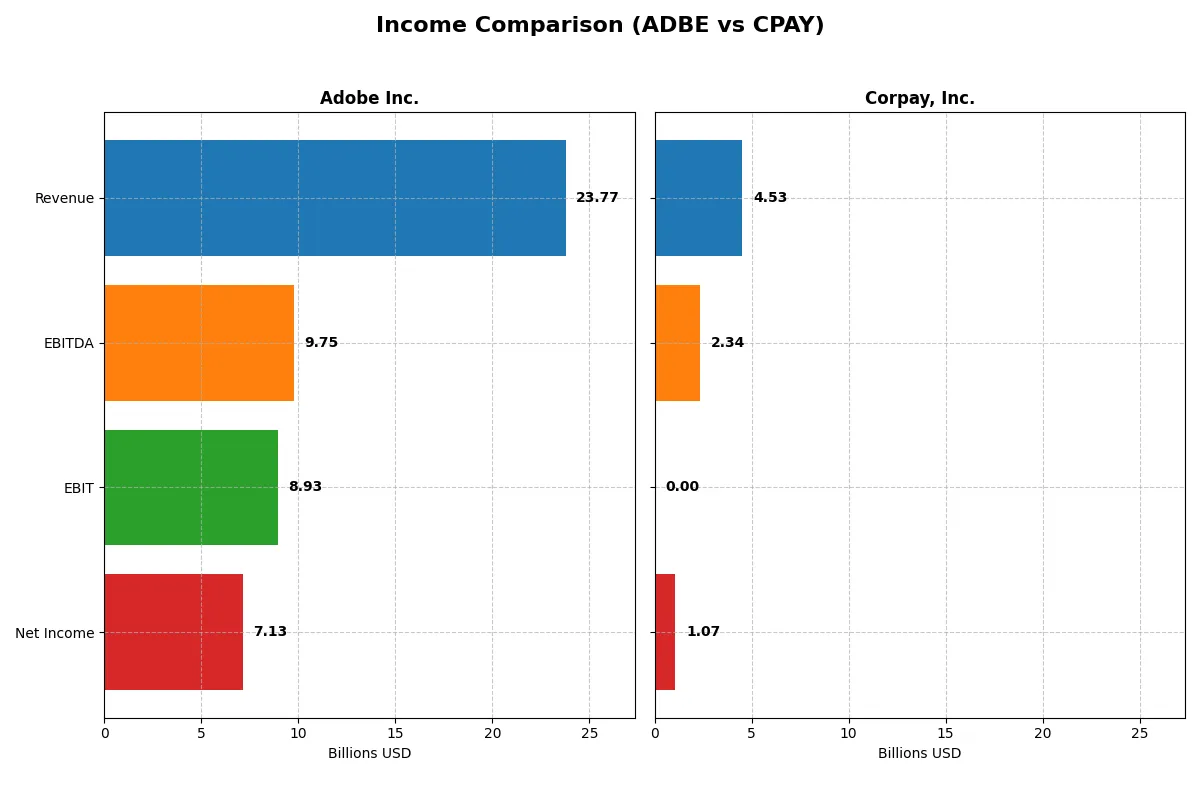
This data dissects the core profitability and scalability of both corporate engines to reveal who dominates the bottom line:
| Metric | Adobe Inc. (ADBE) | Corpay, Inc. (CPAY) |
|---|---|---|
| Revenue | 23.8B | 4.53B |
| Cost of Revenue | 2.71B | 0 |
| Operating Expenses | 12.4B | 2.53B |
| Gross Profit | 21.1B | 0 |
| EBITDA | 9.75B | 2.34B |
| EBIT | 8.93B | 0 |
| Interest Expense | 263M | 404M |
| Net Income | 7.13B | 1.07B |
| EPS | 16.73 | 15.03 |
| Fiscal Year | 2025 | 2025 |
Income Statement Analysis: The Bottom-Line Duel
This income statement comparison reveals how efficiently Adobe Inc. and Corpay, Inc. convert revenue into profit and sustain growth.
Adobe Inc. Analysis
Adobe’s revenue surged from 15.8B in 2021 to 23.8B in 2025, reflecting a 50.6% increase. Net income rose strongly to 7.13B in 2025, maintaining a robust 30% net margin. Its gross margin of 88.6% and EBIT margin of 37.6% highlight exceptional cost control and operational efficiency, signaling solid momentum.
Corpay, Inc. Analysis
Corpay’s revenue grew 59.8% from 2.8B in 2021 to 4.53B in 2025, outpacing Adobe’s top-line growth. However, it reported a 0% gross margin in 2025 and a net margin of 23.6%, indicating weaker profitability. Despite a 27.4% net income rise, its income statement shows unfavorable trends in gross profit and EBIT margins, raising concerns about cost structure.
Margin Excellence vs. Revenue Expansion
Adobe leads with superior profitability and margin stability, demonstrating disciplined cost management. Corpay grows faster top-line but struggles with profitability and margin compression. For investors prioritizing fundamental efficiency and margin resilience, Adobe presents a more attractive profile.
Financial Ratios Comparison
These vital ratios act as a diagnostic tool to expose the underlying fiscal health, valuation premiums, and capital efficiency of the companies compared below:
| Ratios | Adobe Inc. (ADBE) | Corpay, Inc. (CPAY) |
|---|---|---|
| ROE | 61.3% | 32.1% |
| ROIC | 36.7% | 10.8% |
| P/E | 19.1 | 23.7 |
| P/B | 11.7 | 7.6 |
| Current Ratio | 1.0 | 1.0 |
| Quick Ratio | 1.0 | 1.0 |
| D/E | 0.57 | 2.56 |
| Debt-to-Assets | 22.5% | 44.5% |
| Interest Coverage | 33.1 | 4.7 |
| Asset Turnover | 0.81 | 0.22 |
| Fixed Asset Turnover | 10.9 | 10.5 |
| Payout Ratio | 0% | 0% |
| Dividend Yield | 0% | 0% |
| Fiscal Year | 2025 | 2024 |
Efficiency & Valuation Duel: The Vital Signs
Financial ratios act as a company’s DNA, uncovering hidden risks and operational strengths that shape investor decisions.
Adobe Inc.
Adobe delivers exceptional profitability with a 61.34% ROE and a 30% net margin, signaling robust operational efficiency. Its P/E of 19.13 is fairly valued, neither stretched nor cheap. Despite no dividend payout, Adobe reinvests heavily in R&D (18% of revenue), fueling growth and shareholder value over time.
Corpay, Inc.
Corpay shows solid profitability with a 32.15% ROE and a 25.25% net margin, reflecting efficient core operations. The stock trades at a neutral P/E of 23.71 but bears higher leverage with a debt-to-equity ratio of 2.56. It pays no dividend, focusing instead on operational expansion amid tighter financial conditions.
Operational Excellence vs. Financial Risk
Adobe offers a stronger balance of profitability and valuation with favorable returns on equity and capital, supported by prudent reinvestment. Corpay’s higher leverage and weaker coverage ratios increase risk despite decent margins. Investors seeking stability and growth may prefer Adobe’s profile, while Corpay suits those tolerant of financial risk.
Which one offers the Superior Shareholder Reward?
I observe that neither Adobe Inc. (ADBE) nor Corpay, Inc. (CPAY) pays dividends. Both prioritize reinvestment and buyback strategies. Adobe shows zero dividend payout and yield, indicating full reliance on growth and buybacks. Corpay also pays no dividend but exhibits a heavier debt load and weaker cash metrics, raising sustainability concerns. Adobe’s free cash flow per share stands at $23.1, with strong buyback capacity, whereas Corpay’s free cash flow per share is $25.1, but with higher leverage. Adobe’s capital allocation favors long-term value with low debt-to-equity (0.57) and robust operating margins (~37%). Corpay’s payout comes mainly from buybacks funded by significant leverage (debt-to-equity ~2.56), which may pressure future returns. I conclude Adobe offers a more sustainable and superior total return profile for 2026 investors, balancing growth and prudent capital deployment.
Comparative Score Analysis: The Strategic Profile
The radar chart reveals the fundamental DNA and trade-offs of Adobe Inc. and Corpay, Inc., highlighting strengths in profitability and valuation metrics:
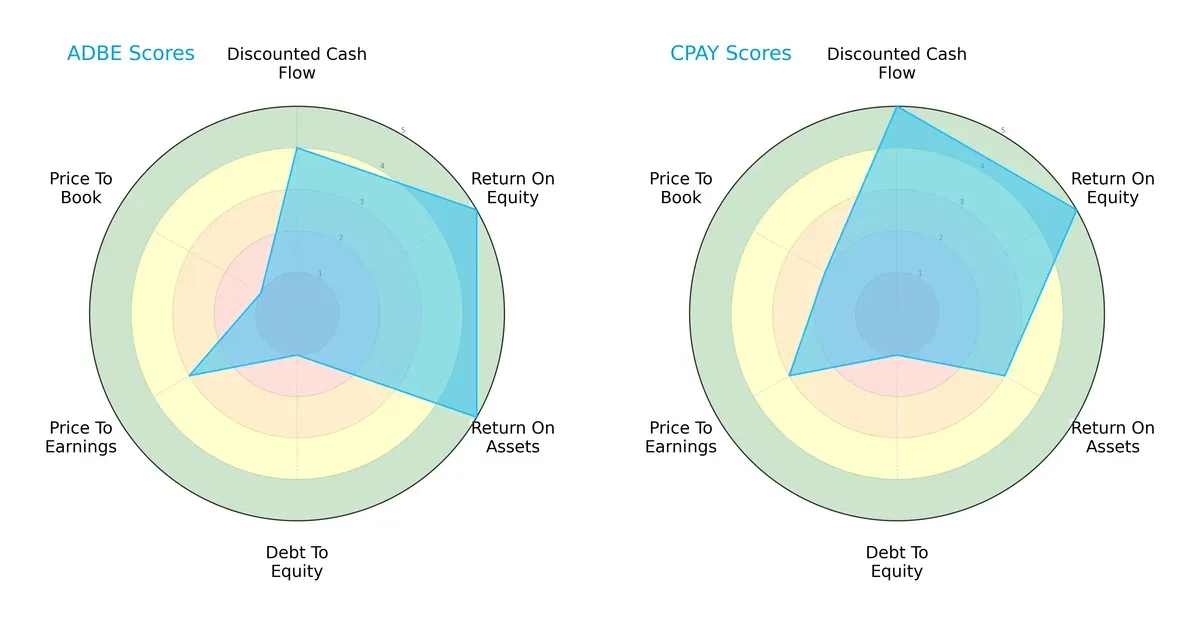
Adobe and Corpay share strong overall scores but differ in key areas. Adobe excels in ROA and ROE with top marks (5), signaling superior asset efficiency and shareholder returns. Corpay leads in discounted cash flow with a score of 5, indicating better valuation on future earnings. Both struggle with debt-to-equity (score 1), reflecting high leverage risk. Corpay’s price-to-book ratio is slightly more attractive (score 2 vs. 1), suggesting modestly better market valuation balance. Adobe’s profile is more asset-efficient; Corpay relies on cash flow valuation.
Bankruptcy Risk: Solvency Showdown
Adobe’s Altman Z-Score at 7.78 places it firmly in the safe zone, while Corpay’s 2.11 puts it in the grey zone, signaling moderate bankruptcy risk in this cycle:
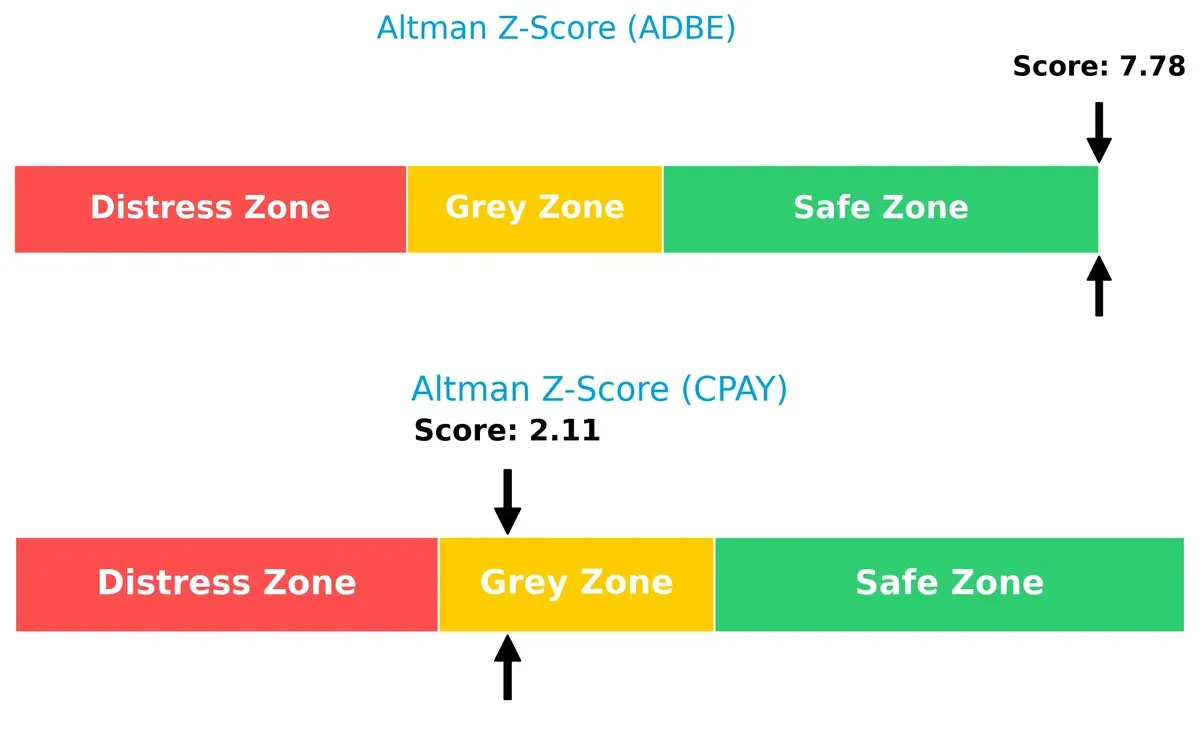
Adobe’s superior solvency dramatically lowers its long-term default risk. Corpay’s position near the grey zone warns investors to monitor financial stability closely as economic headwinds intensify.
Financial Health: Quality of Operations
Adobe’s Piotroski F-Score of 6 edges out Corpay’s 5, indicating marginally stronger financial health and operational quality:
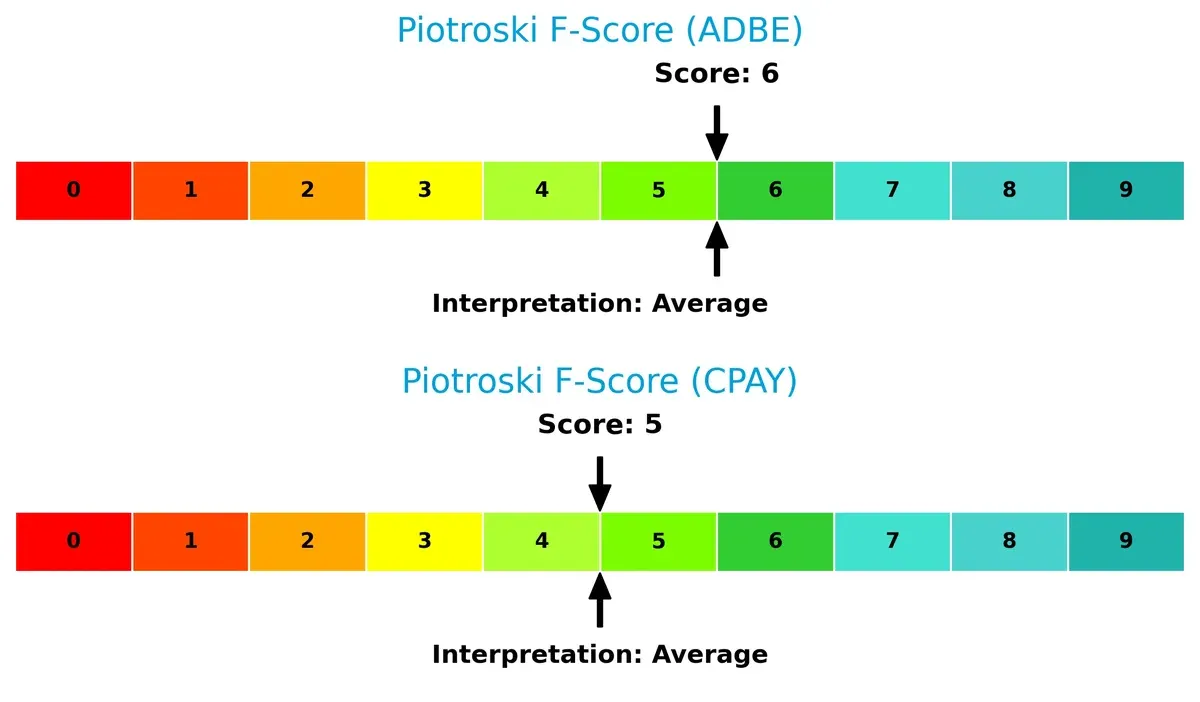
Both companies show average internal metrics without red flags, but Adobe’s higher score reflects better profitability, liquidity, and efficiency balance. Corpay’s slightly lower score suggests room for improvement in financial discipline and operational execution.
How are the two companies positioned?
This section dissects Adobe and Corpay’s operational DNA by comparing revenue distribution by segment and analyzing their internal strengths and weaknesses. The goal is to confront their economic moats to identify which business model delivers the most resilient, sustainable competitive advantage today.
Revenue Segmentation: The Strategic Mix
This visual comparison dissects how Adobe Inc. and Corpay, Inc. diversify their income streams and where their primary sector bets lie:
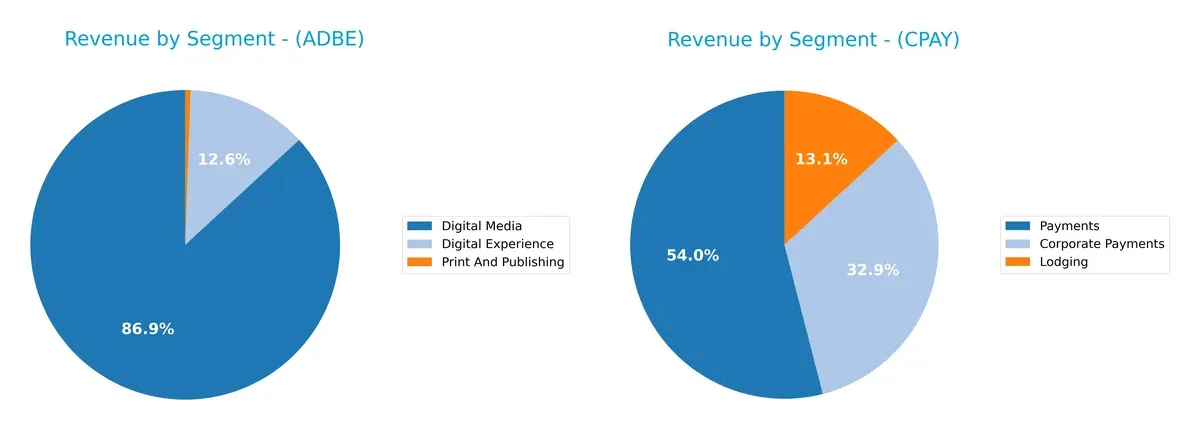
Adobe’s revenue pivots heavily on Digital Media, generating $40.4B in 2025, dwarfing its other segments. Digital Experience contributes $5.9B, while Print and Publishing lags at $256M. Corpay shows a more balanced mix, anchoring on Payments with $2B, followed by Corporate Payments at $1.2B and Lodging at $489M. Adobe’s concentration in digital software signals ecosystem lock-in risk, while Corpay’s diversified payments portfolio mitigates reliance on a single segment.
Strengths and Weaknesses Comparison
This table compares the Strengths and Weaknesses of Adobe Inc. and Corpay, Inc.:
Adobe Inc. Strengths
- High net margin of 30% indicating strong profitability
- ROE at 61.34% reflects excellent shareholder returns
- Favorable ROIC at 36.69% well above WACC
- Diversified revenue streams in Digital Media and Digital Experience
- Solid global presence with strong Americas and EMEA sales
Corpay, Inc. Strengths
- Positive net margin of 25.25% showing profitability
- Reasonable ROE at 32.15% indicating decent returns
- Favorable fixed asset turnover at 10.52
- Product segmentation includes Corporate Payments and Lodging
- Geographic reach includes major markets like US, UK, and Brazil
Adobe Inc. Weaknesses
- WACC at 10.57% is high, reducing capital efficiency
- Price-to-book ratio at 11.73 signals potential overvaluation
- Current ratio at 1.0 is low, indicating tight liquidity
- No dividend yield, missing income investor appeal
Corpay, Inc. Weaknesses
- Missing ROIC and WACC data limits capital efficiency assessment
- High debt-to-equity ratio of 2.56 signals financial leverage risk
- Interest coverage at zero raises solvency concerns
- Low asset turnover of 0.22 implies less efficient use of assets
- No dividend yield, limiting income return
Adobe’s strengths lie in robust profitability and diversified global revenue. Corpay shows solid profitability but faces financial leverage and liquidity challenges. These factors influence each company’s strategic focus on capital management and growth opportunities.
The Moat Duel: Analyzing Competitive Defensibility
A structural moat stands as the sole barrier protecting long-term profits from relentless competition erosion. Let’s examine the moats at:
Adobe Inc.: Intangible Assets and Ecosystem Lock-in
Adobe’s moat centers on powerful intangible assets and ecosystem lock-in via Creative Cloud subscriptions. This drives high ROIC (26% above WACC) and margin stability (~30% net margin). Expansion into AI-enhanced digital experiences deepens Adobe’s defensibility in 2026.
Corpay, Inc.: Cost Advantage and Payment Network Reach
Corpay primarily leverages cost advantage and extensive payment network reach, focusing on vehicle and corporate payments. Its competitive position is less clear; margin volatility and missing ROIC vs. WACC data cloud the moat’s strength. Expansion into cross-border solutions offers growth but also faces disruption risks.
Verdict: Intangible Assets vs. Network Cost Efficiency
Adobe’s moat is deeper and more durable, backed by very favorable ROIC trends and diverse revenue streams. Corpay’s moat is narrower and more vulnerable without clear value creation metrics. Adobe stands better equipped to defend and grow its market share in 2026.
Which stock offers better returns?
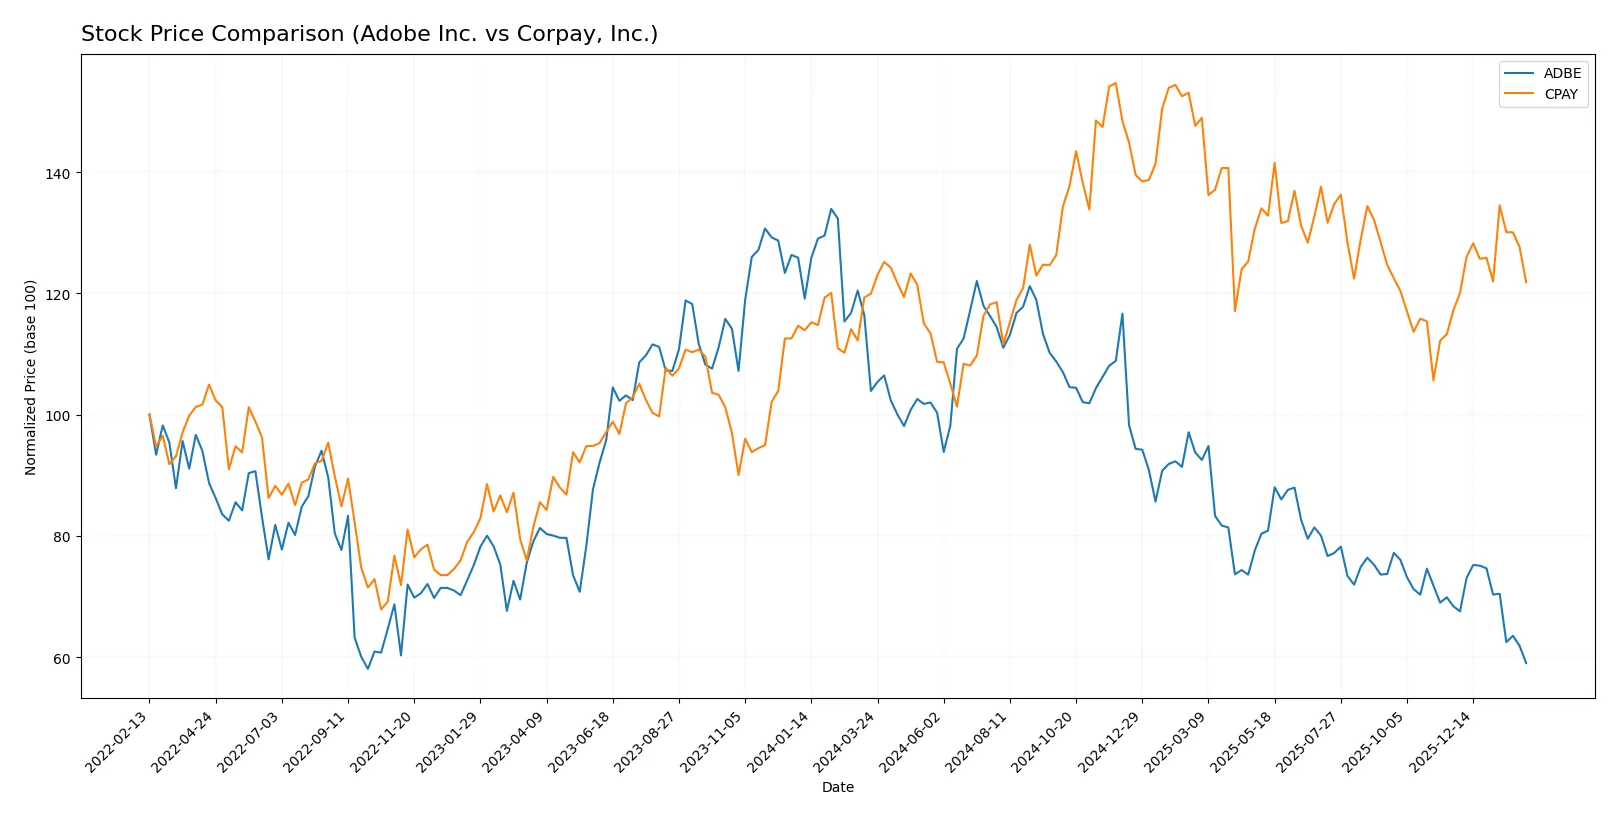
The past year shows divergent price paths: Adobe Inc. faces a steep decline, while Corpay, Inc. registers mild gains and accelerating momentum.
Trend Comparison
Adobe Inc. suffers a bearish trend with a -43.2% price drop over 12 months. The decline shows deceleration, with a recent -13.72% slide and high volatility (79.05 std dev). The stock peaked at 578.34 and troughed at 279.71.
Corpay, Inc. posts a slight bullish trend with a 1.57% gain over 12 months. The trend accelerates, supported by a recent 3.97% rise and moderate volatility (31.07 std dev). Its price ranges between 249.66 and 381.18.
Comparing trends, Corpay outperforms Adobe in market returns. Adobe’s sharp bearish trend contrasts with Corpay’s modest but accelerating bullish momentum.
Target Prices
Analysts present a bullish consensus for Adobe Inc. and Corpay, Inc., indicating substantial upside from current prices.
| Company | Target Low | Target High | Consensus |
|---|---|---|---|
| Adobe Inc. | 280 | 500 | 386.76 |
| Corpay, Inc. | 300 | 392 | 367.2 |
The consensus target price for Adobe exceeds its current 280 price, signaling analyst confidence in growth. Corpay’s target consensus also suggests a moderate premium above its 300 price, reflecting positive market expectations.

Don’t Let Luck Decide Your Entry Point
Optimize your entry points with our advanced ProRealTime indicators. You’ll get efficient buy signals with precise price targets for maximum performance. Start outperforming now!
How do institutions grade them?
This section compares recent institutional grades for Adobe Inc. and Corpay, Inc.:
Adobe Inc. Grades
Here are the latest grades from reputable financial institutions for Adobe Inc.:
| Grading Company | Action | New Grade | Date |
|---|---|---|---|
| Piper Sandler | Downgrade | Neutral | 2026-02-03 |
| UBS | Maintain | Neutral | 2026-01-26 |
| Oppenheimer | Downgrade | Perform | 2026-01-13 |
| BMO Capital | Downgrade | Market Perform | 2026-01-09 |
| Jefferies | Downgrade | Hold | 2026-01-05 |
| Citigroup | Maintain | Neutral | 2025-12-17 |
| BMO Capital | Maintain | Outperform | 2025-12-15 |
| Keybanc | Downgrade | Underweight | 2025-12-15 |
| Morgan Stanley | Maintain | Equal Weight | 2025-12-11 |
| Oppenheimer | Maintain | Outperform | 2025-12-11 |
Corpay, Inc. Grades
The following table shows the recent grades for Corpay, Inc. from established grading firms:
| Grading Company | Action | New Grade | Date |
|---|---|---|---|
| Morgan Stanley | Upgrade | Overweight | 2026-01-26 |
| Oppenheimer | Maintain | Outperform | 2026-01-12 |
| Oppenheimer | Upgrade | Outperform | 2025-12-05 |
| JP Morgan | Maintain | Overweight | 2025-11-06 |
| RBC Capital | Maintain | Sector Perform | 2025-11-06 |
| UBS | Maintain | Neutral | 2025-11-06 |
| Keefe, Bruyette & Woods | Maintain | Outperform | 2025-10-01 |
| Morgan Stanley | Maintain | Equal Weight | 2025-08-11 |
| UBS | Maintain | Neutral | 2025-08-07 |
| Raymond James | Maintain | Outperform | 2025-08-07 |
Which company has the best grades?
Corpay, Inc. consistently holds higher ranks such as Overweight and Outperform. Adobe shows mostly Neutral and Downgrade actions. Investors might view Corpay’s grades as a stronger vote of confidence.
Risks specific to each company
The following categories identify the critical pressure points and systemic threats facing both firms in the 2026 market environment:
1. Market & Competition
Adobe Inc.
- Operates in highly competitive software infrastructure with strong digital media and experience segments.
Corpay, Inc.
- Faces competition in payments and corporate expense management across multiple regions and verticals.
2. Capital Structure & Debt
Adobe Inc.
- Moderate debt-to-equity ratio (0.57) with strong interest coverage (33.96).
Corpay, Inc.
- High leverage (D/E 2.56) and zero interest coverage signal tight financial risk.
3. Stock Volatility
Adobe Inc.
- Beta of 1.515 indicates higher volatility relative to the market.
Corpay, Inc.
- Lower beta of 0.808 suggests less sensitivity to market swings.
4. Regulatory & Legal
Adobe Inc.
- Subject to data privacy and software licensing regulations globally.
Corpay, Inc.
- Exposed to cross-border payments regulation and compliance complexities.
5. Supply Chain & Operations
Adobe Inc.
- Relies on digital infrastructure and cloud services; operational risks include service outages.
Corpay, Inc.
- Dependent on payment networks and vendor relationships; operational disruptions could impact cash flow.
6. ESG & Climate Transition
Adobe Inc.
- Increasing focus on sustainable practices within tech sector; moderate ESG risks.
Corpay, Inc.
- Faces ESG risks linked to travel, transportation, and payment industries.
7. Geopolitical Exposure
Adobe Inc.
- Global software distribution exposes it to trade tensions and export controls.
Corpay, Inc.
- International payments business vulnerable to geopolitical instability and currency fluctuations.
Which company shows a better risk-adjusted profile?
Adobe’s strongest risk lies in market competition and stock volatility due to its high beta. Corpay’s critical risk is its capital structure, marked by heavy debt and zero interest coverage. Adobe’s Altman Z-Score (7.78, safe zone) far outpaces Corpay’s (2.11, grey zone), indicating superior financial stability. I observe Corpay’s deteriorating interest coverage as a red flag, while Adobe maintains robust operating metrics despite higher market sensitivity. Overall, Adobe offers a more balanced risk-adjusted profile in 2026.
Final Verdict: Which stock to choose?
Adobe Inc. (ADBE) wields a formidable superpower in its highly efficient capital allocation and robust economic moat. Its sustained high ROIC far above WACC signals consistent value creation. The point of vigilance lies in its stretched balance sheet, particularly the low current ratio, which could pose liquidity challenges. Adobe suits an aggressive growth portfolio seeking durable profitability and market leadership.
Corpay, Inc. (CPAY) leverages a strategic moat rooted in niche market positioning and steady revenue streams, albeit with less financial stability than Adobe. Its higher leverage and weaker liquidity metrics suggest greater risk but also potential for outsized returns. Corpay could fit a GARP portfolio where investors tolerate volatility for growth at a reasonable price.
If you prioritize resilient value creation and operational efficiency, Adobe outshines with its proven track record and safer capital structure. However, if you seek growth exposure with a higher risk appetite and believe in Corpay’s market niche, it offers better upside potential despite financial headwinds. Each choice reflects a distinct investor profile balancing stability against speculative growth.
Disclaimer: Investment carries a risk of loss of initial capital. The past performance is not a reliable indicator of future results. Be sure to understand risks before making an investment decision.
Go Further
I encourage you to read the complete analyses of Adobe Inc. and Corpay, Inc. to enhance your investment decisions: