Home > Comparison > Technology > ADBE vs CRWV
The strategic rivalry between Adobe Inc. and CoreWeave, Inc. defines the current trajectory of the technology sector. Adobe, a market-leading software infrastructure giant, leverages diversified digital media and experience platforms. CoreWeave, a high-growth cloud infrastructure provider, specializes in GPU-accelerated compute for AI workloads. This analysis pits established scale against emerging innovation to identify which corporate strategy offers superior risk-adjusted returns for a diversified portfolio.
Table of contents
Companies Overview
Adobe Inc. and CoreWeave, Inc. represent distinct pillars in the software infrastructure market, each commanding significant influence in their niches.
Adobe Inc.: Leader in Creative and Digital Experience Software
Adobe drives revenue through its Creative Cloud subscription, serving content creators and enterprises worldwide. Its diversified portfolio spans Digital Media, Digital Experience, and Publishing segments. In 2026, Adobe focuses on expanding cloud-based document services and integrated customer experience platforms, reinforcing its dominant position in digital content creation and marketing ecosystems.
CoreWeave, Inc.: Emerging Cloud Platform for GenAI and Compute Workloads
CoreWeave operates a specialized cloud infrastructure targeting GPU and CPU compute needs for AI and VFX workloads. Its platform supports scalable AI model training and rendering services. In 2026, CoreWeave emphasizes accelerating generative AI adoption through managed services and innovative lifecycle controllers, carving a niche in high-performance cloud computing.
Strategic Collision: Similarities & Divergences
Adobe champions a subscription-based software ecosystem focused on creative and marketing workflows. CoreWeave builds an open, scalable cloud infrastructure for compute-intensive AI tasks. They compete indirectly; Adobe targets end-user productivity software while CoreWeave targets backend AI infrastructure. Their investment profiles diverge sharply—Adobe offers stability through diversified digital media, CoreWeave presents high growth potential amid AI infrastructure demand.
Income Statement Comparison
The following data dissects the core profitability and scalability of both corporate engines to reveal who dominates the bottom line:
| Metric | Adobe Inc. (ADBE) | CoreWeave, Inc. Class A Common Stock (CRWV) |
|---|---|---|
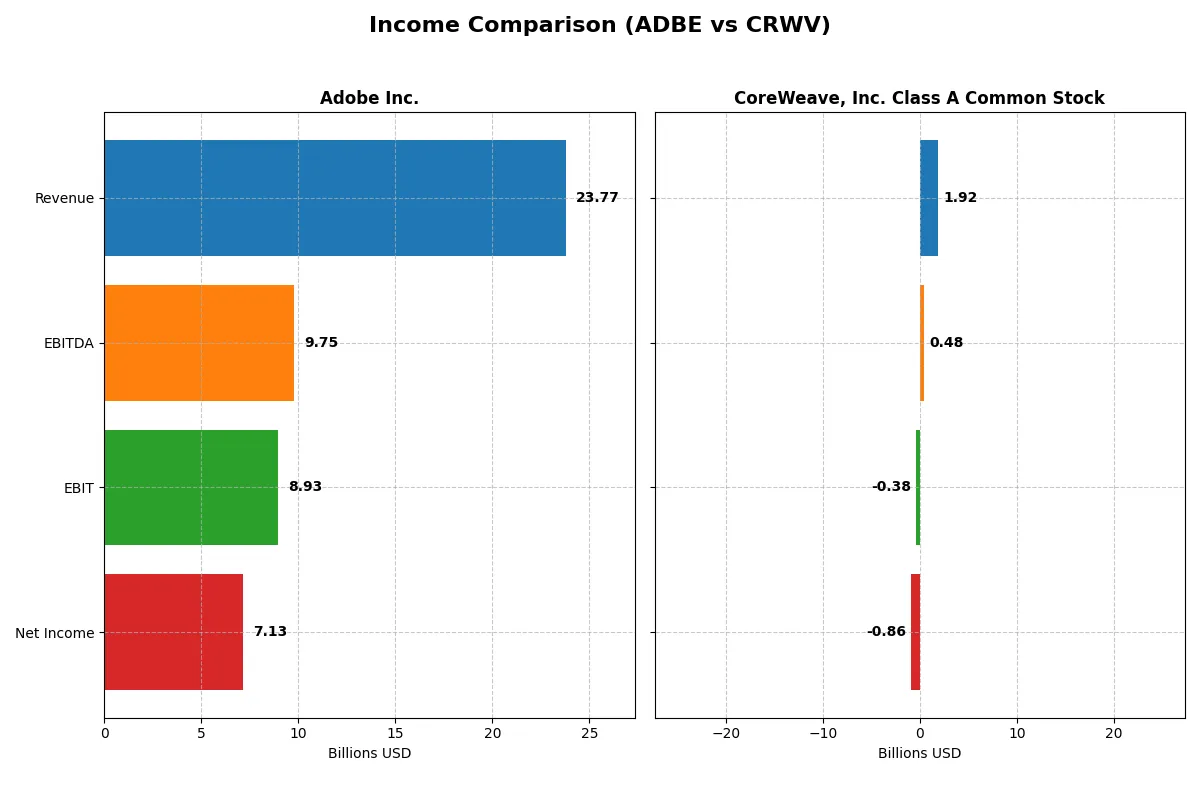
| Revenue | 23.8B | 1.9B |
| Cost of Revenue | 2.7B | 493M |
| Operating Expenses | 12.4B | 1.1B |
| Gross Profit | 21.1B | 1.4B |
| EBITDA | 9.7B | 480M |
| EBIT | 8.9B | -383M |
| Interest Expense | 263M | 361M |
| Net Income | 7.1B | -863M |
| EPS | 16.73 | -2.33 |
| Fiscal Year | 2025 | 2024 |
Income Statement Analysis: The Bottom-Line Duel
This income statement comparison reveals the true efficiency and profitability engines powering Adobe Inc. and CoreWeave, Inc.
Adobe Inc. Analysis
Adobe’s revenue rose steadily from 15.8B in 2021 to 23.8B in 2025, with net income climbing from 4.8B to 7.1B. The company sustains a robust gross margin above 88%, with a strong net margin of 30% in 2025. Efficiency gains are evident as EBIT margin improves to 37.6%, signaling improving operational leverage and solid momentum.
CoreWeave, Inc. Analysis
CoreWeave’s revenue surged dramatically from 23M in 2023 to 1.9B in 2024, yet net losses deepened to -863M in 2024. Despite a favorable gross margin of 74%, the company struggles with negative EBIT and net margins (-20% and -45%). Rapid growth drives improving EBIT but persistent high interest expense and operating losses reflect ongoing profitability challenges.
Margin Strength vs. High Growth Struggles
Adobe dominates with consistent revenue and profit growth, showcasing superior margin control and operational efficiency. CoreWeave impresses with explosive revenue expansion but endures heavy losses and negative margins. For investors, Adobe’s proven profitability profile offers greater stability, while CoreWeave’s high-growth, high-risk model demands cautious scrutiny.
Financial Ratios Comparison
These vital ratios act as a diagnostic tool to expose the underlying fiscal health, valuation premiums, and capital efficiency of the companies compared below:
| Ratios | Adobe Inc. (ADBE) | CoreWeave, Inc. Class A Common Stock (CRWV) |
|---|---|---|
| ROE | 61.3% | 208.8% |
| ROIC | 36.7% | 2.1% |
| P/E | 19.1 | -18.7 |
| P/B | 11.7 | -39.1 |
| Current Ratio | 1.0 | 0.39 |
| Quick Ratio | 1.0 | 0.39 |
| D/E | 0.57 | -25.7 |
| Debt-to-Assets | 22.5% | 59.6% |
| Interest Coverage | 33.1 | 0.90 |
| Asset Turnover | 0.81 | 0.11 |
| Fixed Asset Turnover | 10.9 | 0.13 |
| Payout ratio | 0 | -6.7% |
| Dividend yield | 0 | 0.36% |
| Fiscal Year | 2025 | 2024 |
Efficiency & Valuation Duel: The Vital Signs
Financial ratios act as a company’s DNA, exposing hidden risks and revealing operational excellence critical for investment decisions.
Adobe Inc.
Adobe exhibits robust profitability with a 61% ROE and a 30% net margin, signaling strong operational efficiency. Its P/E ratio of 19.13 suggests a fairly valued stock, neither cheap nor stretched. Adobe retains earnings for growth, investing heavily in R&D at 18% of revenue, favoring long-term innovation over dividends.
CoreWeave, Inc. Class A Common Stock
CoreWeave shows a striking 209% ROE but suffers a -45% net margin, reflecting volatile profitability and operational challenges. Despite a negative P/E, valuation metrics appear distorted by losses. The company operates with a weak current ratio of 0.39 and reinvests cash flows into capital expenditure rather than shareholder returns, indicating a growth-focused but risky profile.
Premium Valuation vs. Operational Safety
Adobe offers a balanced profile with strong profitability and sensible valuation, supporting sustainable growth. CoreWeave, while showing high ROE, struggles with profitability and liquidity, increasing investment risk. Investors seeking operational safety may lean toward Adobe; those targeting speculative growth might consider CoreWeave’s high-risk, high-reward profile.
Which one offers the Superior Shareholder Reward?
I compare Adobe Inc. (ADBE) and CoreWeave, Inc. (CRWV) on their shareholder reward strategies. Adobe pays no dividends but generates strong free cash flow (23.1/share in 2025) and executes disciplined buybacks, supporting sustainable capital returns. CoreWeave offers a low 0.36% dividend yield but delivers negative free cash flow (-14.7/share) and weak profitability, signaling risky distribution. Adobe’s zero payout ratio and robust buybacks align with long-term value creation. CoreWeave’s debt-heavy, negative margins and minimal buybacks undermine sustainable returns. I conclude Adobe offers a superior total return profile for investors in 2026.
Comparative Score Analysis: The Strategic Profile
The radar chart reveals the fundamental DNA and trade-offs of Adobe Inc. and CoreWeave, Inc., highlighting their competitive edges and vulnerabilities:
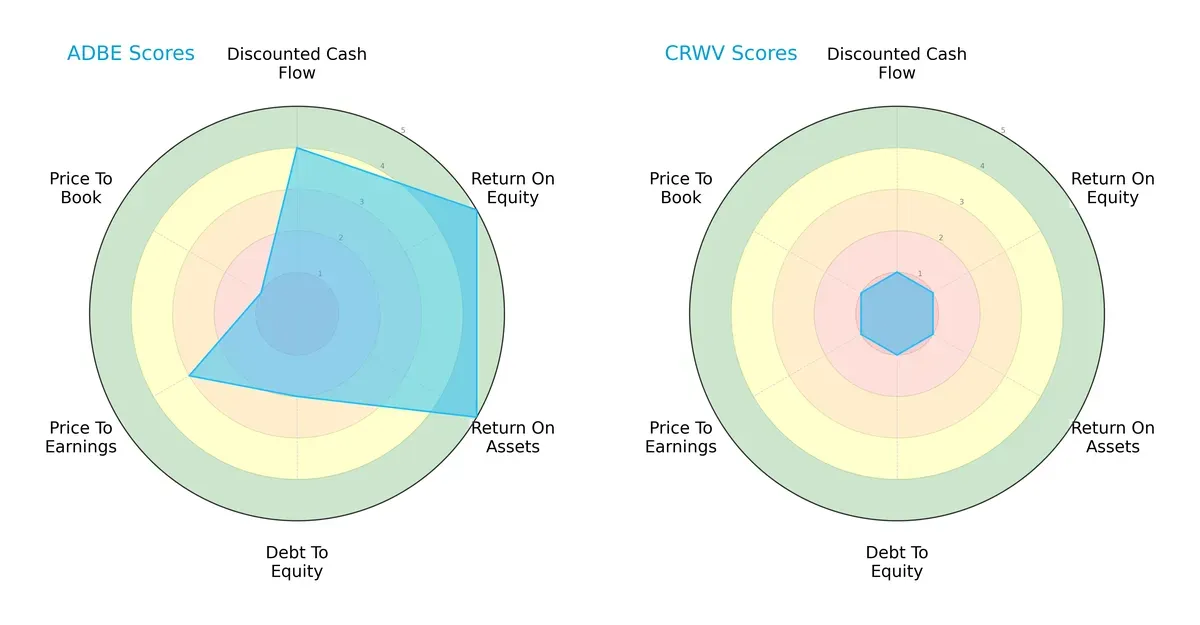
Adobe dominates in profitability and asset efficiency, reflected in top ROE and ROA scores of 5 each. It maintains a moderate debt profile (score 2) but suffers from poor price-to-book valuation (score 1), signaling market skepticism despite strong fundamentals. CoreWeave shows uniformly weak scores across all metrics, indicating a lack of operational strength and financial stability. Adobe’s profile is well-balanced, leveraging diverse strengths, while CoreWeave relies on no specific edge and faces significant challenges.
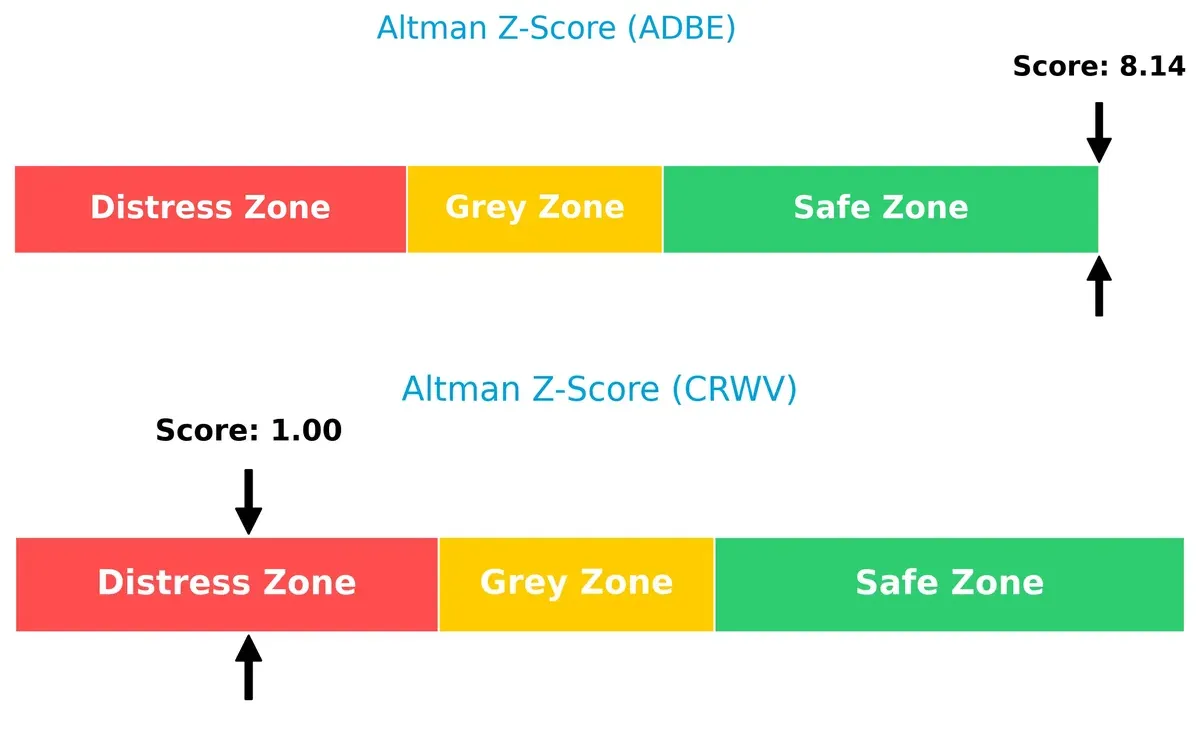
Bankruptcy Risk: Solvency Showdown
Adobe’s Altman Z-Score of 8.14 places it firmly in the safe zone, signaling robust long-term solvency. CoreWeave scores 1.00, deep in the distress zone, implying a high bankruptcy risk in this market cycle:
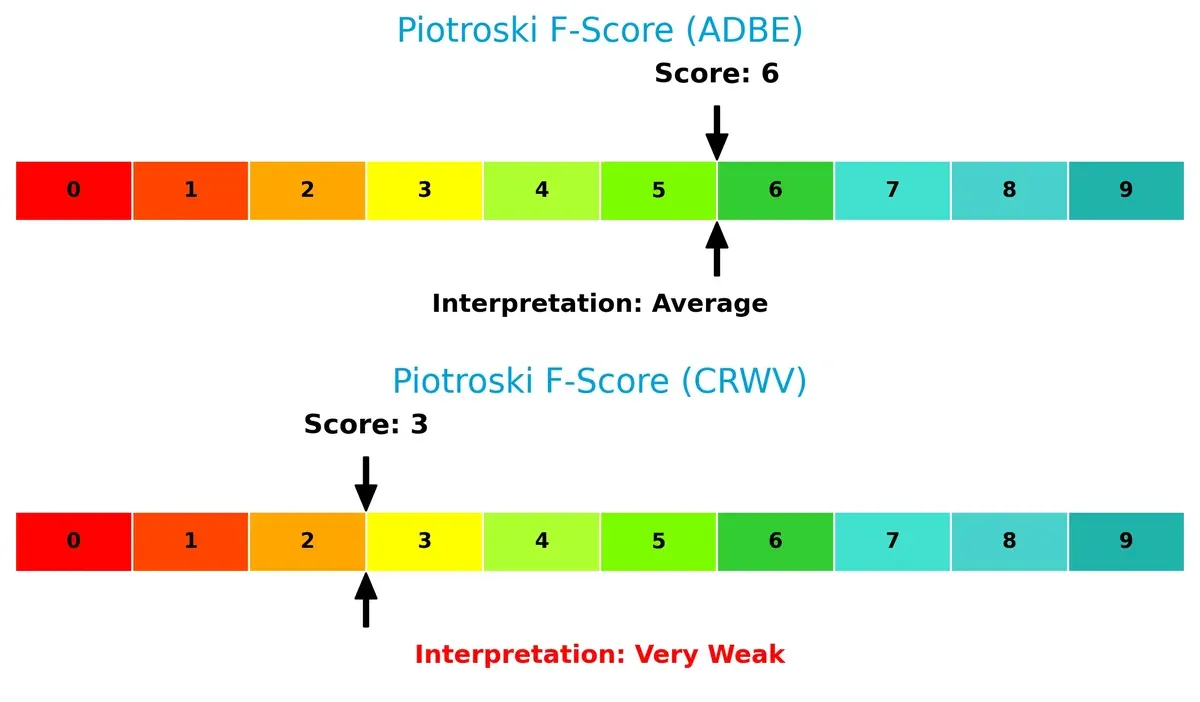
Financial Health: Quality of Operations
Adobe’s Piotroski F-Score of 6 suggests solid financial health with room for improvement. CoreWeave’s low score of 3 signals red flags in profitability and internal metrics, raising concerns about operational quality and value preservation:
How are the two companies positioned?
This section dissects the operational DNA of Adobe and CoreWeave by comparing their revenue distribution and internal dynamics. The goal is to confront their economic moats to identify which model offers the most resilient competitive advantage today.
Revenue Segmentation: The Strategic Mix
The following visual comparison dissects how Adobe Inc. and CoreWeave, Inc. Class A diversify their income streams and where their primary sector bets lie:
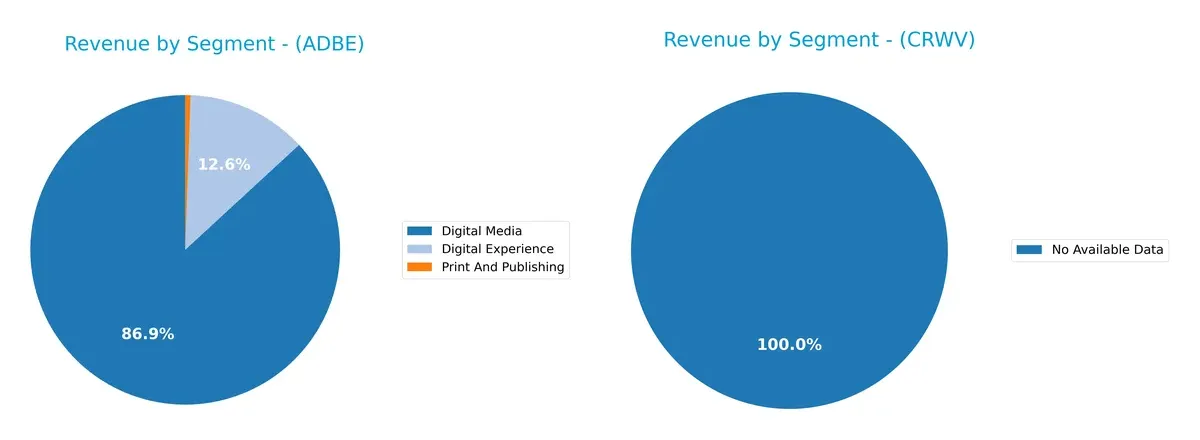
Adobe Inc. anchors its revenue in Digital Media, generating $40.4B in 2025, dwarfing its Digital Experience segment at $5.9B. Print and Publishing remains marginal at $256M. CoreWeave lacks available segmentation data, which raises transparency concerns. Adobe’s concentrated Digital Media dominance signals a strong ecosystem lock-in but also exposes it to sector-specific risks, unlike a more diversified portfolio.
Strengths and Weaknesses Comparison
This table compares the Strengths and Weaknesses of Adobe Inc. and CoreWeave, Inc. Class A Common Stock:
Adobe Inc. Strengths
- Strong profitability with 30% net margin
- High ROE at 61.34%
- Favorable ROIC at 36.69%
- Low debt-to-assets at 22.54%
- High interest coverage ratio at 33.96
- Significant global presence in Americas and EMEA
CoreWeave, Inc. Strengths
- Exceptionally high ROE at 208.77%
- Favorable P/E and P/B ratios despite losses
- Negative debt-to-equity indicating low or negative debt burden
Adobe Inc. Weaknesses
- Unfavorable WACC at 10.6%
- High price-to-book ratio at 11.73
- Low current ratio of 1.0 indicating liquidity risk
- No dividend yield
- Moderate asset turnover at 0.81
CoreWeave, Inc. Weaknesses
- Negative net margin at -45.08%
- Unfavorable ROIC at 2.08%
- Very high WACC at 83.48%
- Poor liquidity ratios below 0.4
- High debt-to-assets at 59.56%
- Negative interest coverage and low asset turnover
Adobe’s strengths lie in robust profitability, solid capital structure, and strong global reach. CoreWeave shows strengths in return on equity and valuation metrics but faces significant profitability, liquidity, and capital cost challenges. These contrasts highlight Adobe’s operational efficiency versus CoreWeave’s early-stage financial risks.
The Moat Duel: Analyzing Competitive Defensibility
A structural moat is the only reliable barrier protecting long-term profits from relentless competition erosion:
Adobe Inc.: Intangible Assets Fortifying Creative Dominance
Adobe’s moat centers on its powerful brand and subscription-based Creative Cloud ecosystem. This generates sustained high ROIC near 26% and margin stability above 30%. Its expanding digital experience platform in 2026 could deepen this advantage.
CoreWeave, Inc.: Emerging Cost Advantage in AI Infrastructure
CoreWeave competes with a focus on scalable GPU cloud infrastructure, contrasting Adobe’s established brand moat. Despite explosive 737% revenue growth, it posts negative margins and ROIC, reflecting a fragile position. Expansion in GenAI workloads offers growth but risks persist.
Creative Cloud Ecosystem vs. GPU Infrastructure Scale
Adobe’s durable, growing ROIC and entrenched intangible assets create a wider moat than CoreWeave’s nascent, loss-making cost advantage. Adobe is better equipped to defend market share amid intensifying competition.
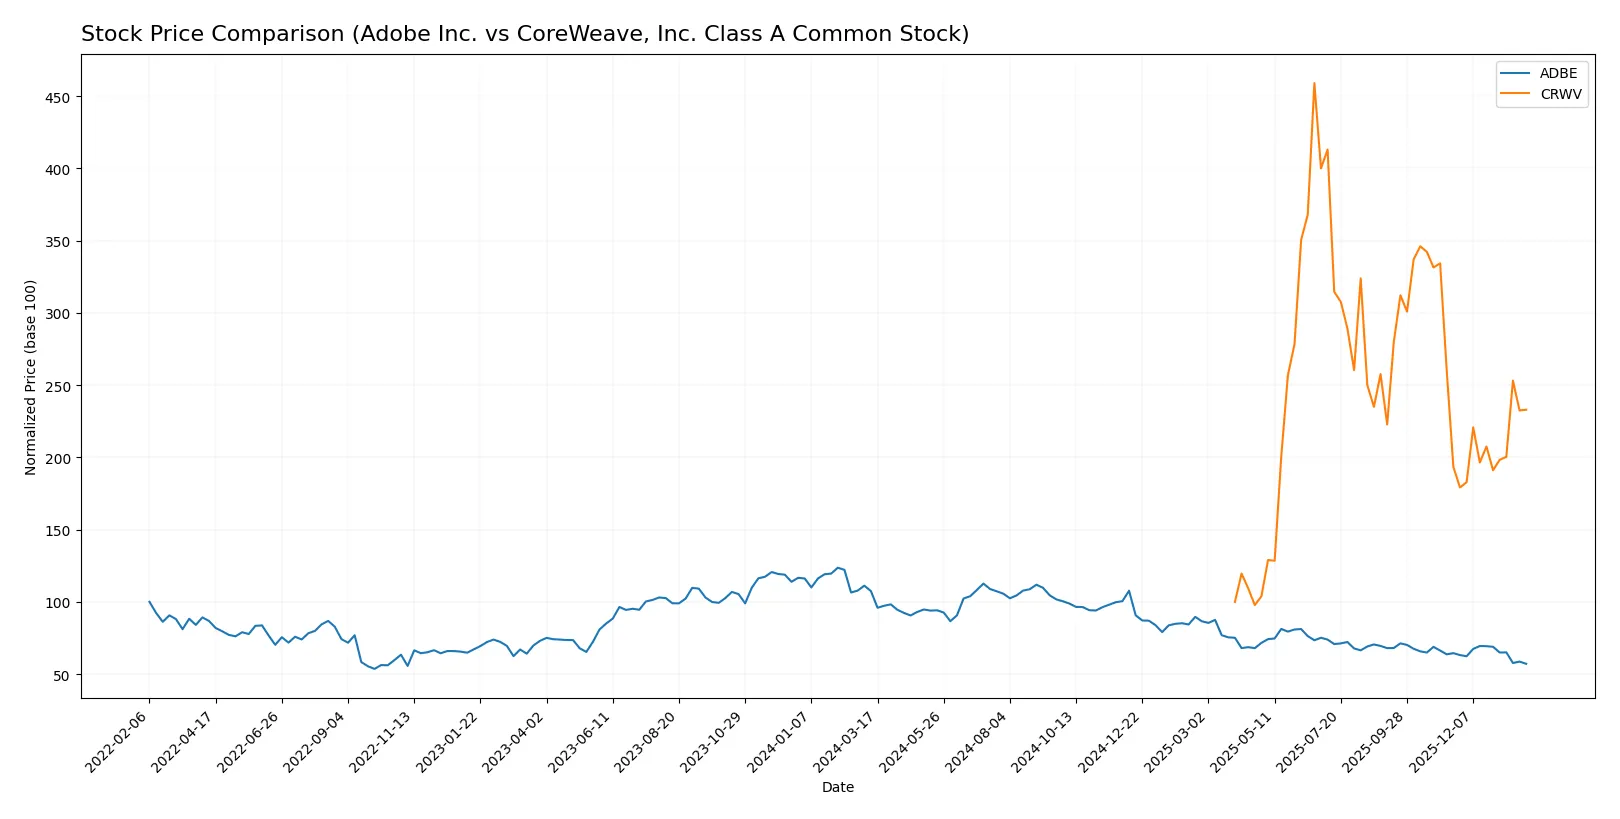
Which stock offers better returns?
The past year reveals sharp contrast: Adobe Inc. suffers a steep price decline, while CoreWeave, Inc. surges with accelerating gains and stronger buyer support.
Trend Comparison
Adobe Inc. shows a bearish trend with a -46.85% price drop over 12 months. The decline decelerates, with a recent -11.43% fall from November 2025 to February 2026. Volatility remains high (78.57 std dev).
CoreWeave, Inc. exhibits a robust bullish trend, gaining 132.97% over 12 months with accelerating momentum. Recent gains reached 20.46%, supported by moderate volatility (34.91 std dev) and rising buyer dominance.
CoreWeave’s stock outperformed Adobe substantially, delivering the highest market returns and sustained upward momentum over the analyzed period.
Target Prices
Analysts present a wide but optimistic target price range for Adobe Inc. and CoreWeave, reflecting growth expectations in software infrastructure.
| Company | Target Low | Target High | Consensus |
|---|---|---|---|
| Adobe Inc. | 280 | 500 | 390.31 |
| CoreWeave, Inc. Class A Common Stock | 84 | 175 | 120.73 |
The consensus target for Adobe sits 33% above its current price of 293.25, signaling strong upside potential. CoreWeave’s consensus target is 30% above its current 93.19, suggesting bullish sentiment despite elevated volatility risks.

Don’t Let Luck Decide Your Entry Point
Optimize your entry points with our advanced ProRealTime indicators. You’ll get efficient buy signals with precise price targets for maximum performance. Start outperforming now!
How do institutions grade them?
Adobe Inc. Grades
The following table summarizes recent grades assigned to Adobe Inc. by reputable institutions.
| Grading Company | Action | New Grade | Date |
|---|---|---|---|
| UBS | Maintain | Neutral | 2026-01-26 |
| Oppenheimer | Downgrade | Perform | 2026-01-13 |
| BMO Capital | Downgrade | Market Perform | 2026-01-09 |
| Jefferies | Downgrade | Hold | 2026-01-05 |
| Citigroup | Maintain | Neutral | 2025-12-17 |
| BMO Capital | Maintain | Outperform | 2025-12-15 |
| Keybanc | Downgrade | Underweight | 2025-12-15 |
| Wolfe Research | Maintain | Outperform | 2025-12-11 |
| TD Cowen | Maintain | Hold | 2025-12-11 |
| Oppenheimer | Maintain | Outperform | 2025-12-11 |
CoreWeave, Inc. Class A Common Stock Grades
Below is a concise overview of CoreWeave’s recent institutional grades.
| Grading Company | Action | New Grade | Date |
|---|---|---|---|
| Deutsche Bank | Upgrade | Buy | 2026-01-27 |
| Macquarie | Maintain | Neutral | 2026-01-27 |
| Mizuho | Maintain | Neutral | 2026-01-27 |
| DA Davidson | Upgrade | Buy | 2026-01-26 |
| Needham | Maintain | Hold | 2026-01-26 |
| Barclays | Maintain | Equal Weight | 2026-01-12 |
| Wells Fargo | Maintain | Overweight | 2026-01-08 |
| DA Davidson | Upgrade | Neutral | 2026-01-05 |
| Jefferies | Maintain | Buy | 2026-01-05 |
| Goldman Sachs | Maintain | Neutral | 2025-11-17 |
Which company has the best grades?
CoreWeave consistently receives Buy and Overweight ratings, reflecting stronger institutional confidence. Adobe’s grades trend more neutral or downgraded. Investors may interpret CoreWeave’s better grades as a signal of higher growth expectations or momentum.
Risks specific to each company
The following categories identify the critical pressure points and systemic threats facing both firms in the 2026 market environment:
1. Market & Competition
Adobe Inc.
- Established leader in diversified software with strong brand and wide enterprise adoption.
CoreWeave, Inc. Class A Common Stock
- Emerging player in cloud infrastructure for GenAI, facing intense competition and market volatility.
2. Capital Structure & Debt
Adobe Inc.
- Moderate debt-to-equity ratio at 0.57, with strong interest coverage of 33.96x.
CoreWeave, Inc. Class A Common Stock
- High debt burden, negative interest coverage, and debt-to-assets near 60%, signaling financial stress.
3. Stock Volatility
Adobe Inc.
- Beta of 1.53 indicates above-average volatility but within typical tech sector range.
CoreWeave, Inc. Class A Common Stock
- Extreme beta at 21.65 reflects extraordinary price swings, implying high investor risk.
4. Regulatory & Legal
Adobe Inc.
- Operates globally with standard regulatory risks typical for large software firms.
CoreWeave, Inc. Class A Common Stock
- As a recent IPO and cloud infrastructure provider, regulatory frameworks remain evolving and uncertain.
5. Supply Chain & Operations
Adobe Inc.
- Mature supply chains and robust digital delivery reduce operational risks.
CoreWeave, Inc. Class A Common Stock
- Reliance on specialized hardware and fast-scaling cloud infrastructure presents operational challenges.
6. ESG & Climate Transition
Adobe Inc.
- Increasing ESG focus with sustainability programs aligned to industry standards.
CoreWeave, Inc. Class A Common Stock
- Early stage with limited ESG disclosures, facing pressure to improve environmental and social governance.
7. Geopolitical Exposure
Adobe Inc.
- Global footprint exposes it to international trade tensions but with diversified risk.
CoreWeave, Inc. Class A Common Stock
- Concentrated U.S. base with potential vulnerability to domestic policy shifts and geopolitical tech conflicts.
Which company shows a better risk-adjusted profile?
Adobe’s established market position, solid capital structure, and stable financial metrics outweigh CoreWeave’s high leverage, severe volatility, and early operational risks. Adobe’s Altman Z-score of 8.14 places it safely above distress zones, while CoreWeave’s 1.0 signals acute bankruptcy risk. Adobe clearly offers a superior risk-adjusted profile for cautious investors.
Final Verdict: Which stock to choose?
Adobe Inc. demonstrates a powerful economic moat through highly efficient capital allocation and consistent value creation. Its unmatched profitability and robust free cash flow make it a cash machine. The point of vigilance lies in its tight liquidity, which could strain agility in volatile markets. It fits well in portfolios seeking steady, long-term growth.
CoreWeave, Inc. offers a strategic moat rooted in rapid revenue expansion fueled by niche cloud infrastructure demand. Its growth profile is aggressive but comes with significant financial risk, especially given its weak liquidity and value destruction signals. CoreWeave suits investors with high risk tolerance looking for potential explosive growth.
If you prioritize resilient profitability and durable competitive advantage, Adobe outshines with superior stability and value creation. However, if you seek aggressive growth fueled by market disruption and can tolerate elevated financial risk, CoreWeave might offer a compelling speculative opportunity. Both present distinct analytical scenarios tailored to different investor profiles.
Disclaimer: Investment carries a risk of loss of initial capital. The past performance is not a reliable indicator of future results. Be sure to understand risks before making an investment decision.
Go Further
I encourage you to read the complete analyses of Adobe Inc. and CoreWeave, Inc. Class A Common Stock to enhance your investment decisions: