Home > Comparison > Technology > ADBE vs NET
The strategic rivalry between Adobe Inc. and Cloudflare, Inc. shapes the evolution of the technology sector’s software infrastructure landscape. Adobe operates as a diversified software giant with a subscription-based creative platform, while Cloudflare focuses on integrated cloud security and performance solutions. This analysis contrasts Adobe’s established scale with Cloudflare’s growth potential, aiming to identify which company offers superior risk-adjusted returns for a diversified portfolio in today’s dynamic market environment.

Table of contents
Companies Overview
Adobe Inc. and Cloudflare, Inc. both hold pivotal roles in the software infrastructure space, shaping digital experiences and cloud security.
Adobe Inc.: A Creative and Experience Powerhouse
Adobe dominates as a diversified software leader with a core business in digital media and customer experience solutions. Its revenue primarily flows from Creative Cloud subscriptions and Document Cloud services. In 2026, Adobe focuses on expanding integrated platforms that optimize customer analytics, digital commerce, and content creation for enterprises and individual creators.
Cloudflare, Inc.: The Cloud Security and Performance Specialist
Cloudflare stands as a cloud services provider specializing in integrated security solutions and performance optimization. It generates revenue from cloud firewall, DDoS protection, and intelligent routing services. Its 2026 strategy centers on securing hybrid environments across public clouds, SaaS, IoT, and delivering reliability through advanced networking technologies.
Strategic Collision: Similarities & Divergences
Both companies excel in software infrastructure but pursue distinct philosophies: Adobe emphasizes a closed ecosystem integrating content creation and marketing, while Cloudflare champions an open, multi-platform security network. Their primary battleground lies in serving enterprises’ digital transformation needs, with Adobe focusing on creative and experience software, and Cloudflare on cloud security and performance. This divergence shapes their unique investment profiles—Adobe as a content powerhouse, Cloudflare as a cloud security innovator.
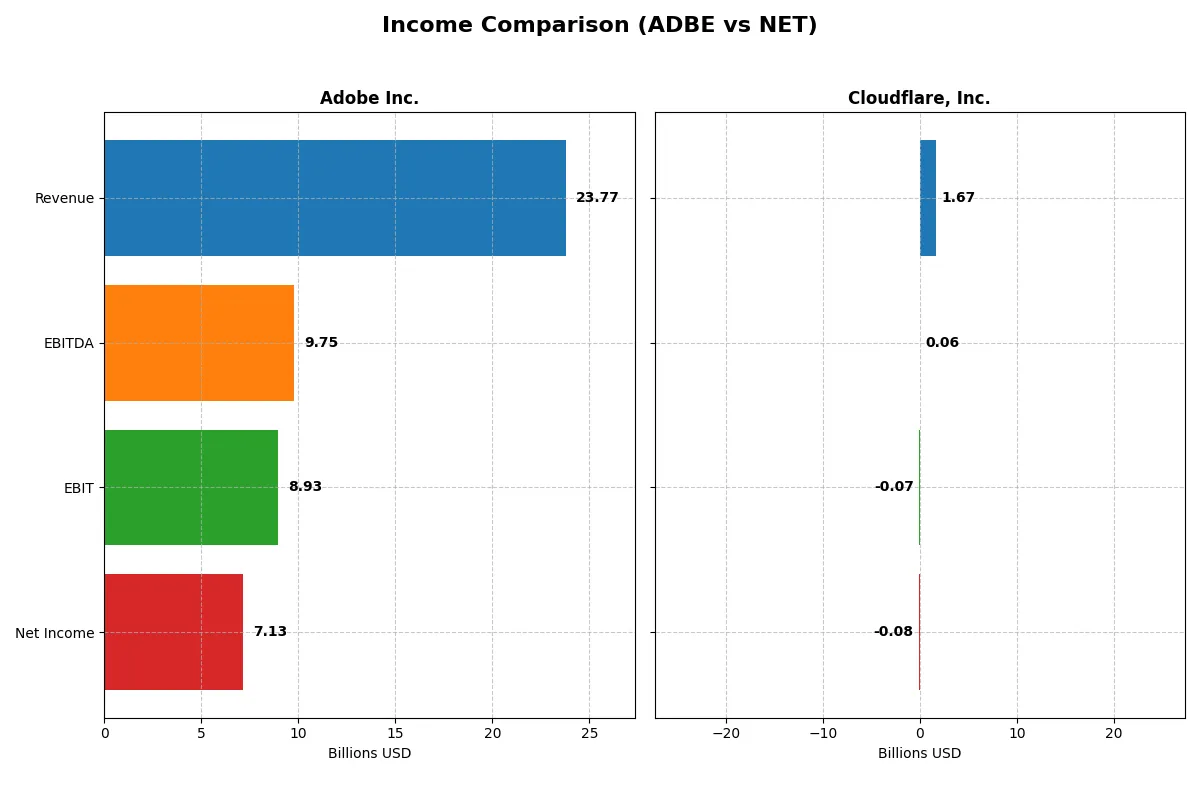
Income Statement Comparison
This table dissects the core profitability and scalability of both corporate engines to reveal who dominates the bottom line:
| Metric | Adobe Inc. (ADBE) | Cloudflare, Inc. (NET) |
|---|---|---|
| Revenue | 23.8B | 1.7B |
| Cost of Revenue | 2.7B | 379M |
| Operating Expenses | 12.4B | 1.4B |
| Gross Profit | 21.1B | 1.3B |
| EBITDA | 9.7B | 62M |
| EBIT | 8.9B | -66M |
| Interest Expense | 263M | 5.2M |
| Net Income | 7.1B | -79M |
| EPS | 16.73 | -0.23 |
| Fiscal Year | 2025 | 2024 |
Income Statement Analysis: The Bottom-Line Duel
This income statement comparison reveals the true efficiency and profit generation of each company’s operational engine over recent years.
Adobe Inc. Analysis
Adobe Inc. shows a robust revenue growth from $15.8B in 2021 to $23.8B in 2025, with net income rising from $4.8B to $7.1B. The company sustains a strong gross margin above 88%, and net margins at 30%, reflecting impressive operational efficiency. In 2025, Adobe’s EBIT surged 26%, signaling accelerating profitability momentum.
Cloudflare, Inc. Analysis
Cloudflare’s revenue rose sharply from $431M in 2020 to $1.67B in 2024, marking significant expansion. Despite a positive gross margin near 77%, Cloudflare reports negative net margins (-4.7%) due to high operating expenses. However, its EBIT improved markedly in 2024, reducing losses by 72%, indicating a path toward operational leverage.
Margin Strength vs. Growth Scale
Adobe leads with superior profitability and consistent margin expansion, delivering higher absolute profits and operational leverage. Cloudflare excels in rapid revenue growth but remains unprofitable, reflecting a growth-at-all-costs model. For investors, Adobe’s mature, margin-driven profile offers stability, while Cloudflare presents opportunity paired with execution risk.
Financial Ratios Comparison
These vital ratios act as a diagnostic tool to expose the underlying fiscal health, valuation premiums, and capital efficiency of the companies compared:
| Ratios | Adobe Inc. (ADBE) | Cloudflare, Inc. (NET) |
|---|---|---|
| ROE | 61.3% | -7.5% |
| ROIC | 36.7% | -6.1% |
| P/E | 19.1 | -466.5 |
| P/B | 11.7 | 35.1 |
| Current Ratio | 1.0 | 2.9 |
| Quick Ratio | 1.0 | 2.9 |
| D/E (Debt/Equity) | 0.57 | 1.40 |
| Debt-to-Assets | 22.5% | 44.3% |
| Interest Coverage | 33.1 | -29.8 |
| Asset Turnover | 0.81 | 0.51 |
| Fixed Asset Turnover | 10.9 | 2.63 |
| Payout Ratio | 0% | 0% |
| Dividend Yield | 0% | 0% |
| Fiscal Year | 2025 | 2024 |
Efficiency & Valuation Duel: The Vital Signs
Ratios act as a company’s DNA, exposing hidden risks and operational strengths that shape shareholder value and market perception.
Adobe Inc.
Adobe displays strong profitability with a 61.3% ROE and a robust 30% net margin, indicating operational excellence. Its P/E of 19.13 suggests a fairly valued stock relative to growth prospects. Despite no dividend, Adobe efficiently reinvests earnings into R&D, fueling innovation and long-term growth.
Cloudflare, Inc.
Cloudflare suffers from negative profitability metrics, including a -7.5% ROE and -4.7% net margin, signaling operational challenges. Its P/E is negative but distorted by losses, while a high P/B of 35.14 reflects stretched valuation. The company retains capital for aggressive R&D, aiming to drive future expansion despite current losses.
Profitability Stability vs. Growth Ambition
Adobe offers a healthier balance of profitability and valuation, reflecting operational strength and prudent capital use. Cloudflare’s metrics reveal high risk and speculative growth, fitting investors seeking aggressive expansion. The choice hinges on appetite for stable returns versus high-growth potential amid uncertainty.
Which one offers the Superior Shareholder Reward?
I observe Adobe Inc. (ADBE) maintains a zero dividend yield but delivers strong free cash flow (23.1/share) with consistent buybacks driving shareholder value. Cloudflare, Inc. (NET) also pays no dividends but shows weak free cash flow (0.57/share) and high debt levels, limiting buyback capacity. Adobe’s capital-efficient model and robust buyback program offer a more sustainable and attractive total return in 2026.
Comparative Score Analysis: The Strategic Profile
The radar chart reveals the fundamental DNA and trade-offs of Adobe Inc. and Cloudflare, Inc., highlighting their financial strengths and vulnerabilities:
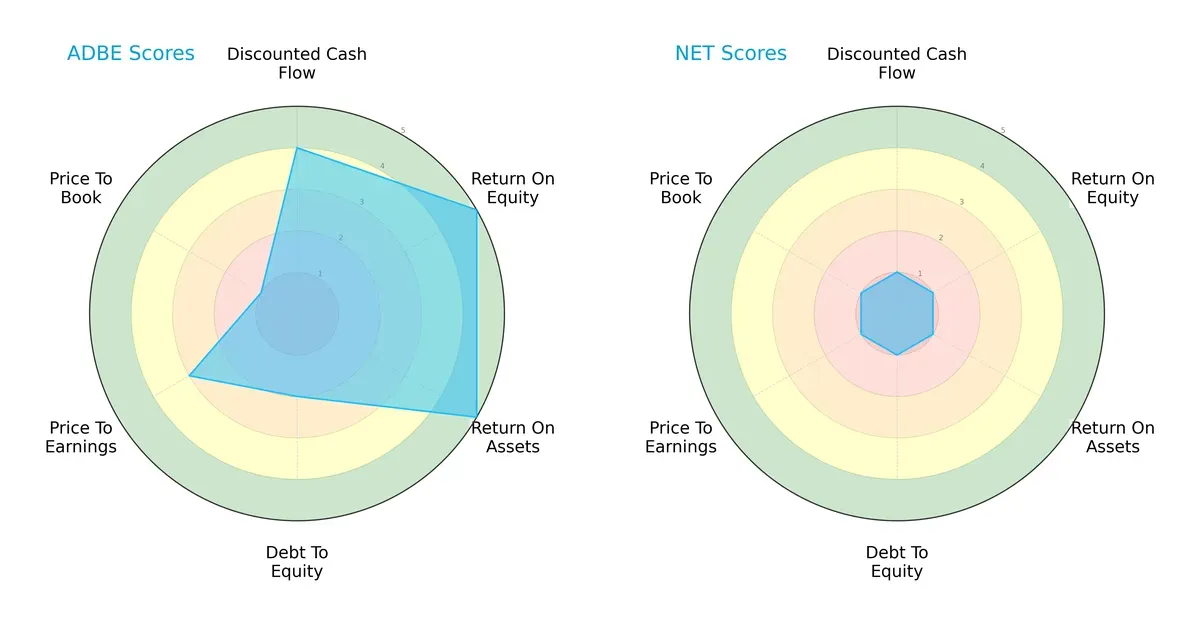
Adobe Inc. dominates with strong ROE and ROA scores (5 each), signaling efficient profit generation and asset use. Its DCF score (4) supports solid valuation, though debt-to-equity (2) and price-to-book (1) scores expose balance sheet caution. Cloudflare lags on all fronts with scores of 1, indicating financial weakness and high risk. Adobe offers a more balanced profile, while Cloudflare relies on no specific financial edge.
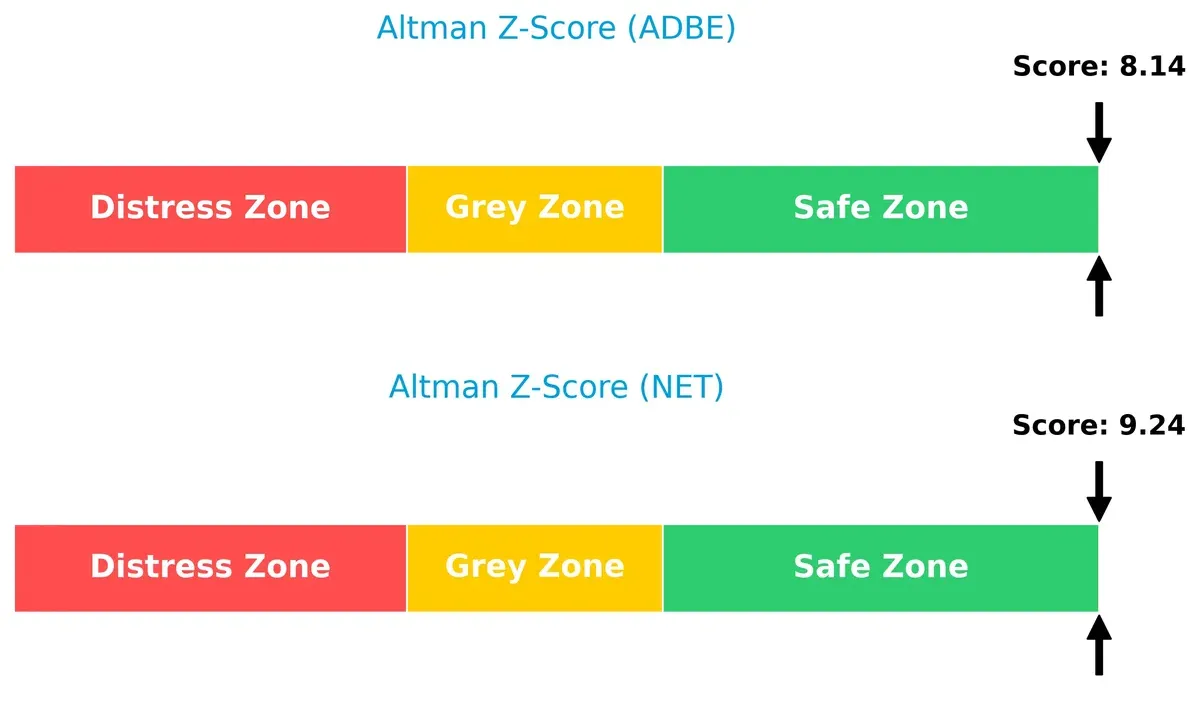
Bankruptcy Risk: Solvency Showdown
Adobe’s Altman Z-Score stands at 8.14 versus Cloudflare’s 9.24, both safely above distress thresholds, indicating strong solvency and low bankruptcy risk in this cycle:
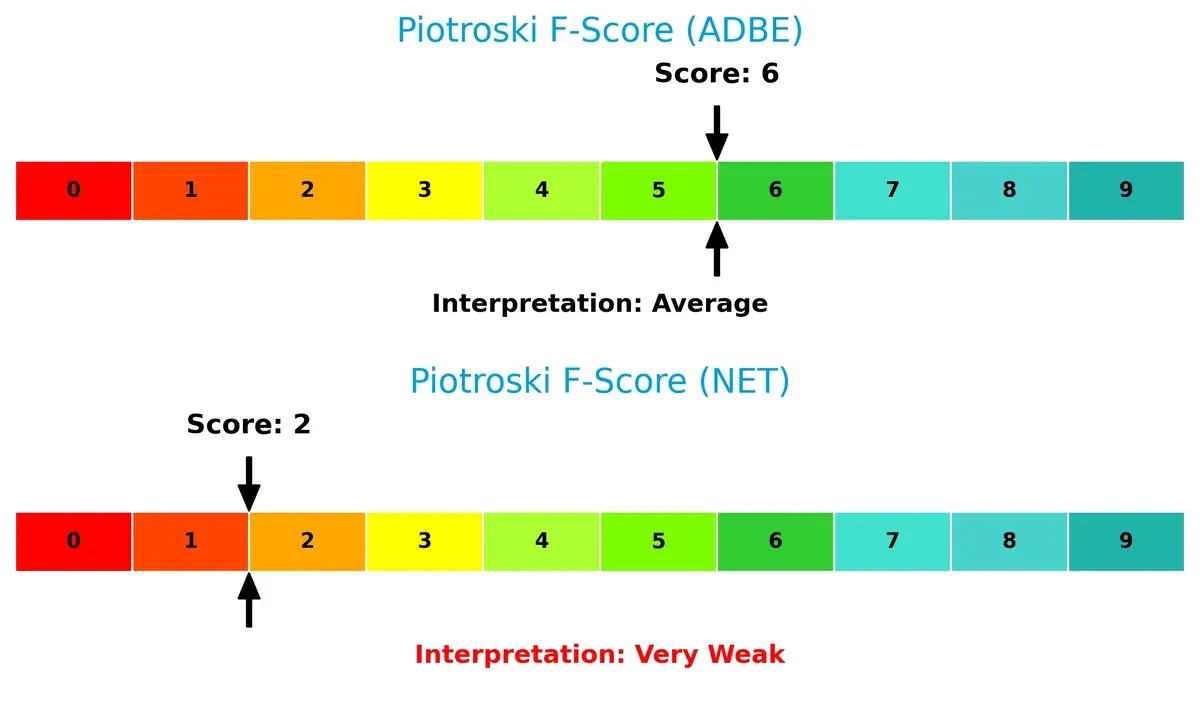
Financial Health: Quality of Operations
Adobe’s Piotroski F-Score of 6 signals average financial health with room for improvement. Cloudflare’s weak score of 2 raises red flags, suggesting operational and financial instability:
How are the two companies positioned?
This section dissects Adobe and Cloudflare’s operational DNA by comparing their revenue distribution and internal strengths and weaknesses. The goal is to confront their economic moats to identify which offers the most resilient, sustainable competitive advantage today.
Revenue Segmentation: The Strategic Mix
This visual comparison dissects how both firms diversify their income streams and where their primary sector bets lie:
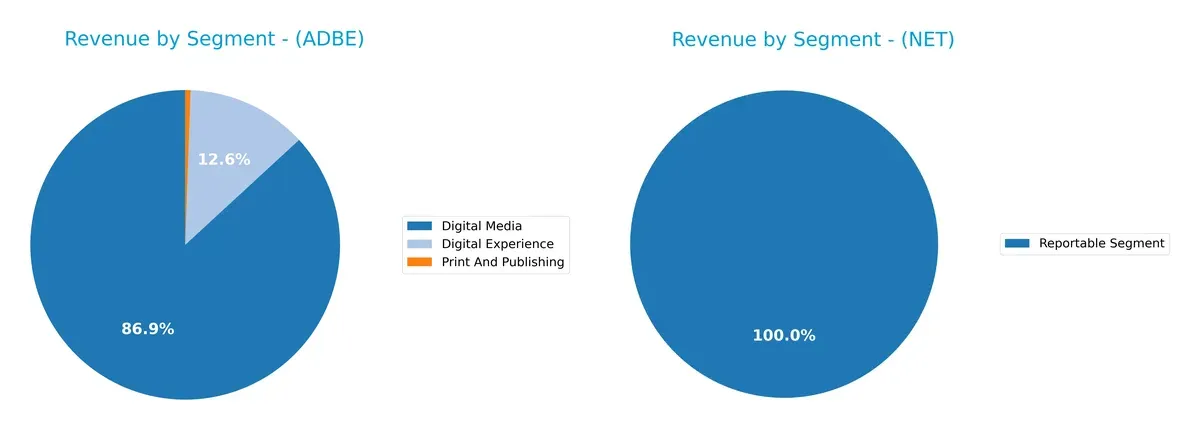
Adobe Inc. dwarfs Cloudflare with a diverse revenue mix anchored by Digital Media at $40.4B and Digital Experience at $5.9B in 2025. Cloudflare’s single reported segment of $1.7B signals a concentrated business model, increasing sector-specific risk. Adobe’s broad portfolio supports ecosystem lock-in, while Cloudflare leans on infrastructure dominance, exposing it to fluctuations in one market segment.
Strengths and Weaknesses Comparison
This table compares the Strengths and Weaknesses of Adobe Inc. and Cloudflare, Inc.:
Adobe Inc. Strengths
- Strong profitability with 30% net margin
- High ROE at 61%
- Favorable debt-to-assets at 22.5%
- High fixed asset turnover at 10.9
- Diverse product segments including Digital Experience and Media
- Broad global presence mainly Americas and EMEA
Cloudflare, Inc. Strengths
- Strong liquidity with current and quick ratios at 2.86
- Presence in multiple geographies including US, EMEA, Asia Pacific
- Positive P/E status despite negative earnings
- Focused product segment with growing revenues
Adobe Inc. Weaknesses
- Unfavorable WACC at 10.6% above ROIC
- Low current ratio at 1.0 indicating tight liquidity
- High price-to-book at 11.7
- No dividend yield
- Moderate debt/equity ratio at 0.57
- Neutral asset turnover at 0.81
Cloudflare, Inc. Weaknesses
- Negative profitability with net margin -4.7% and ROE -7.5%
- High debt/equity ratio at 1.4
- Negative interest coverage at -12.6
- Unfavorable WACC at 12.85%
- Very high price-to-book at 35.1
- No dividend yield
Adobe shows robust profitability and diversified revenue streams but exhibits some liquidity and valuation concerns. Cloudflare benefits from strong liquidity and geographic reach but faces significant profitability and leverage challenges, impacting financial stability.
The Moat Duel: Analyzing Competitive Defensibility
A structural moat shields long-term profits from relentless competition erosion. Its nature defines which firm sustains superior returns:
Adobe Inc.: Subscription Switching Costs Powerhouse
Adobe’s moat stems from high switching costs embedded in its Creative Cloud ecosystem. This drives stable 30% net margins and 26% ROIC above WACC. Expanding digital experience solutions in 2026 should deepen its defensibility.
Cloudflare, Inc.: Emerging Network Effects Challenger
Cloudflare leverages network effects in cloud security and performance. Despite negative net margins, its 29% revenue growth and improving ROIC signal rising competitive strength. Scaling global infrastructure and SaaS offerings could disrupt markets further.
Subscription Lock-in vs. Network Effect Scale: The Moat Verdict
Adobe’s entrenched subscription model delivers a wider, enduring moat with strong value creation and margin stability. Cloudflare’s moat is narrower but growing, reliant on market expansion and margin improvement. Adobe remains better positioned to preserve market share long term.
Which stock offers better returns?
Over the past 12 months, Adobe Inc. experienced a sharp decline, while Cloudflare, Inc. posted strong gains, both showing decelerating momentum near recent lows.
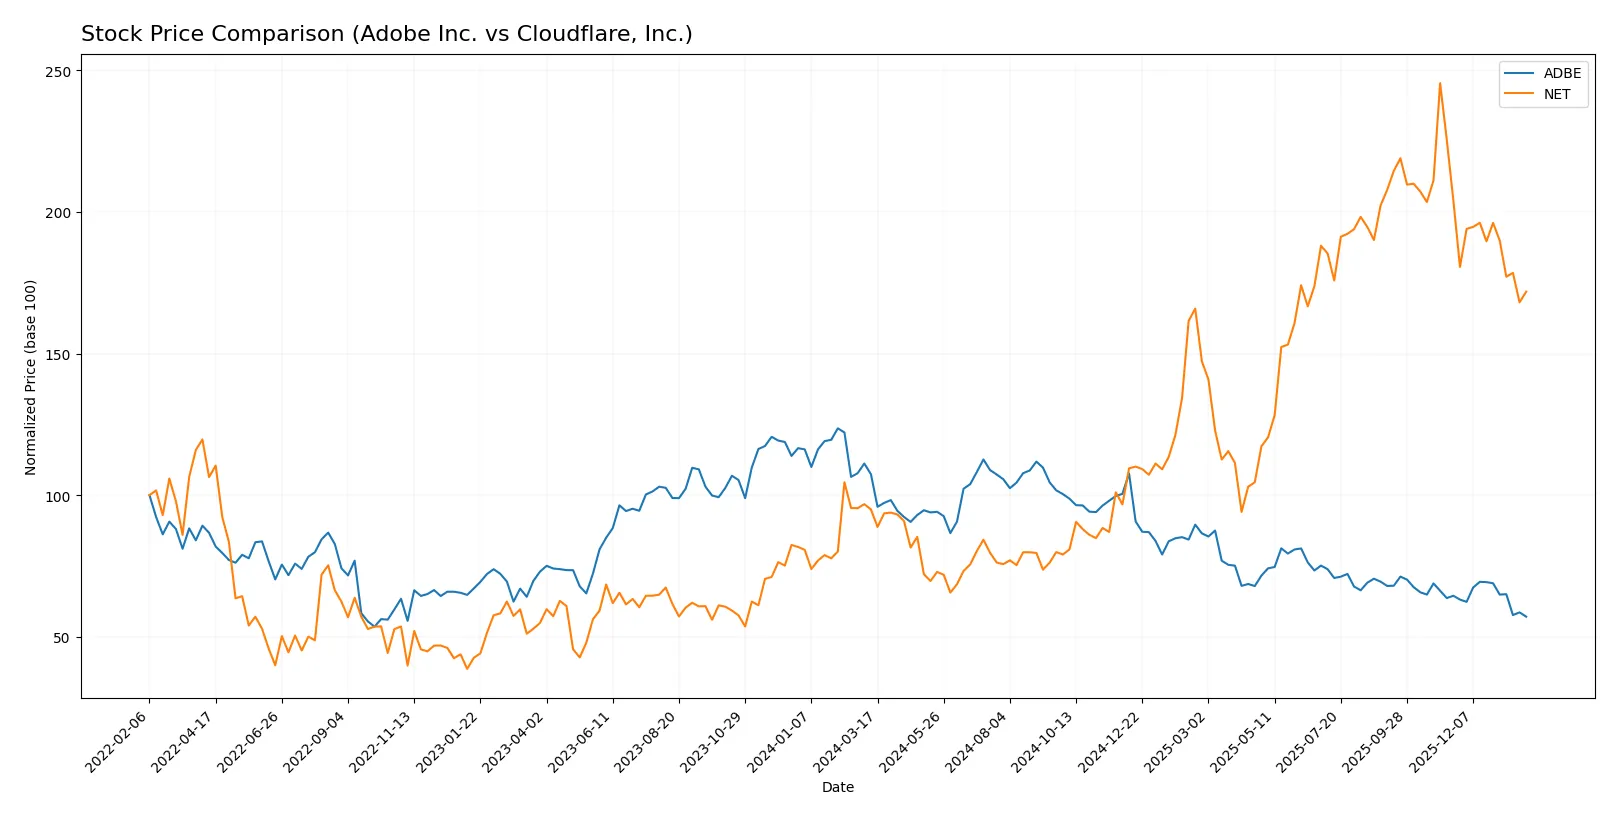
Trend Comparison
Adobe Inc. shows a bearish trend with a -46.85% price change over 12 months, decelerating from highs near 578 to lows around 293. Volume trends upwards, but seller dominance persists.
Cloudflare, Inc. exhibits a bullish trend with an 80.99% rise over the same period, despite deceleration. The stock ranged from 67.69 to 253.3, with a recent volume shift to neutral buying.
Cloudflare’s stock outperformed Adobe’s by a wide margin, delivering the highest market returns despite recent short-term weakness in both.
Target Prices
Analysts show a cautiously optimistic target consensus for Adobe Inc. and Cloudflare, Inc.
| Company | Target Low | Target High | Consensus |
|---|---|---|---|
| Adobe Inc. | 280 | 500 | 390.31 |
| Cloudflare, Inc. | 210 | 300 | 247.75 |
Adobe’s target consensus at 390.31 suggests a 33% upside from the current 293.25 price, reflecting strong confidence in its software moat. Cloudflare’s consensus target of 247.75 implies a 40% potential gain, signaling bullish sentiment despite recent volatility.

Don’t Let Luck Decide Your Entry Point
Optimize your entry points with our advanced ProRealTime indicators. You’ll get efficient buy signals with precise price targets for maximum performance. Start outperforming now!
How do institutions grade them?
Adobe Inc. Grades
This table summarizes recent grade updates from established grading firms for Adobe Inc.:
| Grading Company | Action | New Grade | Date |
|---|---|---|---|
| UBS | Maintain | Neutral | 2026-01-26 |
| Oppenheimer | Downgrade | Perform | 2026-01-13 |
| BMO Capital | Downgrade | Market Perform | 2026-01-09 |
| Jefferies | Downgrade | Hold | 2026-01-05 |
| Citigroup | Maintain | Neutral | 2025-12-17 |
| BMO Capital | Maintain | Outperform | 2025-12-15 |
| Keybanc | Downgrade | Underweight | 2025-12-15 |
| Wolfe Research | Maintain | Outperform | 2025-12-11 |
| TD Cowen | Maintain | Hold | 2025-12-11 |
| Oppenheimer | Maintain | Outperform | 2025-12-11 |
Cloudflare, Inc. Grades
Here are the latest confirmed ratings from reputable institutions for Cloudflare, Inc.:
| Grading Company | Action | New Grade | Date |
|---|---|---|---|
| Mizuho | Maintain | Outperform | 2026-01-21 |
| Citigroup | Maintain | Buy | 2026-01-16 |
| UBS | Maintain | Neutral | 2026-01-13 |
| Piper Sandler | Maintain | Neutral | 2026-01-05 |
| Argus Research | Maintain | Buy | 2025-11-10 |
| Susquehanna | Maintain | Neutral | 2025-11-03 |
| Citigroup | Maintain | Buy | 2025-11-03 |
| UBS | Maintain | Neutral | 2025-10-31 |
| RBC Capital | Maintain | Outperform | 2025-10-31 |
| Stifel | Maintain | Buy | 2025-10-31 |
Which company has the best grades?
Cloudflare, Inc. holds stronger and more consistent buy and outperform ratings than Adobe Inc. Adobe shows a recent pattern of downgrades and neutral stances. Investors may see Cloudflare’s higher grades as a sign of greater analyst confidence.
Risks specific to each company
The following categories identify the critical pressure points and systemic threats facing both firms in the 2026 market environment:
1. Market & Competition
Adobe Inc.
- Established leader in creative and marketing software with strong brand moat.
Cloudflare, Inc.
- Faces intense competition in cloud security and performance from larger tech firms.
2. Capital Structure & Debt
Adobe Inc.
- Moderate debt-to-equity of 0.57, interest coverage at 33.96 supports stability.
Cloudflare, Inc.
- High debt-to-equity at 1.4 with negative interest coverage signals financial stress.
3. Stock Volatility
Adobe Inc.
- Beta of 1.53 indicates moderate sensitivity to market swings.
Cloudflare, Inc.
- Beta of 1.97 reflects elevated volatility and higher risk exposure.
4. Regulatory & Legal
Adobe Inc.
- Operates globally but less exposed to stringent cybersecurity regulations.
Cloudflare, Inc.
- Heavy regulatory scrutiny due to security service nature and data privacy laws.
5. Supply Chain & Operations
Adobe Inc.
- Relies on software development and cloud infrastructure with robust operational controls.
Cloudflare, Inc.
- Dependent on global internet infrastructure, vulnerable to outages and cyber threats.
6. ESG & Climate Transition
Adobe Inc.
- Increasing ESG initiatives; digital media focus reduces carbon footprint.
Cloudflare, Inc.
- Cloud operations are energy-intensive; sustainability efforts still evolving.
7. Geopolitical Exposure
Adobe Inc.
- Moderate exposure through international sales but diversified across regions.
Cloudflare, Inc.
- Higher risk from geopolitical tensions impacting internet infrastructure and cross-border data flows.
Which company shows a better risk-adjusted profile?
Adobe’s strongest risk factor is a stretched current ratio of 1.0, highlighting liquidity risk despite robust profitability and stable capital structure. Cloudflare’s most pressing risk is its fragile capital structure and negative profitability metrics, amplified by high leverage and volatility. I observe Adobe’s balanced debt and strong interest coverage as a key advantage. Cloudflare’s elevated beta and weak financial ratios make it a riskier holding in this cycle. Overall, Adobe presents a superior risk-adjusted profile supported by its financial resilience and market position.
Final Verdict: Which stock to choose?
Adobe Inc. stands out as a cash-generating powerhouse with a durable competitive moat. Its consistent value creation and high returns on invested capital reflect strong operational efficiency. A point of vigilance is its tight liquidity position, which might pressure short-term flexibility. Adobe suits portfolios targeting steady, long-term growth with moderate risk tolerance.
Cloudflare, Inc. leverages a strategic moat rooted in cloud infrastructure dominance and rapid revenue expansion. Its robust liquidity profile offers greater balance sheet safety compared to Adobe. However, ongoing value destruction and negative returns signal caution. Cloudflare fits investors seeking aggressive growth with a higher risk appetite and a focus on innovation-driven upside.
If you prioritize reliable cash flow and proven value creation, Adobe is the compelling choice due to its stable profitability and durable moat. However, if you seek high-growth potential and can accept elevated financial risk, Cloudflare offers superior revenue momentum and strategic positioning in the cloud space. Both cases require thoughtful risk management aligned with your investment horizon.
Disclaimer: Investment carries a risk of loss of initial capital. The past performance is not a reliable indicator of future results. Be sure to understand risks before making an investment decision.
Go Further
I encourage you to read the complete analyses of Adobe Inc. and Cloudflare, Inc. to enhance your investment decisions: