Home > Comparison > Technology > ADBE vs CCCS
The strategic rivalry between Adobe Inc. and CCC Intelligent Solutions shapes the technology software infrastructure landscape. Adobe, a diversified software giant, focuses on creative and digital experience platforms, while CCC leverages AI-driven SaaS solutions for the insurance ecosystem. This analysis pits Adobe’s scale and innovation against CCC’s niche specialization, aiming to identify which offers a superior risk-adjusted profile for a balanced portfolio. The outcome informs sector leadership in a dynamic market.

Table of contents
Companies Overview
Adobe Inc. and CCC Intelligent Solutions Holdings Inc. stand as key innovators in software infrastructure, shaping distinct industry niches.
Adobe Inc.: Global Leader in Creative and Digital Experience Software
Adobe Inc. dominates as a diversified software company with a stronghold in creative content and digital marketing tools. Its core revenue stems from Creative Cloud subscriptions, powering content creation globally. In 2026, Adobe sharpens its focus on integrated digital experiences, blending analytics with commerce solutions to enhance customer engagement and enterprise value.
CCC Intelligent Solutions Holdings Inc.: Pioneering AI in Insurance Software
CCC Intelligent Solutions leads by providing AI-powered cloud and mobile solutions to the property and casualty insurance sector. It monetizes through SaaS offerings that digitize workflows and connect stakeholders like insurers and repairers. The company’s strategy in 2026 centers on expanding its AI analytics and telematics to streamline insurance claims and repair processes.
Strategic Collision: Similarities & Divergences
Both companies thrive in software infrastructure but diverge sharply in focus—Adobe embraces a broad creative and marketing ecosystem, while CCC specializes in insurance technology. Their primary battleground lies in cloud-based workflow efficiency, with Adobe targeting diverse enterprises and CCC narrowing on insurance economy connectivity. This contrast creates distinct investment profiles: Adobe offers broad market exposure, whereas CCC presents a niche growth opportunity within a specialized industry.
Income Statement Comparison
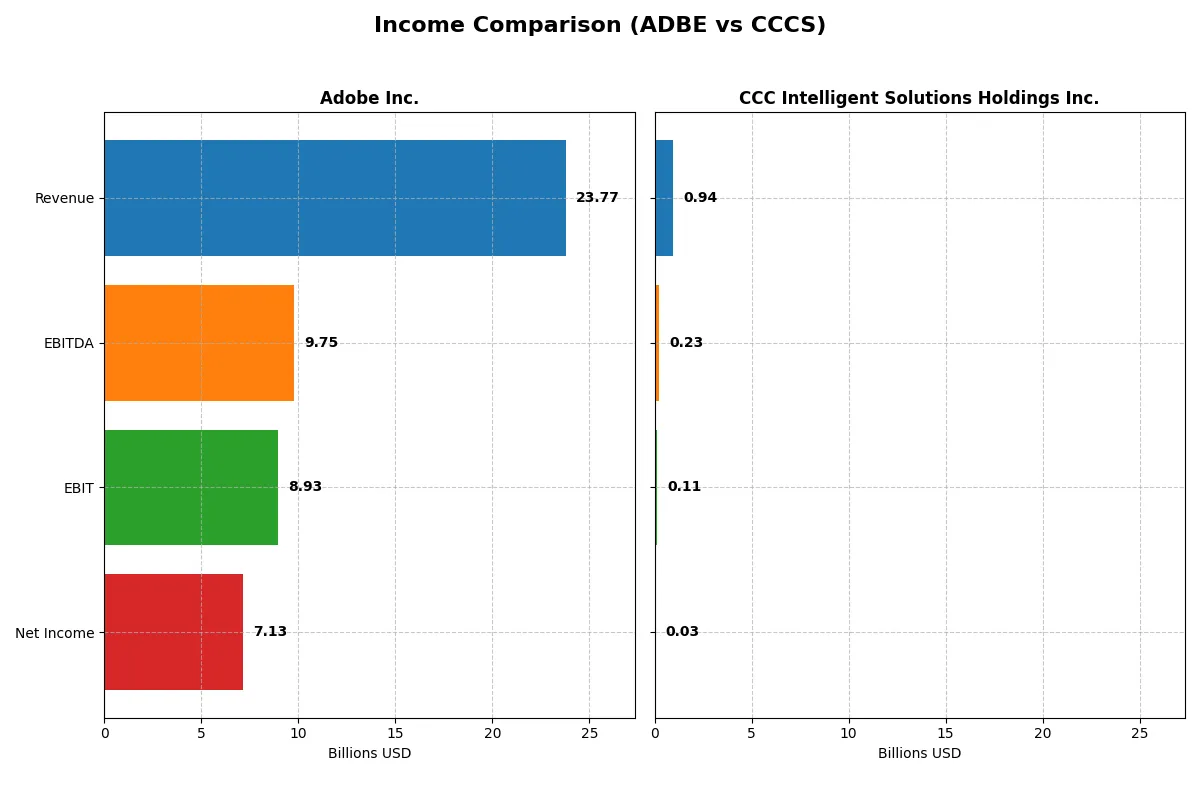
This table dissects the core profitability and scalability of both corporate engines to reveal who dominates the bottom line:
| Metric | Adobe Inc. (ADBE) | CCC Intelligent Solutions Holdings Inc. (CCCS) |
|---|---|---|
| Revenue | 23.8B | 945M |
| Cost of Revenue | 2.71B | 231M |
| Operating Expenses | 12.4B | 634M |
| Gross Profit | 21.1B | 714M |
| EBITDA | 9.75B | 233M |
| EBIT | 8.93B | 109M |
| Interest Expense | 263M | 65M |
| Net Income | 7.13B | 26M |
| EPS | 16.73 | 0.0428 |
| Fiscal Year | 2025 | 2024 |
Income Statement Analysis: The Bottom-Line Duel
This income statement comparison reveals which company runs a more efficient and profitable corporate engine through their recent financial performance.
Adobe Inc. Analysis
Adobe Inc. drives strong revenue growth from $15.8B in 2021 to $23.8B in 2025, boosting net income from $4.8B to $7.1B. Its gross margin holds an impressive 88.6%, and net margin stands at a healthy 30%. The 2025 results demonstrate robust operating leverage and expanding profitability momentum.
CCC Intelligent Solutions Holdings Inc. Analysis
CCC Intelligent Solutions grows revenue from $633M in 2020 to $945M in 2024, with net income swinging from a -$17M loss to a $26M profit. It maintains a decent 75.6% gross margin but a slim 2.8% net margin. The 2024 jump to profitability signals operational improvement but still reflects a smaller scale and lower efficiency.
Margin Strength vs. Scale Advantage
Adobe clearly outperforms CCC with substantially higher margins and larger absolute profits, reflecting superior cost control and pricing power. CCC shows rapid margin and earnings improvement but remains far smaller and less profitable. For investors seeking scale and consistent profit generation, Adobe’s profile offers greater fundamental strength.
Financial Ratios Comparison
These vital ratios act as a diagnostic tool to expose the underlying fiscal health, valuation premiums, and capital efficiency of the companies compared below:
| Ratios | Adobe Inc. (ADBE) | CCC Intelligent Solutions (CCCS) |
|---|---|---|
| ROE | 61.3% | 1.3% |
| ROIC | 36.7% | 1.9% |
| P/E | 19.1 | 274.0 |
| P/B | 11.7 | 3.6 |
| Current Ratio | 1.0 | 3.6 |
| Quick Ratio | 1.0 | 3.6 |
| D/E (Debt-to-Equity) | 0.57 | 0.42 |
| Debt-to-Assets | 22.5% | 26.7% |
| Interest Coverage | 33.1 | 1.2 |
| Asset Turnover | 0.81 | 0.30 |
| Fixed Asset Turnover | 10.9 | 4.7 |
| Payout ratio | 0% | 0% |
| Dividend yield | 0% | 0% |
| Fiscal Year | 2025 | 2024 |
Efficiency & Valuation Duel: The Vital Signs
Financial ratios act as a company’s DNA, revealing hidden risks and operational excellence beyond surface-level metrics.
Adobe Inc.
Adobe delivers robust profitability with a 61.3% ROE and a strong 30% net margin, signaling operational efficiency. Its P/E ratio of 19.1 suggests a fairly valued stock, neither stretched nor cheap. Adobe reinvests heavily in R&D, prioritizing long-term growth over dividends, reflecting a growth-focused capital allocation strategy.
CCC Intelligent Solutions Holdings Inc.
Data for CCC Intelligent Solutions’ key financial ratios is unavailable, limiting direct comparison. Without concrete metrics on profitability or valuation, assessing operational efficiency and shareholder returns remains inconclusive. This lack of transparency itself represents a cautionary signal for investors seeking clarity on financial health.
Valuation Transparency vs. Data Opacity
Adobe’s clear profitability and fair valuation offer a more reliable risk-reward profile. CCC’s missing data increases uncertainty, making Adobe’s growth-driven model better suited for investors valuing transparency and operational strength. Those prioritizing clear financial signals will find Adobe’s profile more aligned with prudent investing.
Which one offers the Superior Shareholder Reward?
Adobe Inc. (ADBE) does not pay dividends but generates strong free cash flow (23.1/share in 2025) and maintains a disciplined buyback strategy, driving shareholder value through capital allocation. CCC Intelligent Solutions Holdings Inc. (CCCS) also pays no dividends and shows weaker free cash flow (0.38/share in 2024) with limited buyback capacity. Adobe’s superior margins, consistent cash flow, and sustainable capital returns offer a clearer path to total return. I favor Adobe for a more attractive and reliable shareholder reward in 2026.
Bankruptcy Risk Duel (Altman Z-Score)
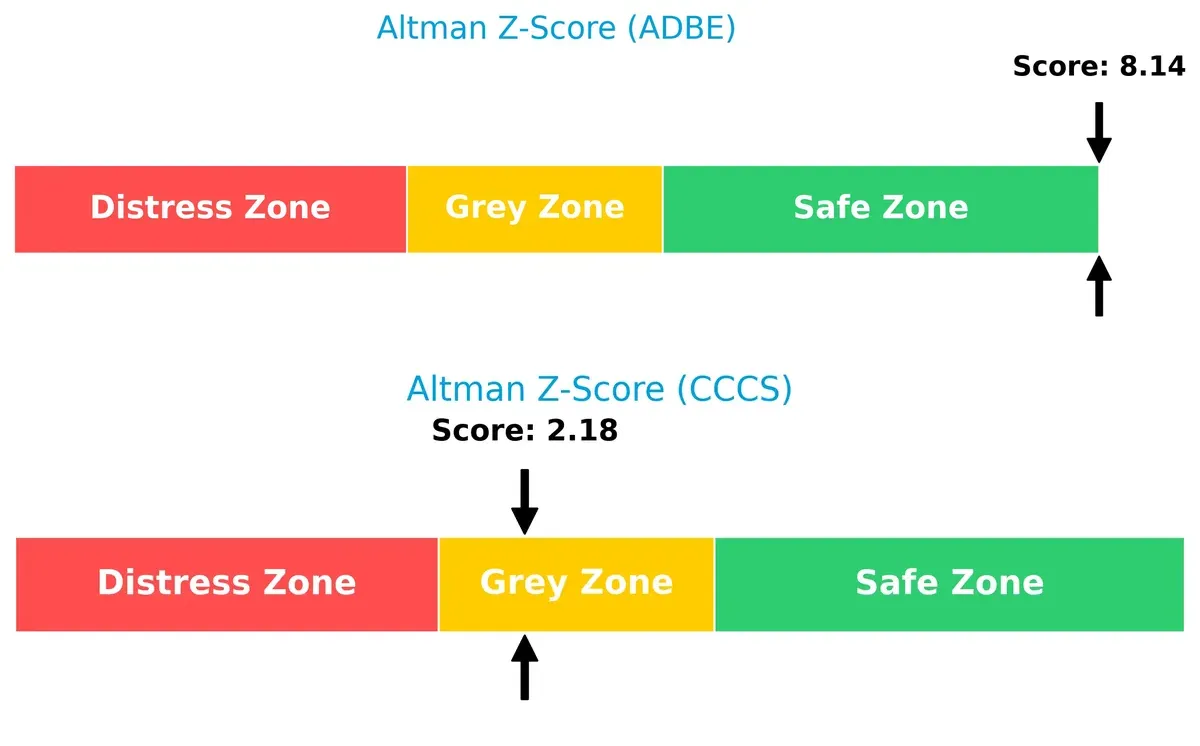
Bankruptcy Risk: Solvency Showdown
I observe a stark contrast in Altman Z-Scores between Adobe Inc. (8.1) and CCC Intelligent Solutions (2.2). Adobe is firmly in the safe zone, signaling strong solvency and low bankruptcy risk. CCC hovers in the grey zone, indicating elevated financial distress risk under current market volatility:
—
Financial Strength Showdown (Piotroski F-Score)
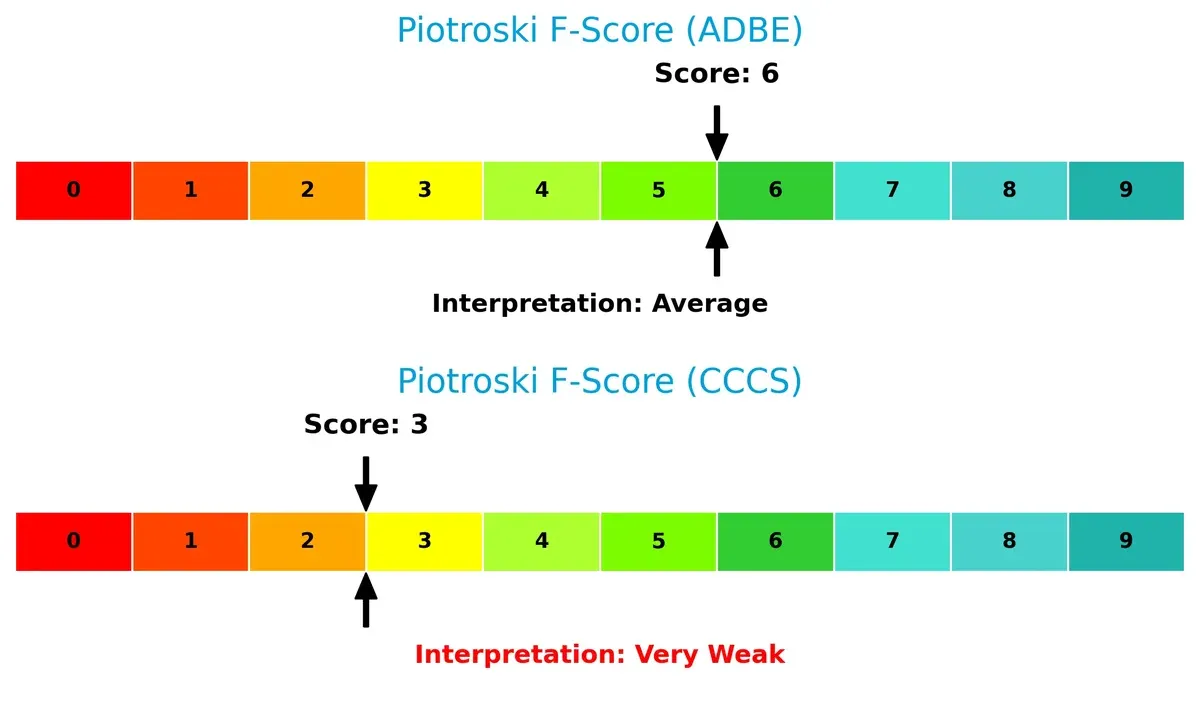
Financial Health: Quality of Operations
Adobe’s Piotroski score of 6 reflects average operational health but solid fundamentals. CCC’s score of 3 flags significant internal weaknesses and red flags compared to Adobe’s more stable profile:
How are the two companies positioned?
This section dissects Adobe and CCCS’s operational DNA by comparing their revenue distribution and internal strengths and weaknesses. The goal is to confront their economic moats and identify which model offers the most resilient, sustainable competitive advantage today.
Revenue Segmentation: The Strategic Mix
This comparison dissects how Adobe Inc. and CCC Intelligent Solutions Holdings diversify their income streams and reveals where their primary sector bets lie:
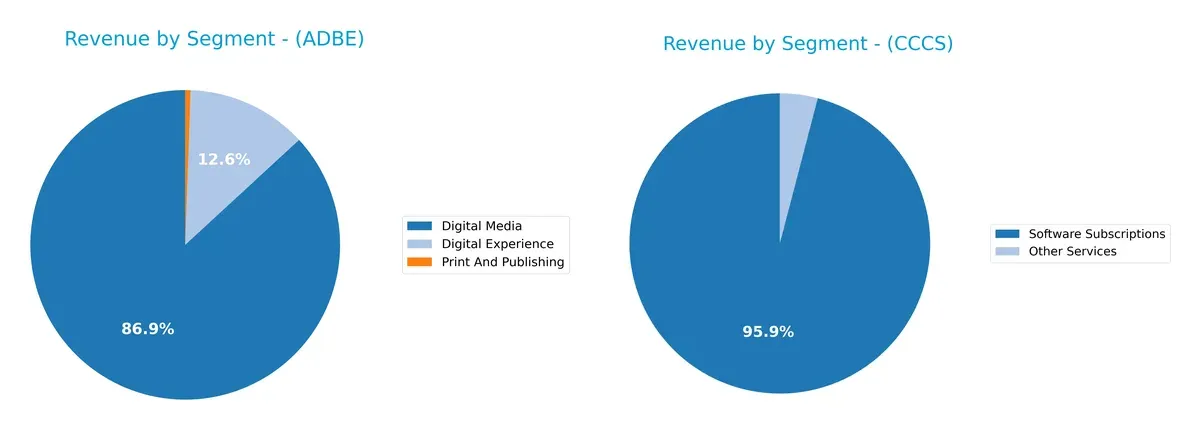
Adobe leans heavily on Digital Media, generating $40.4B in 2025, which dwarfs its Digital Experience ($5.9B) and Print ($256M). CCC pivots on Software Subscriptions, with $906M in 2024, supplemented modestly by Other Services ($38M). Adobe’s concentration in Digital Media signals strong ecosystem lock-in but higher reliance risk. CCC’s narrower base reflects infrastructure dominance but less diversification, exposing it to subscription market shifts.
Strengths and Weaknesses Comparison
This table compares the strengths and weaknesses of Adobe Inc. and CCC Intelligent Solutions Holdings Inc.:
Adobe Inc. Strengths
- Diversified revenue across Digital Media, Digital Experience, and Print segments
- Strong global presence with significant Americas and EMEA revenue
- High profitability with 30% net margin and 61.34% ROE
- Favorable debt metrics and strong interest coverage
- Efficient asset use indicated by fixed asset turnover of 10.88
CCC Intelligent Solutions Holdings Inc. Strengths
- Concentrated revenue in Software Subscriptions with steady growth
- Focused geographic presence primarily in Americas
- No detailed profitability or financial ratios available for deeper analysis
Adobe Inc. Weaknesses
- Current ratio at 1.0 signals potential liquidity risk
- High price-to-book ratio at 11.73 may indicate overvaluation
- Weighted average cost of capital (WACC) at 10.6% is unfavorable
- Zero dividend yield limits income for investors
CCC Intelligent Solutions Holdings Inc. Weaknesses
- Lack of disclosed financial ratios and profitability data limits transparency
- Narrow product and geographic diversification compared to peers
Adobe’s robust diversification and profitability contrast with CCC’s narrower focus and missing financial details. Adobe’s liquidity and valuation metrics warrant caution despite strong earnings. CCC’s limited data challenges comprehensive assessment, emphasizing the importance of transparency in strategic evaluation.
The Moat Duel: Analyzing Competitive Defensibility
A structural moat is the only true shield against profit erosion from relentless competition. Let’s dissect how these two firms defend their turf:
Adobe Inc.: Intangible Assets Powerhouse
Adobe’s moat hinges on its intangible assets—strong brand, creative software ecosystem, and subscription model. This manifests in a robust 37.6% EBIT margin and 26% ROIC above WACC, signaling durable value creation. New AI-driven tools and expanded cloud services in 2026 could deepen Adobe’s competitive edge.
CCC Intelligent Solutions: Niche Network Effects
CCC’s moat derives from network effects within the P&C insurance ecosystem, connecting insurers, repairers, and suppliers. Despite a smaller scale and lower margins (11.5% EBIT), CCC shows rapid growth in revenue and net margin, fueled by AI integration. Expansion into telematics and international markets could disrupt traditional workflows by 2026.
Moat Strength: Intangible Assets vs. Network Ecosystem
Adobe’s intangible asset moat is wider and more durable, supported by high ROIC and margin stability. CCC’s network effects offer promising growth but lack Adobe’s entrenched profitability. Adobe stands better poised to defend market share against new entrants over the long term.
Which stock offers better returns?
The past year reveals sharp declines for both stocks, with Adobe Inc. showing a steeper price drop and higher volatility compared to CCC Intelligent Solutions Holdings Inc.
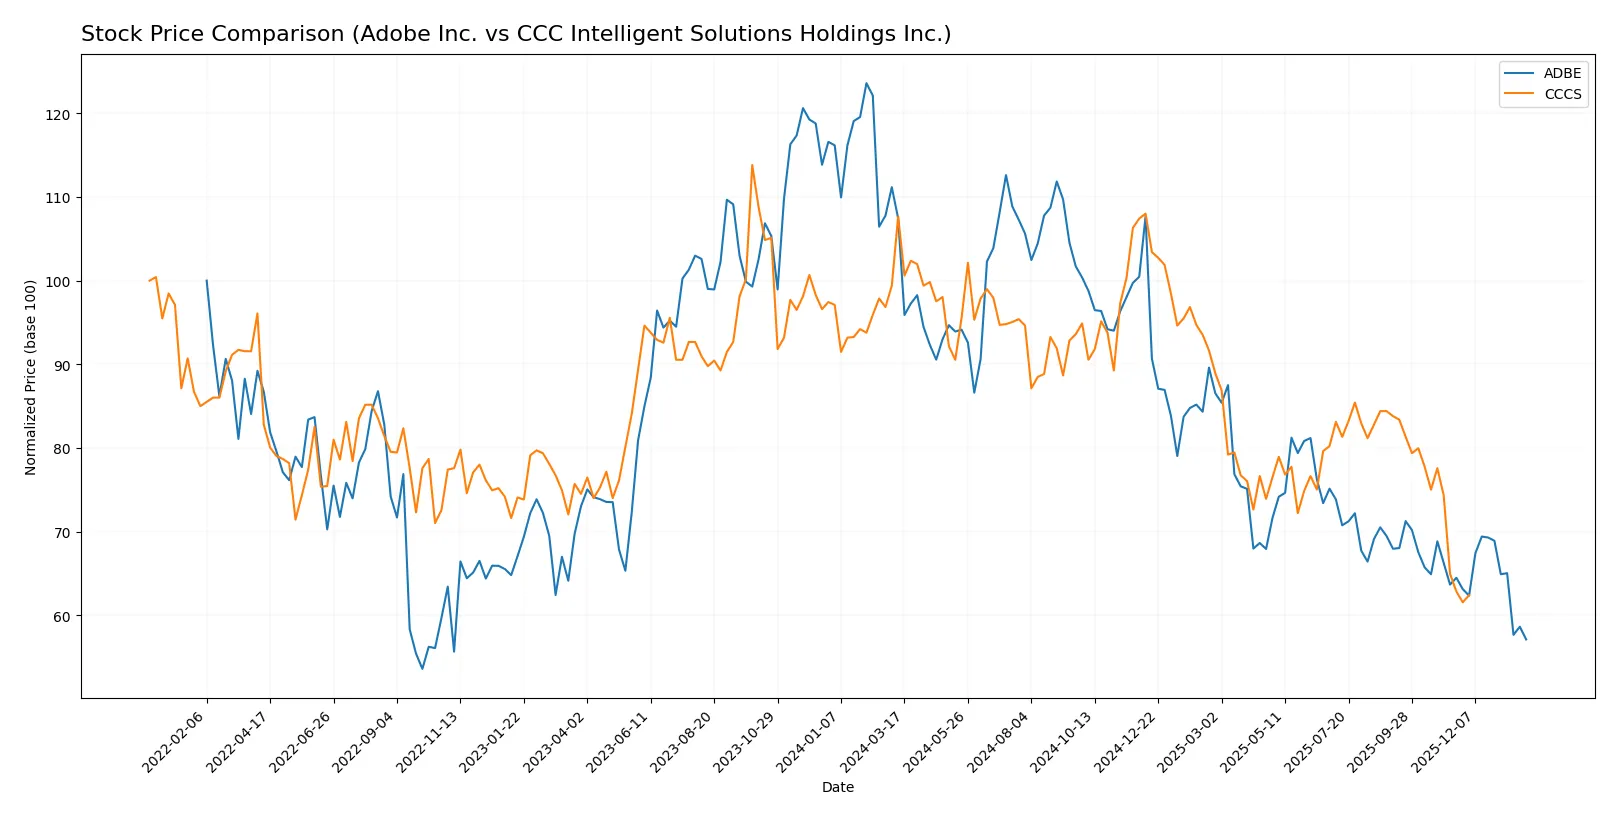
Trend Comparison
Adobe Inc. experienced a 46.85% price decrease over the past 12 months, marking a bearish trend with deceleration and a high volatility level at 78.57. Its price ranged between 578.34 and 293.25.
CCC Intelligent Solutions Holdings Inc. posted a 31.78% decline in the same period, reflecting a bearish and decelerating trend with low volatility at 1.24. The stock moved between 12.67 and 7.22.
Both stocks declined, but Adobe’s larger percentage drop and higher volatility indicate a weaker market performance relative to CCC Intelligent Solutions Holdings Inc.
Target Prices
Analysts anticipate a broad range of outcomes, with a clear upside potential for Adobe Inc. and a steady outlook for CCC Intelligent Solutions Holdings Inc.
| Company | Target Low | Target High | Consensus |
|---|---|---|---|
| Adobe Inc. | 280 | 500 | 390.31 |
| CCC Intelligent Solutions Holdings Inc. | 11 | 11 | 11 |
Adobe’s target consensus of 390.31 implies roughly a 33% upside from the current 293.25 price, signaling strong analyst confidence. CCC’s consensus target at 11 stands above its current 8.75 price, suggesting modest appreciation potential.

Don’t Let Luck Decide Your Entry Point
Optimize your entry points with our advanced ProRealTime indicators. You’ll get efficient buy signals with precise price targets for maximum performance. Start outperforming now!
How do institutions grade them?
The following presents the latest reliable institutional grades for the two companies:
Adobe Inc. Grades
This table summarizes recent grade changes and actions by reputable grading firms for Adobe Inc.
| Grading Company | Action | New Grade | Date |
|---|---|---|---|
| UBS | Maintain | Neutral | 2026-01-26 |
| Oppenheimer | Downgrade | Perform | 2026-01-13 |
| BMO Capital | Downgrade | Market Perform | 2026-01-09 |
| Jefferies | Downgrade | Hold | 2026-01-05 |
| Citigroup | Maintain | Neutral | 2025-12-17 |
| BMO Capital | Maintain | Outperform | 2025-12-15 |
| Keybanc | Downgrade | Underweight | 2025-12-15 |
| Wolfe Research | Maintain | Outperform | 2025-12-11 |
| TD Cowen | Maintain | Hold | 2025-12-11 |
| Oppenheimer | Maintain | Outperform | 2025-12-11 |
CCC Intelligent Solutions Holdings Inc. Grades
No reliable institutional grades are available for CCC Intelligent Solutions Holdings Inc.
Which company has the best grades?
Adobe Inc. has multiple grades ranging from Underweight to Outperform, with recent downgrades reflecting caution. CCC Intelligent Solutions lacks institutional grades, limiting comparative insight. Investors may view Adobe’s mixed grades as a signal to monitor evolving market sentiment closely.
Risks specific to each company
The following categories identify critical pressure points and systemic threats facing Adobe Inc. and CCC Intelligent Solutions Holdings Inc. in the 2026 market environment:
1. Market & Competition
Adobe Inc.
- Dominates software infrastructure with strong brand and diversified segments. Faces intense competition from global tech giants.
CCC Intelligent Solutions Holdings Inc.
- Operates in a niche insurance tech market but faces rising competition in SaaS and AI platforms.
2. Capital Structure & Debt
Adobe Inc.
- Maintains moderate debt-to-equity (0.57), favorable interest coverage (33.96), signaling solid debt management.
CCC Intelligent Solutions Holdings Inc.
- Limited data available; unknown leverage heightens uncertainty and risk assessment challenges.
3. Stock Volatility
Adobe Inc.
- Exhibits higher beta (1.526), suggesting greater sensitivity to market swings.
CCC Intelligent Solutions Holdings Inc.
- Lower beta (0.721) indicates more stable stock but less liquidity and trading activity.
4. Regulatory & Legal
Adobe Inc.
- Faces technology sector regulations and data privacy laws, but has robust compliance frameworks.
CCC Intelligent Solutions Holdings Inc.
- As an emerging SaaS provider in insurance, regulatory risks include evolving data and AI governance.
5. Supply Chain & Operations
Adobe Inc.
- Relies heavily on cloud infrastructure and global distribution networks; operational scalability is strong.
CCC Intelligent Solutions Holdings Inc.
- Dependent on partnerships within insurance ecosystem; disruptions in tech suppliers could impair growth.
6. ESG & Climate Transition
Adobe Inc.
- Invests in ESG initiatives with clear reporting; tech sector shifts toward sustainable cloud computing.
CCC Intelligent Solutions Holdings Inc.
- ESG profile less transparent; smaller scale and emerging market focus may limit immediate climate transition impact.
7. Geopolitical Exposure
Adobe Inc.
- Exposure to global markets and trade tensions; diversified presence mitigates country-specific risks.
CCC Intelligent Solutions Holdings Inc.
- Primarily US-focused, reducing geopolitical complexity but limiting international growth opportunities.
Which company shows a better risk-adjusted profile?
Adobe’s largest risk stems from market competition and elevated stock volatility due to its size and sector dynamics. CCC’s most impactful risk is financial opacity, with missing key financial ratios and weaker bankruptcy scores. Adobe displays a superior risk-adjusted profile, backed by strong financial metrics and stability. Notably, Adobe’s Altman Z-Score of 8.14 places it safely above distress levels, while CCC lingers in a grey zone at 2.18, underscoring heightened financial vulnerability.
Final Verdict: Which stock to choose?
Adobe Inc. stands out as a cash-generating powerhouse with a durable competitive advantage. Its impressive ROIC well above WACC signals efficient capital use and value creation. However, its near 1.0 current ratio is a point of vigilance, hinting at tight liquidity. Adobe suits an aggressive growth portfolio seeking sustained profitability.
CCC Intelligent Solutions commands a niche moat through its specialized industry focus and solid gross margins. Compared to Adobe, it offers greater balance sheet safety with a high current ratio but lags in profitability and financial strength scores. CCCS fits a GARP (Growth at a Reasonable Price) investor looking for potential upside with measured risk.
If you prioritize robust profitability and proven capital efficiency, Adobe outshines as the compelling choice with its strong moat and cash flow profile. However, if you seek cautious exposure to a smaller, specialized firm with a safer liquidity buffer, CCC Intelligent Solutions offers better stability despite weaker earnings. Each fits distinct investor profiles balancing growth and risk differently.
Disclaimer: Investment carries a risk of loss of initial capital. The past performance is not a reliable indicator of future results. Be sure to understand risks before making an investment decision.
Go Further
I encourage you to read the complete analyses of Adobe Inc. and CCC Intelligent Solutions Holdings Inc. to enhance your investment decisions: