Home > Comparison > Technology > ADBE vs XYZ
The strategic rivalry between Adobe Inc. and Block, Inc. shapes innovation in the technology sector. Adobe, a global software infrastructure leader, focuses on creative and digital experience platforms. In contrast, Block delivers integrated payment and commerce solutions, blending hardware with software services. This analysis explores their contrasting operational models and competitive dynamics to identify which company offers a superior risk-adjusted opportunity for a diversified portfolio in today’s evolving tech landscape.
Table of contents
Companies Overview
Adobe Inc. and Block, Inc. stand as pivotal players in the evolving software infrastructure market.
Adobe Inc.: Creative and Digital Experience Powerhouse
Adobe dominates as a diversified software infrastructure leader. It generates revenue primarily through its subscription-based Creative Cloud, a platform empowering content creation and marketing. In 2026, Adobe sharpened its strategic focus on integrating digital media with customer experience analytics, aiming to solidify its position in enterprise digital transformation.
Block, Inc.: Payment and Commerce Innovator
Block operates as a fintech and commerce software provider specializing in payment solutions. It earns revenue from hardware sales like card readers and software suites including Point of Sale and Cash App services. In 2026, Block emphasized expanding its ecosystem of merchant tools and consumer financial services across multiple countries to enhance transactional convenience.
Strategic Collision: Similarities & Divergences
Both companies excel in software infrastructure but diverge in business philosophy. Adobe adopts a closed, integrated platform merging creative tools and analytics, while Block pursues an open, hardware-software hybrid ecosystem in payments. Their primary battleground is digital commerce and customer engagement technology. Adobe offers a stable, enterprise-centric profile; Block carries higher volatility tied to consumer fintech innovation.
Income Statement Comparison
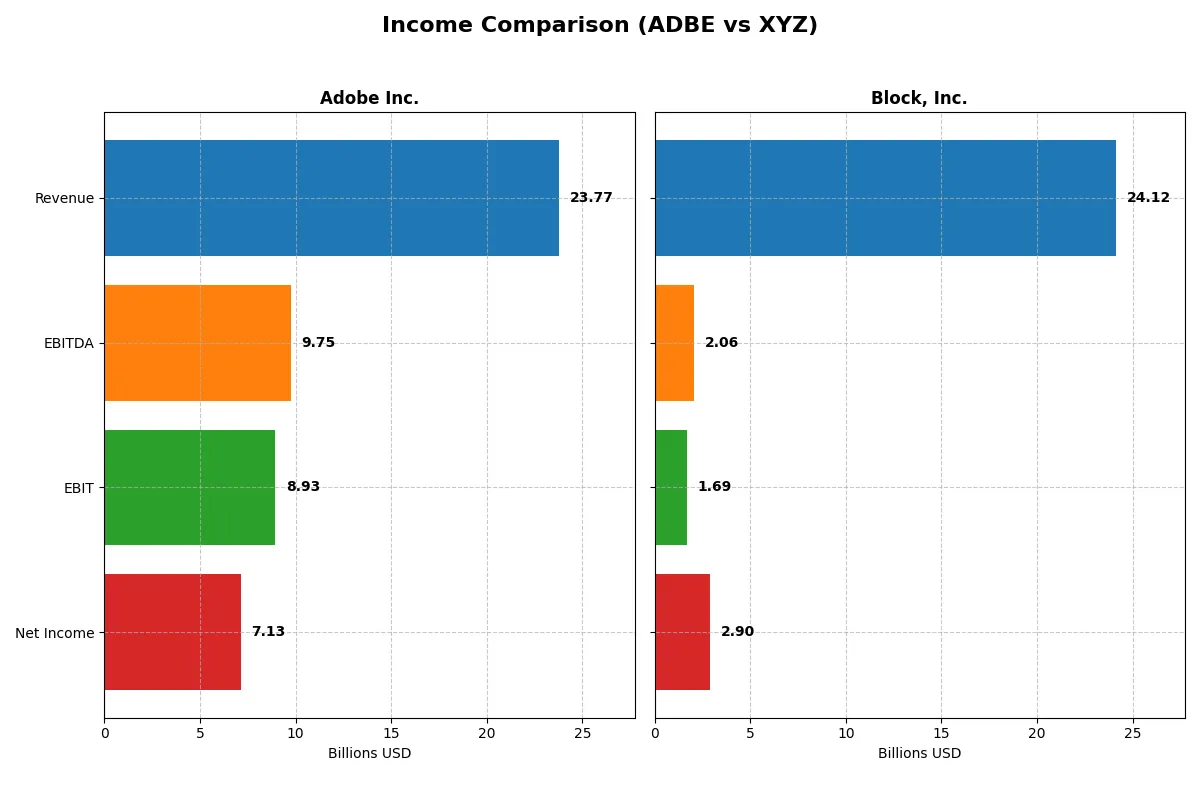
This data dissects the core profitability and scalability of both corporate engines to reveal who dominates the bottom line:
| Metric | Adobe Inc. (ADBE) | Block, Inc. (XYZ) |
|---|---|---|
| Revenue | 23.8B | 24.1B |
| Cost of Revenue | 2.7B | 15.2B |
| Operating Expenses | 12.4B | 8.0B |
| Gross Profit | 21.1B | 8.9B |
| EBITDA | 9.7B | 2.1B |
| EBIT | 8.9B | 1.7B |
| Interest Expense | 0.3B | 0.01B |
| Net Income | 7.1B | 2.9B |
| EPS | 16.73 | 4.7 |
| Fiscal Year | 2025 | 2024 |
Income Statement Analysis: The Bottom-Line Duel
This income statement comparison reveals the true efficiency and profitability of Adobe Inc. and Block, Inc.’s corporate engines over recent years.
Adobe Inc. Analysis
Adobe’s revenue rose steadily from 15.8B in 2021 to 23.8B in 2025, with net income climbing from 4.8B to 7.1B. Its gross margin remains robust at nearly 89%, and net margin holds a healthy 30%. In 2025, Adobe accelerated EBIT growth by 25.8%, demonstrating strong operational leverage and consistent margin control.
Block, Inc. Analysis
Block’s revenue surged impressively from 9.5B in 2020 to 24.1B in 2024, while net income rebounded from a 540M loss in 2022 to 2.9B profit in 2024. Gross margin improved to 36.9%, and net margin reached 12%. The 2024 year showed sharp momentum with EBIT growth exceeding 5800%, signaling a strong operational turnaround despite lower margin efficiency compared to Adobe.
Margin Mastery vs. Growth Acceleration
Adobe commands superior margin quality and steady profit growth, exemplifying operational excellence and capital efficiency. Block impresses with explosive top-line expansion and a dramatic net income recovery. For investors prioritizing consistent profitability and margin strength, Adobe’s profile is more attractive, while Block suits those favoring high-growth potential with improving margins.
Financial Ratios Comparison
These vital ratios act as a diagnostic tool to expose the underlying fiscal health, valuation premiums, and capital efficiency of the companies compared below:
| Ratios | Adobe Inc. (ADBE) | Block, Inc. (XYZ) |
|---|---|---|
| ROE | 61.3% | 13.6% |
| ROIC | 36.7% | 3.0% |
| P/E | 19.1 | 18.1 |
| P/B | 11.7 | 2.47 |
| Current Ratio | 1.00 | 2.33 |
| Quick Ratio | 1.00 | 2.31 |
| D/E (Debt-to-Equity) | 0.57 | 0.37 |
| Debt-to-Assets | 22.5% | 21.5% |
| Interest Coverage | 33.1 | 95.9 |
| Asset Turnover | 0.81 | 0.66 |
| Fixed Asset Turnover | 10.9 | 45.1 |
| Payout Ratio | 0 | 0 |
| Dividend Yield | 0 | 0 |
| Fiscal Year | 2025 | 2024 |
Efficiency & Valuation Duel: The Vital Signs
Financial ratios serve as a company’s DNA, exposing hidden risks and operational strengths that shape investment decisions.
Adobe Inc.
Adobe posts a robust 61.3% ROE and a 30% net margin, signaling strong profitability. Its P/E ratio at 19.1 suggests a fairly valued stock, though a high P/B ratio of 11.7 flags premium pricing. Adobe refrains from dividends, reinvesting heavily in R&D to fuel growth and innovation.
Block, Inc.
Block’s profitability is modest, with a 13.6% ROE and 12% net margin, reflecting operational challenges. The P/E of 18.1 appears reasonable, supported by a conservative P/B of 2.5. Block maintains no dividends but prioritizes balance sheet strength and operational efficiency, evidenced by a healthy current ratio above 2.3.
Balanced Strength vs. Growth Ambition
Adobe combines superior profitability with a premium valuation, reflecting its market leadership and reinvestment strategy. Block offers financial stability and reasonable valuation but lags in returns. Investors seeking operational excellence may favor Adobe, while those prioritizing balance sheet resilience might lean toward Block.
Which one offers the Superior Shareholder Reward?
I observe Adobe Inc. (ADBE) and Block, Inc. (XYZ) both forgo dividends, focusing on reinvestment and buybacks. Adobe yields no dividends but generates robust free cash flow of 23.1B in 2025, supporting sustainable buybacks. Block’s free cash flow lags drastically at 2.5B, reflecting weaker operating cash flow and margin pressures. Adobe’s payout through aggressive buybacks aligns with strong EBIT margins (~37.5%) and solid capital expenditure coverage, ensuring long-term value. Block, with lower margins (~7%) and volatile cash flow, shows less sustainable shareholder returns despite some buyback activity. I conclude Adobe offers the superior total shareholder reward in 2026.
Comparative Score Analysis: The Strategic Profile
The radar chart reveals the fundamental DNA and trade-offs of Adobe Inc. and Block, Inc., highlighting their strategic strengths and vulnerabilities:
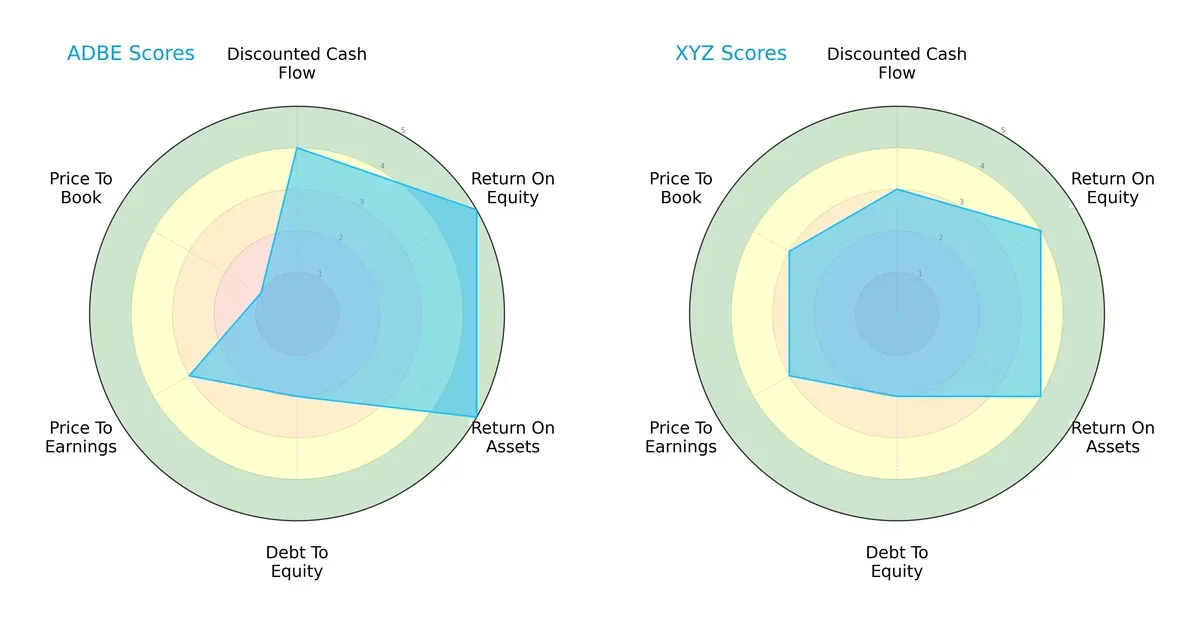
Adobe demonstrates a more balanced profile, excelling in ROE and ROA with top scores of 5 each, reflecting superior profitability and asset utilization. Block keeps pace in valuation metrics, boasting a stronger price-to-book score (3 vs. Adobe’s 1), indicating relative market favorability. Both share moderate debt-to-equity risk, but Adobe’s discounted cash flow score (4) slightly outperforms Block’s (3), underscoring better cash flow fundamentals.
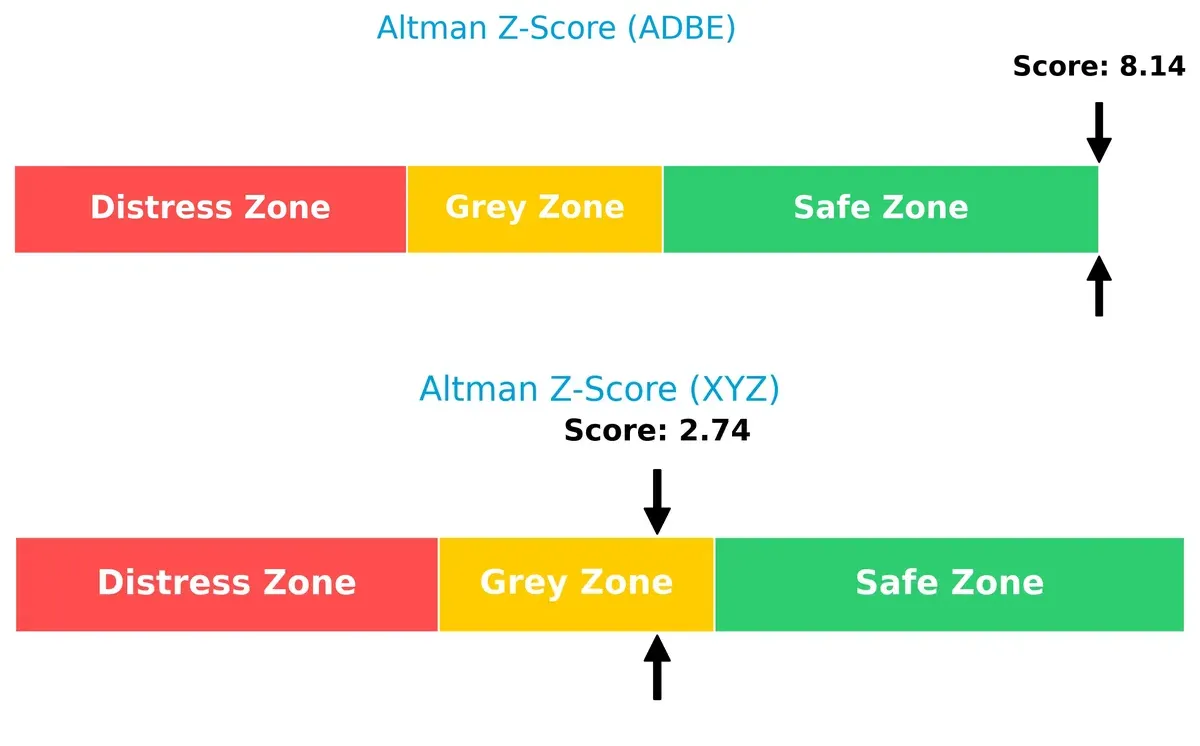
Bankruptcy Risk: Solvency Showdown
Adobe’s Altman Z-Score of 8.14 places it firmly in the safe zone, signaling robust financial stability. Block’s score of 2.74 falls in the grey zone, implying moderate risk of distress under current market conditions:
Financial Health: Quality of Operations
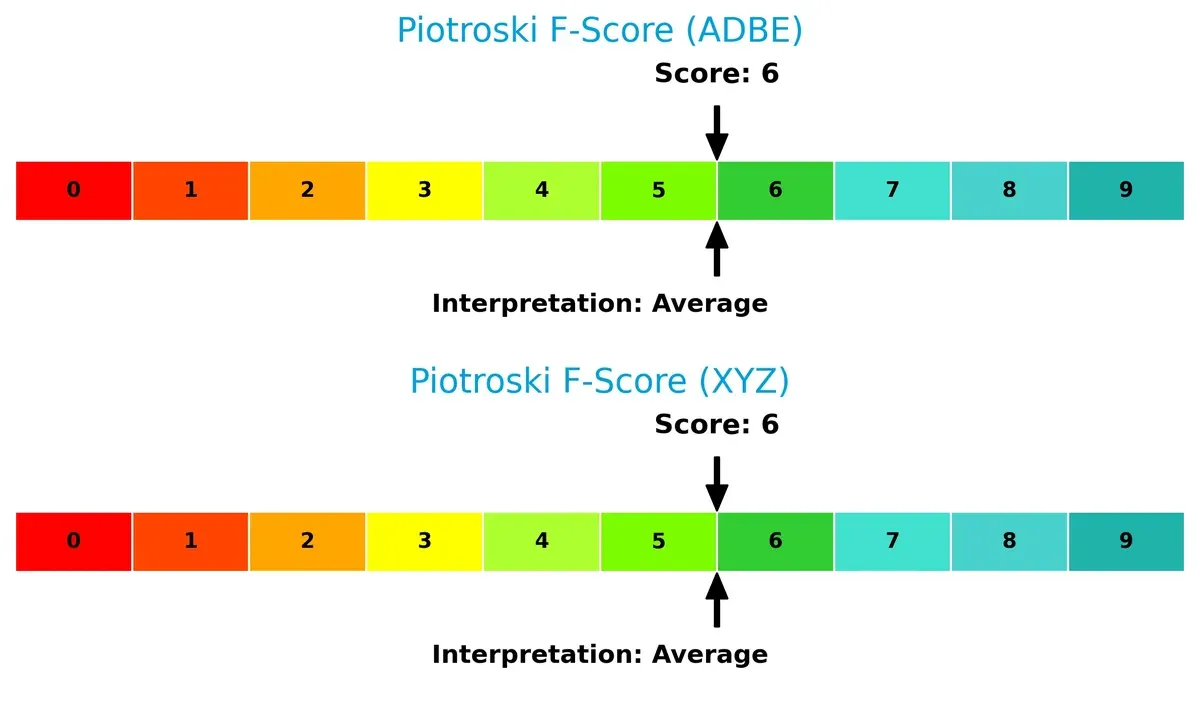
Both firms share identical Piotroski F-Scores of 6, indicating average financial health. Neither shows immediate red flags, but there remains room for operational improvement to reach peak financial strength:
How are the two companies positioned?
This section dissects the operational DNA of Adobe and Block by comparing their revenue distribution and internal dynamics. The goal is to confront their economic moats and identify which model delivers the most resilient competitive advantage today.
Revenue Segmentation: The Strategic Mix
This comparison dissects how Adobe Inc. and Block, Inc. diversify their income streams and highlights where each company places its primary sector bets:
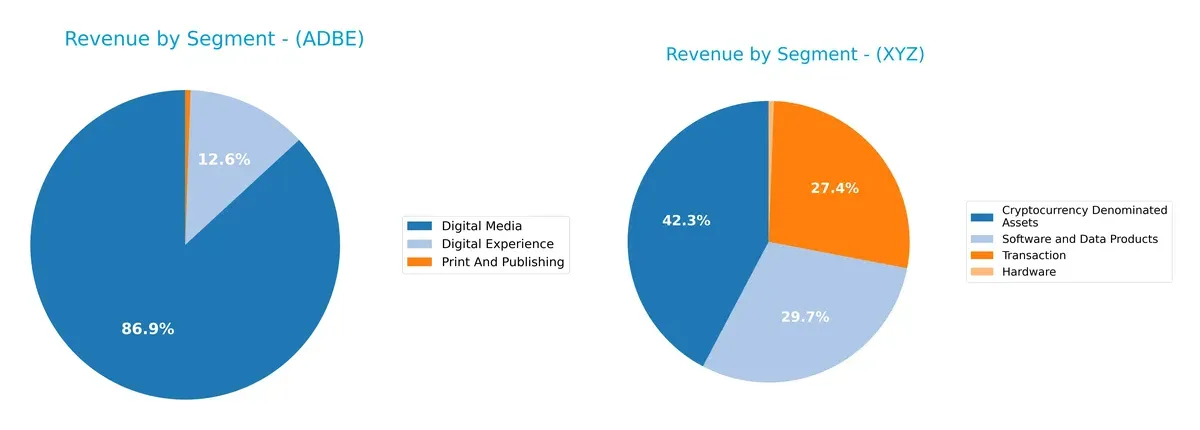
Adobe’s revenue pivots heavily on Digital Media, generating $40.4B in 2025, dwarfing its Digital Experience segment at $5.9B. This concentration underscores Adobe’s ecosystem lock-in via creative software dominance. Block, Inc. shows a more balanced model with $10.2B from Cryptocurrency assets, $7.2B in Software, and $6.6B in Transactions in 2024. Block’s mix reduces concentration risk but leans on volatile crypto exposure, posing strategic challenges.
Strengths and Weaknesses Comparison
This table compares the strengths and weaknesses of Adobe Inc. and Block, Inc.:
Adobe Inc. Strengths
- High net margin at 30%
- Strong ROE and ROIC well above WACC
- Diverse digital media and experience revenue streams
- Significant global presence in Americas and EMEA
- Favorable debt to assets and interest coverage ratios
- Strong fixed asset turnover
Block, Inc. Strengths
- Favorable net margin and interest coverage
- Strong current and quick liquidity ratios
- Moderate debt to equity and assets
- Diverse revenue including software, crypto assets, transactions
- Large U.S. market share with growing non-U.S. presence
- Outstanding fixed asset turnover
Adobe Inc. Weaknesses
- High WACC relative to ROIC
- Unfavorable current ratio at 1.0 raises liquidity concerns
- Unfavorable price-to-book ratio
- No dividend yield
- Concentrated geographic revenue less in Asia
- Neutral asset turnover and debt-to-equity
Block, Inc. Weaknesses
- Low ROIC below WACC signals poor capital efficiency
- Elevated WACC at 14.08%
- No dividend yield
- Relatively low ROE compared to peers
- Moderate asset turnover
- Heavy reliance on U.S. market revenue
Both companies exhibit slightly favorable financial profiles but face distinct challenges. Adobe’s profitability and global reach contrast with liquidity and valuation risks. Block shows strong liquidity and asset efficiency but struggles with capital returns and geographic concentration. These factors shape their strategic options going forward.
The Moat Duel: Analyzing Competitive Defensibility
A structural moat is the only defense long-term profits have against relentless competition erosion. Let’s examine the key moats of two tech giants:
Adobe Inc.: Intangible Assets Fortress
Adobe’s moat centers on its deep intangible assets, notably Creative Cloud’s subscription model. This drives stable high margins and ROIC well above W&P. In 2026, expanding AI-powered creative tools should deepen this moat.
Block, Inc.: Ecosystem and Network Effects
Block relies on its payment ecosystem and Cash App’s network effects, contrasting Adobe’s asset-heavy moat. While profitability lags, rapid revenue growth and expanding services signal strengthening competitive leverage and market disruption potential.
Ecosystem Scale vs. Intangible Asset Dominance
Adobe’s intangible asset moat is wider and more durable, reflected in its robust ROIC advantage (+26% over WACC). Block’s rising ecosystem effects show promise but currently lack Adobe’s value creation depth. Adobe stands better poised to defend its market share long term.
Which stock offers better returns?
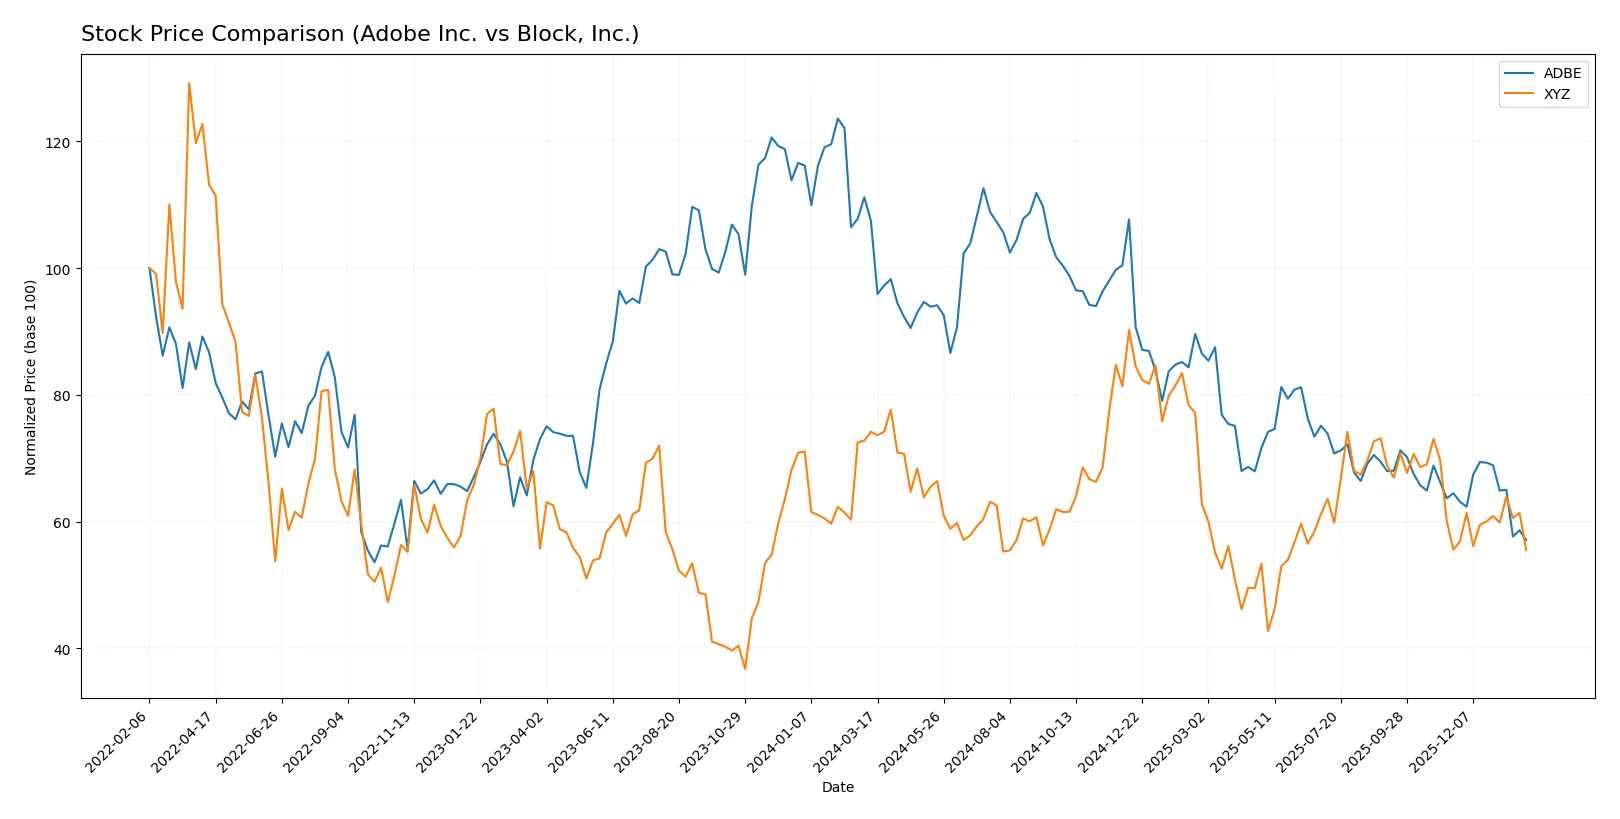
The past year shows a pronounced decline for both stocks, with Adobe Inc. suffering a steep drop and Block, Inc. experiencing a milder downturn amid shifting trading volumes.
Trend Comparison
Adobe Inc. shows a bearish trend over the last 12 months with a -46.85% price drop and decelerating losses, hitting a high of 578.34 and a low of 293.25. Volatility remains high with a standard deviation of 78.57.
Block, Inc. also trends bearish with a -25.15% decline over the same period but shows accelerating losses. It reached a high of 98.25 and a low of 46.53, with lower volatility at a 10.41 standard deviation.
Comparing both, Block, Inc. delivered a smaller negative return than Adobe, indicating a less severe market performance decline over the past year.
Target Prices
Analysts present a mixed but generally optimistic target consensus for Adobe Inc. and Block, Inc.
| Company | Target Low | Target High | Consensus |
|---|---|---|---|
| Adobe Inc. | 280 | 500 | 390.31 |
| Block, Inc. | 65 | 100 | 84.92 |
Adobe’s consensus target exceeds its current price by about 33%, reflecting strong growth expectations. Block’s target price is 40% above its present level, indicating significant upside potential despite recent volatility.

Don’t Let Luck Decide Your Entry Point
Optimize your entry points with our advanced ProRealTime indicators. You’ll get efficient buy signals with precise price targets for maximum performance. Start outperforming now!
How do institutions grade them?
The following tables summarize recent institutional grades for Adobe Inc. and Block, Inc.:
Adobe Inc. Grades
Below are the latest grades assigned by reputable financial institutions for Adobe Inc.
| Grading Company | Action | New Grade | Date |
|---|---|---|---|
| UBS | Maintain | Neutral | 2026-01-26 |
| Oppenheimer | Downgrade | Perform | 2026-01-13 |
| BMO Capital | Downgrade | Market Perform | 2026-01-09 |
| Jefferies | Downgrade | Hold | 2026-01-05 |
| Citigroup | Maintain | Neutral | 2025-12-17 |
| BMO Capital | Maintain | Outperform | 2025-12-15 |
| Keybanc | Downgrade | Underweight | 2025-12-15 |
| Wolfe Research | Maintain | Outperform | 2025-12-11 |
| TD Cowen | Maintain | Hold | 2025-12-11 |
| Oppenheimer | Maintain | Outperform | 2025-12-11 |
Block, Inc. Grades
This table presents recent institutional grades for Block, Inc. from recognized rating agencies.
| Grading Company | Action | New Grade | Date |
|---|---|---|---|
| Piper Sandler | Maintain | Underweight | 2026-01-14 |
| Keefe, Bruyette & Woods | Maintain | Outperform | 2026-01-02 |
| Needham | Maintain | Buy | 2025-11-24 |
| Morgan Stanley | Maintain | Equal Weight | 2025-11-21 |
| B of A Securities | Maintain | Buy | 2025-11-21 |
| Mizuho | Maintain | Outperform | 2025-11-20 |
| Stephens & Co. | Maintain | Overweight | 2025-11-20 |
| BTIG | Maintain | Buy | 2025-11-20 |
| RBC Capital | Maintain | Outperform | 2025-11-20 |
| BTIG | Maintain | Buy | 2025-11-14 |
Which company has the best grades?
Block, Inc. holds consistently higher ratings, predominantly Buy and Outperform, signaling stronger analyst confidence. Adobe Inc. shows mixed grades with recent downgrades, reflecting more cautious sentiment. Investors may interpret these differences as signals of relative near-term momentum and risk.
Risks specific to each company
The following categories identify critical pressure points and systemic threats facing both firms in the 2026 market environment:
1. Market & Competition
Adobe Inc.
- Dominates creative software with strong subscription model but faces intense SaaS competition.
Block, Inc.
- Leads in payment solutions but contends with evolving fintech rivals and rapid innovation cycles.
2. Capital Structure & Debt
Adobe Inc.
- Moderate leverage with D/E of 0.57 and favorable interest coverage at 34x.
Block, Inc.
- Lower leverage, D/E of 0.37, and very strong interest coverage of 181x, signaling robust balance sheet.
3. Stock Volatility
Adobe Inc.
- Beta of 1.53 indicates above-market volatility, typical for tech sector leaders.
Block, Inc.
- Higher beta at 2.67 reflects significant price swings, increasing trading risks.
4. Regulatory & Legal
Adobe Inc.
- Exposed to global data privacy regulations impacting digital media and cloud services.
Block, Inc.
- Faces complex financial regulations across multiple countries, with risks from payment processing compliance.
5. Supply Chain & Operations
Adobe Inc.
- Relies on cloud infrastructure providers; operational resilience depends on tech partnerships.
Block, Inc.
- Hardware manufacturing and logistics complexity add operational risk amid global supply challenges.
6. ESG & Climate Transition
Adobe Inc.
- Progressing on ESG goals with focus on sustainable software operations and carbon reduction.
Block, Inc.
- ESG efforts growing but hardware production and payments ecosystem carbon footprint remain concerns.
7. Geopolitical Exposure
Adobe Inc.
- Significant US and international market exposure; sensitive to US-China tech tensions.
Block, Inc.
- Global footprint includes sensitive regions; geopolitical instability could impact international operations.
Which company shows a better risk-adjusted profile?
Adobe’s most impactful risk is its high market volatility combined with an unfavorable current ratio of 1.0, signaling liquidity pressure. Block’s greatest risk lies in regulatory complexity and geopolitical exposure amid its higher beta of 2.67. Despite Adobe’s liquidity caution, its stronger profitability and safer Altman Z-score create a more balanced risk-adjusted profile. Block’s higher interest coverage and lower leverage are positives but do not fully offset its regulatory and volatility risks. Adobe’s 61% ROE versus Block’s 14% ROE further justifies preference for Adobe’s superior capital efficiency and resilience.
Final Verdict: Which stock to choose?
Adobe Inc. wields the superpower of exceptional capital efficiency, consistently delivering returns well above its cost of capital. Its robust profitability and durable moat signal a cash-generating powerhouse. A point of vigilance remains its tight liquidity position, which could pressure short-term flexibility. Adobe suits investors targeting aggressive growth with a tolerance for valuation premiums.
Block, Inc. benefits from a strategic moat rooted in strong balance sheet health and operational resilience, underpinned by solid liquidity and modest leverage. Though its returns trail Adobe’s, Block offers better financial stability and a more conservative risk profile. It fits well within a GARP (Growth at a Reasonable Price) portfolio seeking steady expansion without excessive risk.
If you prioritize high return on invested capital and value creation, Adobe stands out due to its superior profitability and economic moat. However, if you seek a safer balance sheet with steadier financial footing, Block offers better stability and a more moderate valuation. Both present analytical scenarios aligned with distinct investor profiles and risk appetites.
Disclaimer: Investment carries a risk of loss of initial capital. The past performance is not a reliable indicator of future results. Be sure to understand risks before making an investment decision.
Go Further
I encourage you to read the complete analyses of Adobe Inc. and Block, Inc. to enhance your investment decisions: