Home > Comparison > Technology > ADBE vs ADSK
The strategic rivalry between Adobe Inc. and Autodesk, Inc. shapes the evolution of the technology sector. Adobe dominates as a diversified software infrastructure leader with a vast digital media and experience platform. Autodesk excels in high-margin application software focused on 3D design and engineering solutions. This analysis contrasts their operational models and growth trajectories to identify which offers superior risk-adjusted returns for a diversified portfolio.

Table of contents
Companies Overview
Adobe Inc. and Autodesk, Inc. stand as pivotal players in the global software market, shaping creative and design workflows.
Adobe Inc.: The Creative Cloud Powerhouse
Adobe dominates the digital media and marketing software space. Its revenue stems primarily from Creative Cloud subscriptions and its Document Cloud platform. In 2026, Adobe focuses on expanding its Digital Experience segment, enhancing tools that help businesses optimize customer engagement and analytics.
Autodesk, Inc.: The 3D Design Innovator
Autodesk leads in 3D design, engineering, and construction software. It generates income through its suite of CAD and CAM solutions, including AutoCAD and BIM 360. The firm’s 2026 strategy centers on cloud-based collaboration tools to streamline workflows in architecture, manufacturing, and media industries.
Strategic Collision: Similarities & Divergences
Both companies invest heavily in subscription-based software, yet Adobe prioritizes content creation and digital marketing ecosystems, while Autodesk focuses on engineering and construction workflows. Their main battleground lies in serving creative professionals versus technical designers. This divergence creates distinct risk and growth profiles for investors eyeing innovation in software infrastructure versus application.
Income Statement Comparison
This data dissects the core profitability and scalability of both corporate engines to reveal who dominates the bottom line:
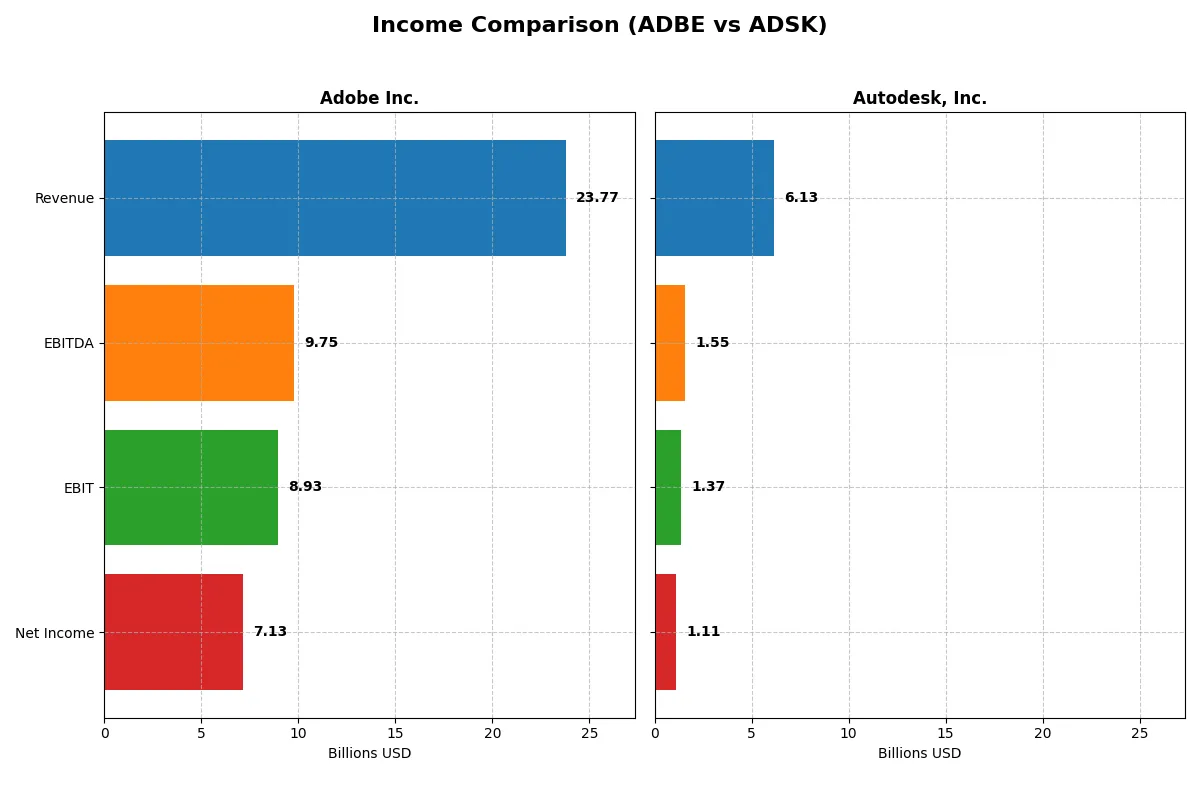
| Metric | Adobe Inc. (ADBE) | Autodesk, Inc. (ADSK) |
|---|---|---|
| Revenue | 23.8B | 6.13B |
| Cost of Revenue | 2.71B | 578M |
| Operating Expenses | 12.4B | 4.20B |
| Gross Profit | 21.1B | 5.55B |
| EBITDA | 9.75B | 1.55B |
| EBIT | 8.93B | 1.37B |
| Interest Expense | 263M | 0 |
| Net Income | 7.13B | 1.11B |
| EPS | 16.73 | 5.17 |
| Fiscal Year | 2025 | 2025 |
Income Statement Analysis: The Bottom-Line Duel
This comparison reveals how Adobe Inc. and Autodesk, Inc. translate revenue into profit, exposing each company’s operational efficiency.
Adobe Inc. Analysis
Adobe’s revenue climbed steadily from 15.8B in 2021 to 23.8B in 2025, with net income rising from 4.8B to 7.1B. Its gross margin remains robust at 88.6%, while net margin hits a strong 30%. In 2025, Adobe accelerated EBIT growth by 26%, showcasing impressive operational leverage and margin expansion.
Autodesk, Inc. Analysis
Autodesk’s revenue grew from 3.8B in 2021 to 6.1B in 2025, but net income fluctuated, peaking at 1.2B in 2021 and settling at 1.1B in 2025. Its gross margin is higher than Adobe’s at 90.6%, yet net margin lags at 18.1%. Autodesk improved EBIT by 21% in 2025, signaling solid momentum despite narrower bottom-line margins.
Margin Strength vs. Revenue Scale
Adobe clearly outperforms Autodesk in net income scale and margin efficiency, benefiting from superior profitability and operational control. Autodesk excels in gross margin but trails in converting revenue into net profit. For investors prioritizing profit quality and scale, Adobe’s profile offers a more compelling fundamental advantage.
Financial Ratios Comparison
These vital ratios act as a diagnostic tool to expose the underlying fiscal health, valuation premiums, and capital efficiency of the companies compared below:
| Ratios | Adobe Inc. (ADBE) | Autodesk, Inc. (ADSK) |
|---|---|---|
| ROE | 61.3% | 42.4% |
| ROIC | 36.7% | 18.0% |
| P/E | 19.1 | 60.2 |
| P/B | 11.7 | 25.5 |
| Current Ratio | 1.0 | 0.68 |
| Quick Ratio | 1.0 | 0.68 |
| D/E (Debt to Equity) | 0.57 | 0.98 |
| Debt-to-Assets | 22.5% | 23.6% |
| Interest Coverage | 33.1 | 0 (not available) |
| Asset Turnover | 0.81 | 0.57 |
| Fixed Asset Turnover | 10.9 | 21.4 |
| Payout ratio | 0 | 0 |
| Dividend yield | 0% | 0% |
| Fiscal Year | 2025 | 2025 |
Efficiency & Valuation Duel: The Vital Signs
Ratios act as the company’s DNA, revealing hidden risks and operational excellence beneath headline numbers.
Adobe Inc.
Adobe delivers a robust 61% ROE and a strong 30% net margin, signaling excellent profitability and capital efficiency. Its P/E at 19.13 appears fairly valued, though a high P/B of 11.73 flags a stretched equity price. Adobe reinvests heavily in R&D, prioritizing growth over dividends, which could fuel long-term shareholder value.
Autodesk, Inc.
Autodesk posts a solid 42% ROE and an 18% net margin, reflecting efficient operations but at a lower scale than Adobe. The stock trades at a steep P/E of 60.2 and a high P/B of 25.54, indicating an expensive valuation. Autodesk focuses on R&D investments rather than dividends, aiming to accelerate innovation-driven growth.
Premium Valuation vs. Operational Safety
Adobe offers a better balance between profitability and valuation, with a more reasonable price relative to earnings. Autodesk’s premium multiples elevate risk despite solid returns. Investors seeking operational safety may lean toward Adobe, while growth seekers might tolerate Autodesk’s valuation stretch.
Which one offers the Superior Shareholder Reward?
I observe that both Adobe Inc. (ADBE) and Autodesk, Inc. (ADSK) do not pay dividends, focusing on reinvestment and buybacks. Adobe’s free cash flow per share stands at $23.1B in 2025, nearly triple Autodesk’s $7B, enabling more aggressive buybacks. Adobe’s payout ratio is zero, yet its free cash flow coverage ratio nears 1, signaling strong cash generation supporting buybacks. Autodesk also maintains a zero payout but shows weaker operating cash flow ratios and higher leverage, raising sustainability concerns. Adobe’s buyback intensity, combined with robust margins (EBIT margin 37.6% vs. Autodesk’s 22.3%), underpins superior long-term shareholder value. I conclude Adobe offers the more attractive total return profile in 2026.
Comparative Score Analysis: The Strategic Profile
The radar chart reveals the fundamental DNA and trade-offs of Adobe Inc. and Autodesk, Inc., highlighting their core financial strengths and valuation differences:
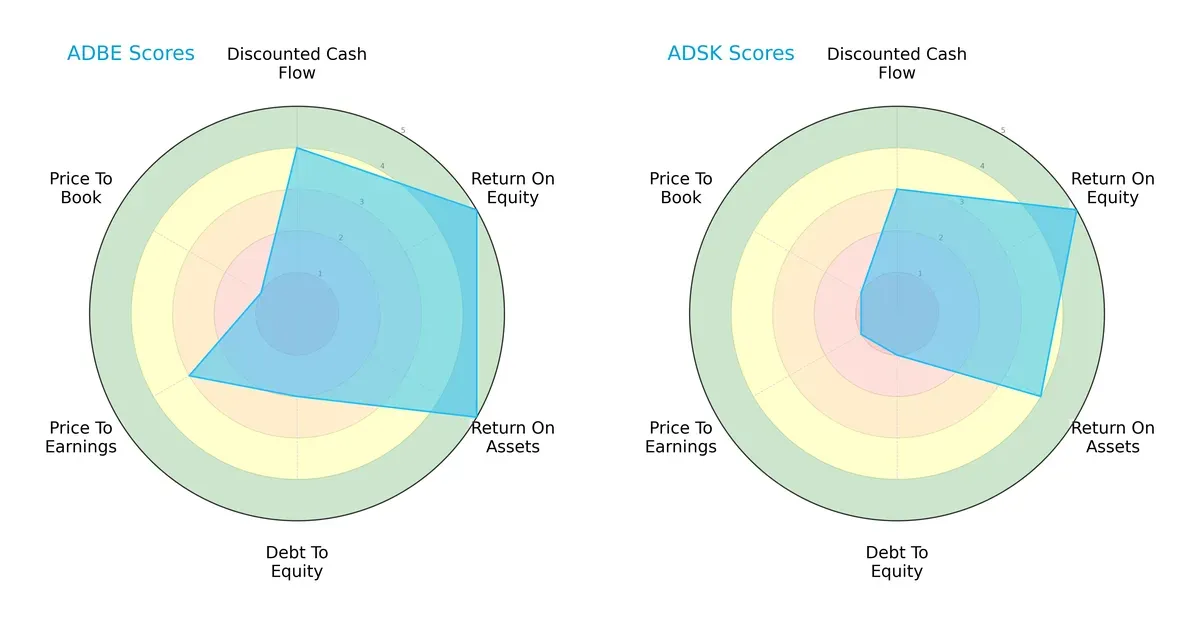
Adobe exhibits a more balanced profile with strong DCF (4), ROE (5), and ROA (5) scores. Autodesk matches Adobe’s ROE (5) but lags on DCF (3) and ROA (4). Adobe’s moderate Debt/Equity (2) contrasts with Autodesk’s weaker position (1). Valuation scores favor Adobe moderately, signaling a more stable investment foundation.
Bankruptcy Risk: Solvency Showdown
Adobe’s Altman Z-Score of 8.14 versus Autodesk’s 4.92 places both comfortably in the safe zone, but Adobe’s higher score implies superior long-term solvency and lower bankruptcy risk in this cycle:

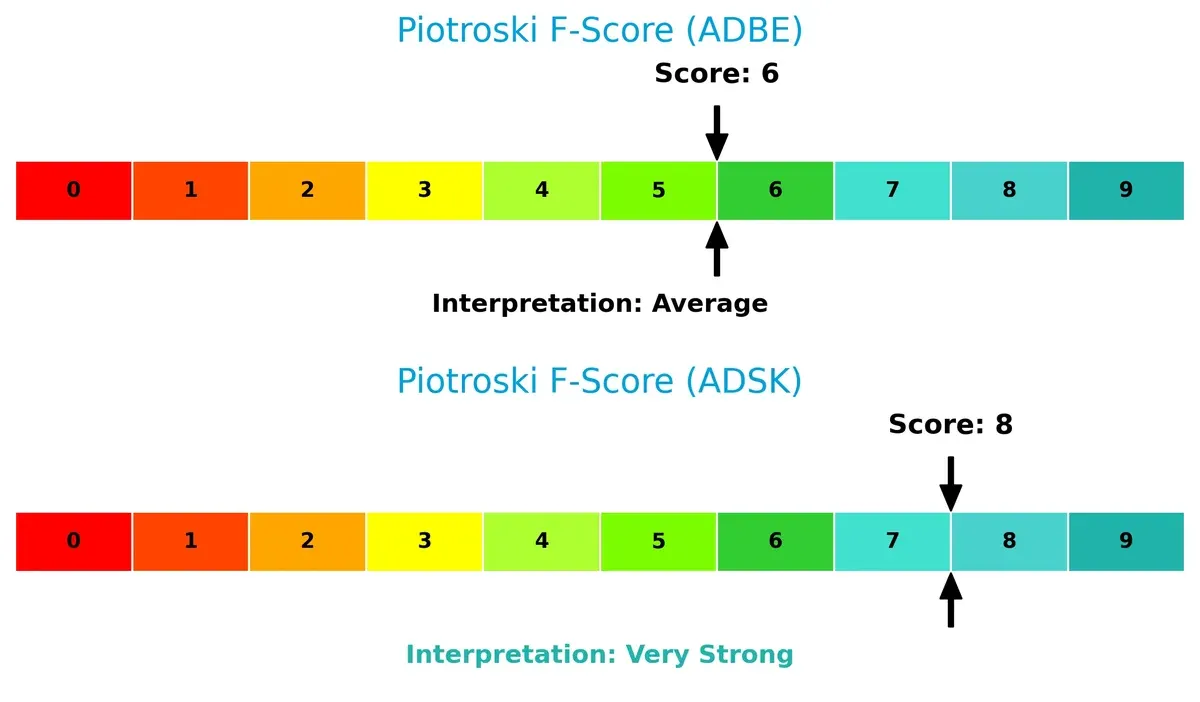
Financial Health: Quality of Operations
Autodesk’s Piotroski F-Score of 8 surpasses Adobe’s 6, signaling stronger internal financial health and fewer red flags. Adobe’s average score suggests moderate operational quality but some caution remains:
How are the two companies positioned?
This section dissects Adobe and Autodesk’s operational DNA by comparing revenue distribution and internal dynamics. The goal is to confront their economic moats and identify which model offers the most resilient, sustainable competitive advantage today.
Revenue Segmentation: The Strategic Mix
This visual comparison dissects how Adobe Inc. and Autodesk, Inc. diversify their income streams and where their primary sector bets lie:

Adobe’s revenue pivots heavily on Digital Media with $40.4B in 2025, dwarfing its Digital Experience segment at $5.9B. Autodesk shows a more balanced portfolio, anchoring on Architecture Engineering and Construction at $2.9B, with significant contributions from AutoCAD ($1.6B) and Manufacturing ($1.2B). Adobe’s concentration signals strong ecosystem lock-in but higher segment risk, while Autodesk’s mix spreads infrastructure dominance across multiple verticals, reducing single-market exposure.
Strengths and Weaknesses Comparison
This table compares the Strengths and Weaknesses of Adobe Inc. and Autodesk, Inc.:
Adobe Inc. Strengths
- Strong profitability with 30% net margin and 61.34% ROE
- Favorable ROIC at 36.69% surpassing WACC
- Solid debt management with 22.54% debt-to-assets
- Diverse product segments led by Digital Media $40.4B
- Significant global presence, especially in Americas $14.1B and EMEA $6.3B
- High fixed asset turnover of 10.88 indicating operational efficiency
Autodesk, Inc. Strengths
- Favorable profitability with 18.14% net margin and 42.43% ROE
- Positive ROIC at 18.01% above WACC
- Infinite interest coverage ratio signaling strong ability to service debt
- Well-diversified revenue streams across Architecture, AutoCAD, Manufacturing
- Substantial geographic reach in Americas $2.7B, EMEA $2.3B, Asia Pacific $1.1B
- Exceptional fixed asset turnover at 21.44 showing asset utilization
Adobe Inc. Weaknesses
- Unfavorable WACC at 10.6% may pressure capital costs
- Low current ratio of 1.0 signals tight short-term liquidity
- High price-to-book ratio 11.73 possibly indicating overvaluation
- No dividend yield limiting income investor appeal
- Moderate asset turnover at 0.81 below industry leaders
Autodesk, Inc. Weaknesses
- Unfavorable WACC at 10.38% raises capital cost concerns
- Weak liquidity with 0.68 current and quick ratios below 1
- High P/E ratio of 60.2 could indicate overvaluation risk
- Elevated price-to-book at 25.54 suggesting overpricing
- No dividend yield limiting shareholder returns
Overall, Adobe demonstrates robust profitability and operational efficiency with diversified revenue and strong global reach, yet liquidity and valuation metrics warrant caution. Autodesk shows solid profitability and excellent asset use but faces greater liquidity constraints and valuation risks. Both companies must balance growth investments with prudent financial management to sustain competitive positioning.
The Moat Duel: Analyzing Competitive Defensibility
A structural moat alone shields long-term profits from relentless competitive pressure and market disruption. Here’s how Adobe and Autodesk defend their turf:
Adobe Inc.: Ecosystem Lock-in Through Intangible Assets
Adobe’s moat stems from its dominant Creative Cloud ecosystem and brand reputation. This drives high ROIC (26%) and margin stability (30% net margin). In 2026, expanding Digital Experience offerings could deepen this lead or face disruption from emerging AI tools.
Autodesk, Inc.: Switching Costs in Specialized Design Software
Autodesk’s moat relies on switching costs embedded in its CAD and BIM software suites. Its ROIC advantage (7.6% above WACC) reflects sustained value creation but lower margins than Adobe. Growth in cloud-based construction management offers new expansion but intensifies competitive dynamics.
Moat Strength: Ecosystem Lock-in vs. Switching Costs
Adobe’s wider moat outperforms Autodesk’s narrower switching cost advantage. Adobe’s higher value creation and ecosystem integration better defend market share against new entrants and innovation threats.
Which stock offers better returns?
The past year shows contrasting trajectories: Adobe Inc. faces a pronounced decline, while Autodesk, Inc. maintains a modest positive shift amid decelerating momentum.

Trend Comparison
Adobe Inc. shows a 46.85% price decline over the past 12 months, marking a bearish trend with decelerating losses; the stock hit a high of 578.34 and a low of 293.25.
Autodesk, Inc. posts a 0.4% price increase over the same period, indicating a bullish but decelerating trend; the price fluctuated between 201.6 and 326.37.
Adobe’s bearish trend contrasts with Autodesk’s slight bullish movement, with Autodesk delivering the higher market performance in the last year.
Target Prices
Analysts present a bullish consensus for Adobe Inc. and Autodesk, Inc., showing significant upside potential from current prices.
| Company | Target Low | Target High | Consensus |
|---|---|---|---|
| Adobe Inc. | 280 | 500 | 390.31 |
| Autodesk, Inc. | 343 | 400 | 373 |
Adobe’s consensus target of 390 implies a 33% upside from its 293 current price. Autodesk’s 373 target suggests a 48% gain from 253. Both stocks show robust analyst confidence.

Don’t Let Luck Decide Your Entry Point
Optimize your entry points with our advanced ProRealTime indicators. You’ll get efficient buy signals with precise price targets for maximum performance. Start outperforming now!
How do institutions grade them?
Adobe Inc. Grades
The table below summarizes recent institutional grades for Adobe Inc.:
| Grading Company | Action | New Grade | Date |
|---|---|---|---|
| UBS | Maintain | Neutral | 2026-01-26 |
| Oppenheimer | Downgrade | Perform | 2026-01-13 |
| BMO Capital | Downgrade | Market Perform | 2026-01-09 |
| Jefferies | Downgrade | Hold | 2026-01-05 |
| Citigroup | Maintain | Neutral | 2025-12-17 |
| BMO Capital | Maintain | Outperform | 2025-12-15 |
| Keybanc | Downgrade | Underweight | 2025-12-15 |
| Wolfe Research | Maintain | Outperform | 2025-12-11 |
| TD Cowen | Maintain | Hold | 2025-12-11 |
| Oppenheimer | Maintain | Outperform | 2025-12-11 |
Autodesk, Inc. Grades
The table below summarizes recent institutional grades for Autodesk, Inc.:
| Grading Company | Action | New Grade | Date |
|---|---|---|---|
| Macquarie | Maintain | Outperform | 2025-11-26 |
| BMO Capital | Maintain | Market Perform | 2025-11-26 |
| Wells Fargo | Maintain | Overweight | 2025-11-26 |
| Deutsche Bank | Upgrade | Buy | 2025-11-26 |
| Rosenblatt | Maintain | Buy | 2025-11-26 |
| Baird | Maintain | Outperform | 2025-11-26 |
| B of A Securities | Maintain | Neutral | 2025-11-26 |
| Barclays | Maintain | Overweight | 2025-11-26 |
| Rosenblatt | Maintain | Buy | 2025-11-24 |
| Baird | Maintain | Outperform | 2025-11-18 |
Which company has the best grades?
Autodesk, Inc. holds generally stronger grades, including multiple Buy and Outperform ratings. Adobe Inc. shows more downgrades and Neutral to Hold ratings. These differences may affect investor confidence and portfolio positioning.
Risks specific to each company
In the challenging 2026 market environment, the following categories identify critical pressure points and systemic threats facing Adobe Inc. and Autodesk, Inc.:
1. Market & Competition
Adobe Inc.
- Dominates diversified software infrastructure with strong Creative Cloud brand but faces intense competition in digital experience platforms.
Autodesk, Inc.
- Specializes in 3D design and engineering software with niche leadership but confronts rising rivals in cloud-based construction and manufacturing tools.
2. Capital Structure & Debt
Adobe Inc.
- Maintains moderate leverage (D/E 0.57) with favorable interest coverage (33.96), signaling solid debt management.
Autodesk, Inc.
- Higher leverage (D/E 0.98) and neutral debt-to-assets ratio, increasing financial risk despite infinite interest coverage.
3. Stock Volatility
Adobe Inc.
- Beta at 1.53 indicates above-market volatility, typical for tech infrastructure firms in growth phases.
Autodesk, Inc.
- Beta of 1.47 reflects significant volatility, consistent with software application sector dynamics.
4. Regulatory & Legal
Adobe Inc.
- Operates globally with exposure to evolving data privacy and software compliance regulations.
Autodesk, Inc.
- Faces regulatory scrutiny in specialized software markets, particularly in construction and manufacturing sectors.
5. Supply Chain & Operations
Adobe Inc.
- Relies on cloud infrastructure providers; risks include service disruptions and cybersecurity threats.
Autodesk, Inc.
- Dependent on cloud services and third-party resellers; operational risks linked to software delivery and updates.
6. ESG & Climate Transition
Adobe Inc.
- Increasing ESG commitments amid stakeholder pressure; must navigate carbon footprint of data centers.
Autodesk, Inc.
- ESG initiatives growing; emphasis on sustainable design software but faces challenges in measuring impact.
7. Geopolitical Exposure
Adobe Inc.
- Global footprint exposes it to trade tensions, sanctions, and IP risks in key markets like China.
Autodesk, Inc.
- Similar exposure with concentration in North America and Europe; geopolitical risks moderate but persistent.
Which company shows a better risk-adjusted profile?
Adobe Inc. holds a stronger risk-adjusted profile. Its most impactful risk is market competition in digital experience, where rapid innovation demands agility. Autodesk’s principal risk lies in capital structure, with near doubling leverage increasing vulnerability. Adobe’s Altman Z-score of 8.14 versus Autodesk’s 4.92 underscores superior financial safety. Additionally, Adobe’s stable interest coverage mitigates debt risks that concern Autodesk investors.
Final Verdict: Which stock to choose?
Adobe Inc. wields unmatched efficiency, consistently converting invested capital into high returns. Its durable moat is evident in a robust ROIC comfortably above WACC, signaling value creation. A point of vigilance is its current ratio near 1, implying tighter liquidity. Adobe suits aggressive growth portfolios focusing on profitability and scale.
Autodesk, Inc. commands a strategic moat through its specialized engineering software dominance and recurring revenue model. It offers a safer profile than Adobe with a very strong Piotroski score, despite a weaker liquidity position and higher valuation multiples. Autodesk fits Growth at a Reasonable Price (GARP) investors seeking steady innovation and resilience.
If you prioritize superior capital efficiency and strong profitability with scale, Adobe outshines as the compelling choice due to its durable competitive advantage and value creation. However, if you seek better stability and a more conservative growth profile, Autodesk offers a safer investment with a solid financial strength score, albeit at a premium valuation. Both have merits but cater to different investor avatars.
Disclaimer: Investment carries a risk of loss of initial capital. The past performance is not a reliable indicator of future results. Be sure to understand risks before making an investment decision.
Go Further
I encourage you to read the complete analyses of Adobe Inc. and Autodesk, Inc. to enhance your investment decisions: