Home > Comparison > Technology > ADBE vs ARQQ
The strategic rivalry between Adobe Inc. and Arqit Quantum Inc. shapes the evolving landscape of technology infrastructure software. Adobe, a diversified software powerhouse, excels in digital media and experience platforms, while Arqit pioneers quantum-enabled cybersecurity solutions with a lean, innovative model. This head-to-head contrasts mature scale against emerging disruption. This analysis will identify which trajectory offers superior risk-adjusted returns for investors seeking durable growth in a dynamic sector.
Table of contents
Companies Overview
Adobe Inc. and Arqit Quantum Inc. lead crucial segments of the software infrastructure space with distinct market footprints.
Adobe Inc.: Global Leader in Creative and Digital Experience Software
Adobe dominates software infrastructure through its Creative Cloud subscription, powering digital content creation worldwide. Its core revenue stems from digital media products that serve individuals and enterprises alike. In 2026, Adobe’s strategic focus sharpened on expanding its Digital Experience segment, enhancing brand analytics and commerce capabilities to deepen customer engagement.
Arqit Quantum Inc.: Innovator in Quantum Cybersecurity Solutions
Arqit Quantum positions itself in cybersecurity by leveraging QuantumCloud encryption technology delivered via satellite and terrestrial platforms. Its revenue model revolves around licensing lightweight software agents that enable secure communications between devices. In 2026, Arqit concentrated on scaling its platform adoption across diverse industries to fortify data protection amid escalating cyber threats.
Strategic Collision: Similarities & Divergences
Both companies emphasize software infrastructure but diverge sharply in approach: Adobe builds a broad creative and marketing ecosystem, while Arqit pioneers niche quantum cybersecurity. Their battleground lies in enterprise security and data integrity, where innovation defines competitive edge. Adobe offers a stable, diversified profile; Arqit presents a high-beta, high-growth proposition shaped by emerging quantum technologies.
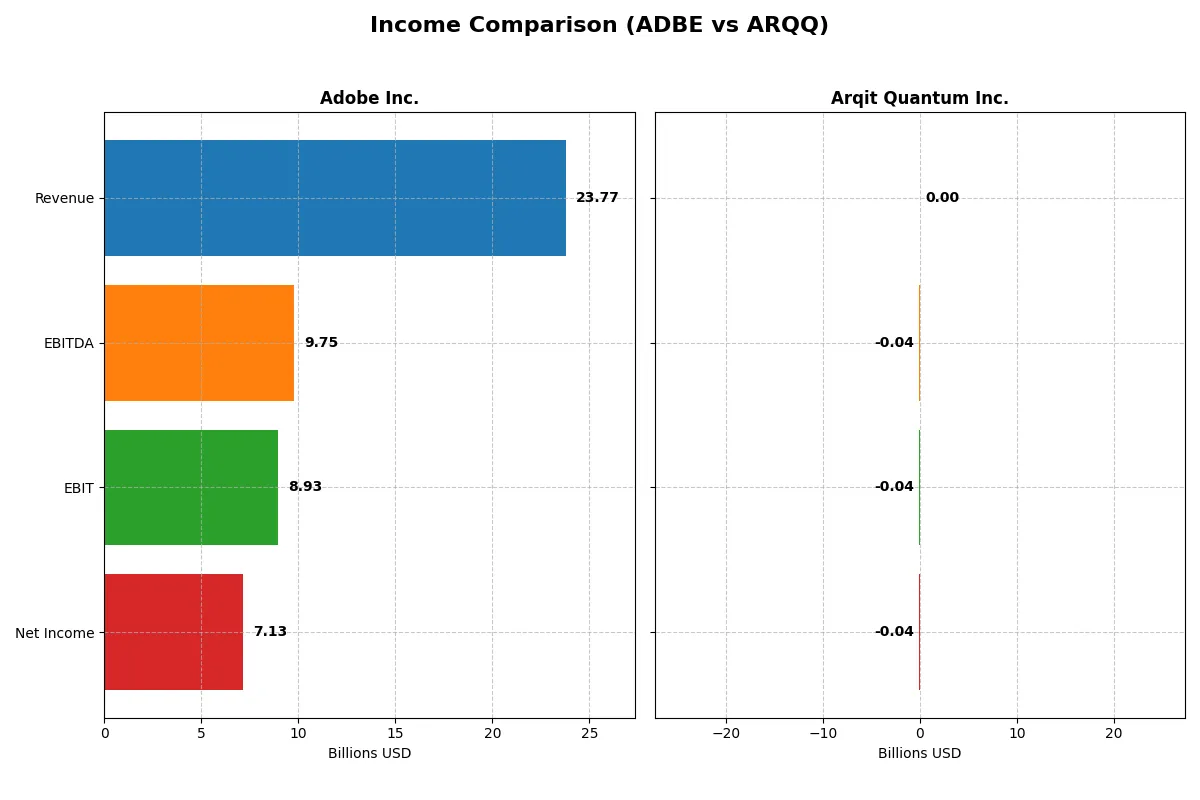
Income Statement Comparison
This data dissects the core profitability and scalability of both corporate engines to reveal who dominates the bottom line:
| Metric | Adobe Inc. (ADBE) | Arqit Quantum Inc. (ARQQ) |
|---|---|---|
| Revenue | 23.8B | 530K |
| Cost of Revenue | 2.71B | 760K |
| Operating Expenses | 12.36B | 38.74M |
| Gross Profit | 21.06B | -230K |
| EBITDA | 9.75B | -36.8M |
| EBIT | 8.93B | -37.6M |
| Interest Expense | 263M | 48K |
| Net Income | 7.13B | -35.3M |
| EPS | 16.73 | -2.56 |
| Fiscal Year | 2025 | 2025 |
Income Statement Analysis: The Bottom-Line Duel
This income statement comparison reveals the true efficiency and profitability of each company’s business engine in 2025.
Adobe Inc. Analysis
Adobe’s revenue climbed steadily from 15.8B in 2021 to 23.8B in 2025, with net income rising from 4.8B to 7.1B. Its gross margin remains robust at 88.6%, while the net margin holds a healthy 30%. The 2025 figures show strong momentum, with EBIT growing 25.8% year-over-year and EPS surging 35.1%, signaling operational efficiency and solid profitability.
Arqit Quantum Inc. Analysis
Arqit Quantum’s revenue remains under 1M in 2025 but surged 80.9% compared to 2024. Despite this, it posts a negative gross margin of -43.4% and a deeply negative net margin of -6668.5%, reflecting ongoing losses. The net income loss narrowed from -54.6M in 2024 to -35.3M in 2025, showing improving cost control but persistent unprofitability typical of early-stage ventures.
Margin Strength vs. Growth Struggles
Adobe dominates with high and stable margins, strong revenue growth, and expanding profits. Arqit Quantum shows remarkable revenue growth but remains heavily unprofitable with negative margins. Adobe’s profile offers a clear fundamental strength in profitability, making it more attractive for investors seeking efficiency and earnings stability. Arqit suits those focused on speculative growth despite high risk.
Financial Ratios Comparison
These vital ratios act as a diagnostic tool to expose the underlying fiscal health, valuation premiums, and capital efficiency of the companies compared below:
| Ratios | Adobe Inc. (ADBE) | Arqit Quantum Inc. (ARQQ) |
|---|---|---|
| ROE | 61.3% | -129.8% |
| ROIC | 36.7% | -127.5% |
| P/E | 19.1 | -15.1 |
| P/B | 11.7 | 19.6 |
| Current Ratio | 1.0 | 2.7 |
| Quick Ratio | 1.0 | 2.7 |
| D/E | 0.57 | 0.03 |
| Debt-to-Assets | 22.5% | 1.7% |
| Interest Coverage | 33.1 | -802.9 |
| Asset Turnover | 0.81 | 0.01 |
| Fixed Asset Turnover | 10.9 | 0.74 |
| Payout ratio | 0 | 0 |
| Dividend yield | 0 | 0 |
| Fiscal Year | 2025 | 2025 |
Efficiency & Valuation Duel: The Vital Signs
Financial ratios serve as the company’s DNA, revealing hidden risks and operational excellence behind headline figures.
Adobe Inc.
Adobe delivers robust profitability with a 61.3% ROE and a 30% net margin, signaling operational strength. Its P/E ratio at 19.1 remains neutral, suggesting valuation is fairly balanced, not stretched. Adobe returns value mainly through reinvestment in R&D, supporting sustained growth over dividends, reflecting a long-term capital allocation focus.
Arqit Quantum Inc.
Arqit suffers from deeply negative profitability, with ROE at -129.8% and a net margin plunging below -6600%, indicating severe operational distress. Although its P/E is technically favorable at -15.1 due to losses, other metrics show inefficiency. Arqit maintains strong liquidity and low leverage but offers no dividends, focusing on survival and growth investment amid significant financial headwinds.
Profitability Strength vs. Liquidity Safety
Adobe balances solid profitability and reasonable valuation, offering a safer risk-reward profile. Arqit’s extreme losses and valuation disconnect highlight higher risk despite strong liquidity. Investors favoring stable returns and operational efficiency align with Adobe, while those seeking speculative growth amid uncertainty may consider Arqit.
Which one offers the Superior Shareholder Reward?
Adobe Inc. (ADBE) and Arqit Quantum Inc. (ARQQ) both forgo dividends, relying on reinvestment and buybacks for shareholder returns. Adobe boasts robust free cash flow of 23B per share and no dividend payout, enabling aggressive share repurchases that sustain value. Arqit, meanwhile, reports massive losses and negative free cash flow, with no buyback capacity. Adobe’s distribution model via strong cash flows and buybacks offers sustainable, superior total shareholder return in 2026, unlike Arqit’s high-risk, cash-burning stance. I favor Adobe for disciplined capital allocation and long-term value creation.
Comparative Score Analysis: The Strategic Profile
The radar chart reveals the fundamental DNA and trade-offs of Adobe Inc. and Arqit Quantum Inc., illustrating their contrasting financial strengths and vulnerabilities:
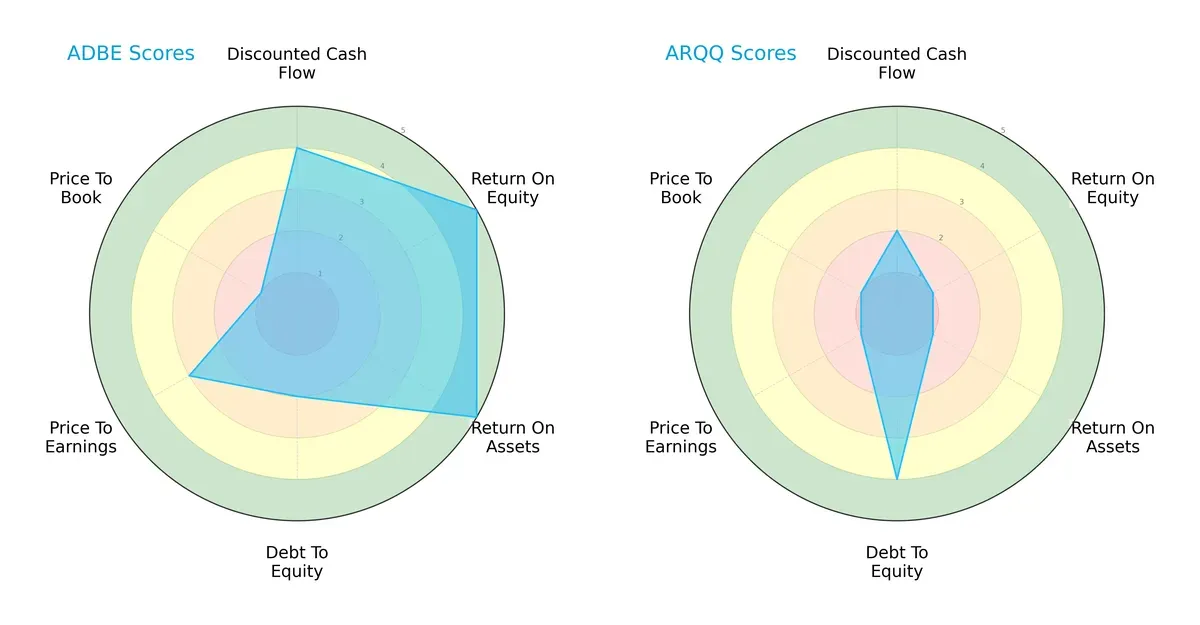
Adobe Inc. demonstrates a balanced profile with high ROE (5) and ROA (5), indicating efficient profit generation and asset utilization. It shows moderate leverage risk (Debt/Equity score 2) and reasonable valuation metrics (PE 3, albeit a very unfavorable PB 1). In contrast, Arqit Quantum relies heavily on a low debt load (Debt/Equity 4) but suffers from weak profitability scores (ROE 1, ROA 1) and poor valuation metrics (PE 1, PB 1). Adobe’s diversified financial strengths position it as the more stable investment.
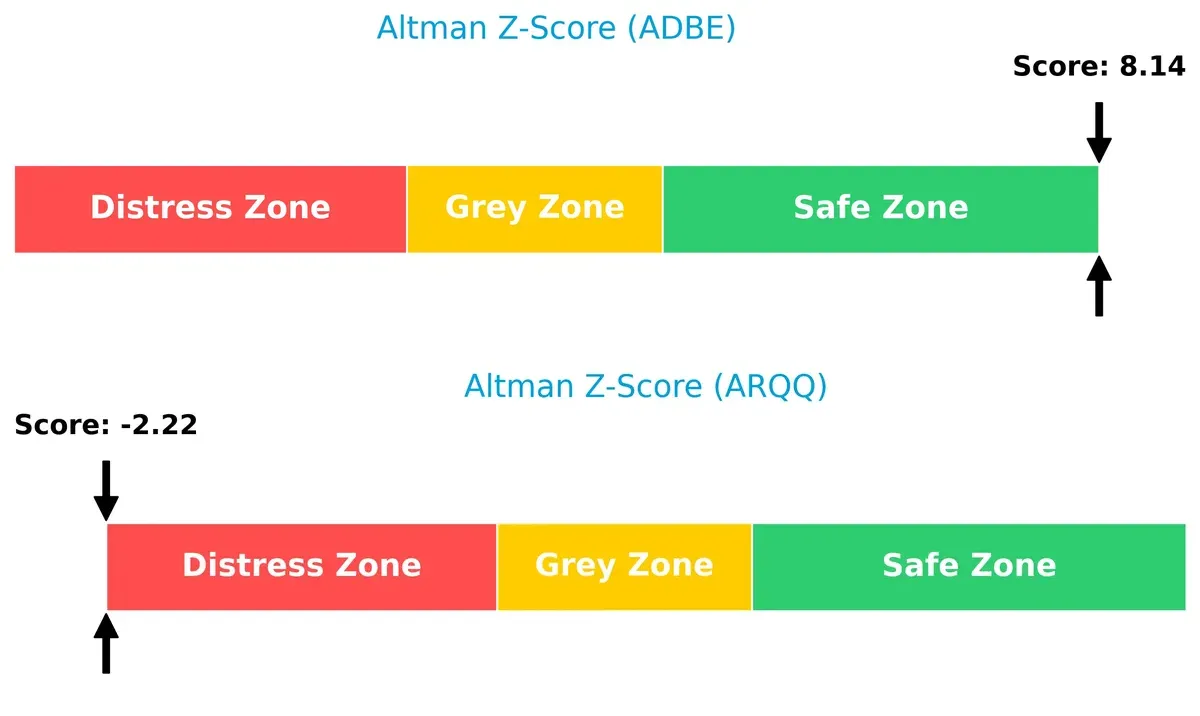
Bankruptcy Risk: Solvency Showdown
Adobe’s Altman Z-Score of 8.14 places it firmly in the safe zone, signaling robust long-term survival prospects. Arqit’s score of -2.22 highlights significant bankruptcy risk and distress in the current cycle:
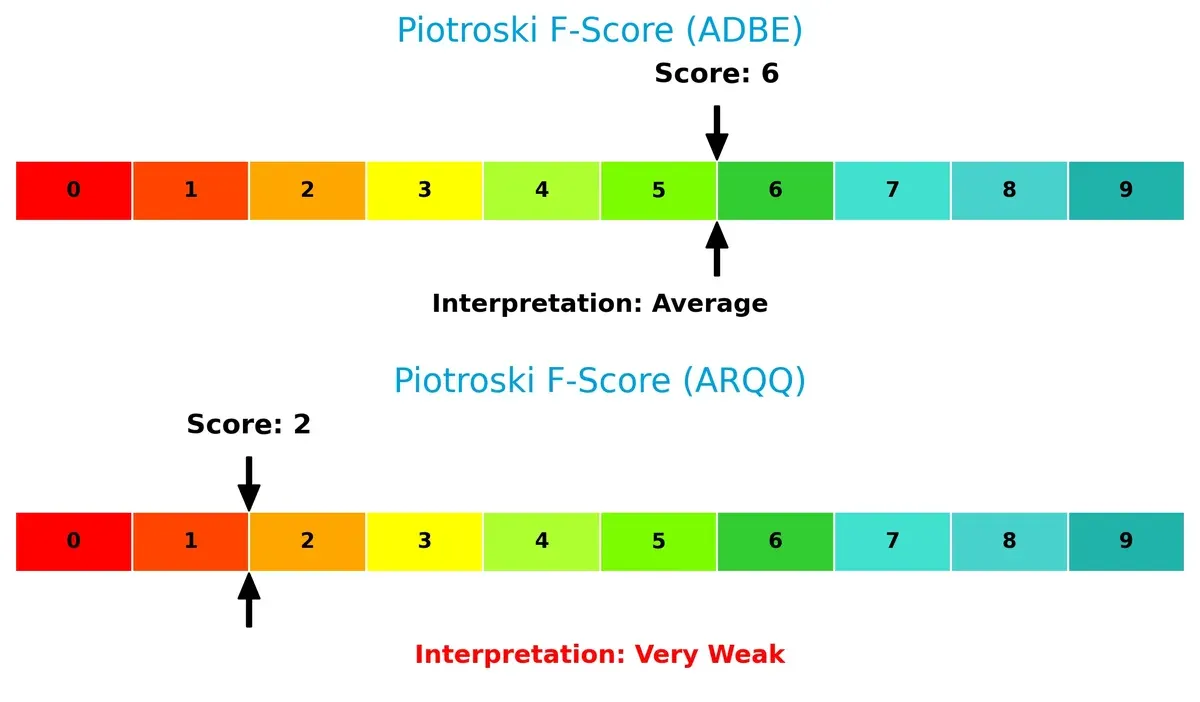
Financial Health: Quality of Operations
Adobe’s Piotroski F-Score of 6 reflects solid financial health with no major red flags. Arqit’s score of 2 signals very weak operational quality and potential internal financial distress:
How are the two companies positioned?
This section dissects Adobe and Arqit’s operational DNA by comparing their revenue distribution and internal dynamics. The goal is to confront their economic moats and identify which model offers the most resilient competitive advantage today.
Revenue Segmentation: The Strategic Mix
This visual comparison dissects how Adobe Inc. and Arqit Quantum Inc. diversify their income streams and reveals where their primary sector bets lie:
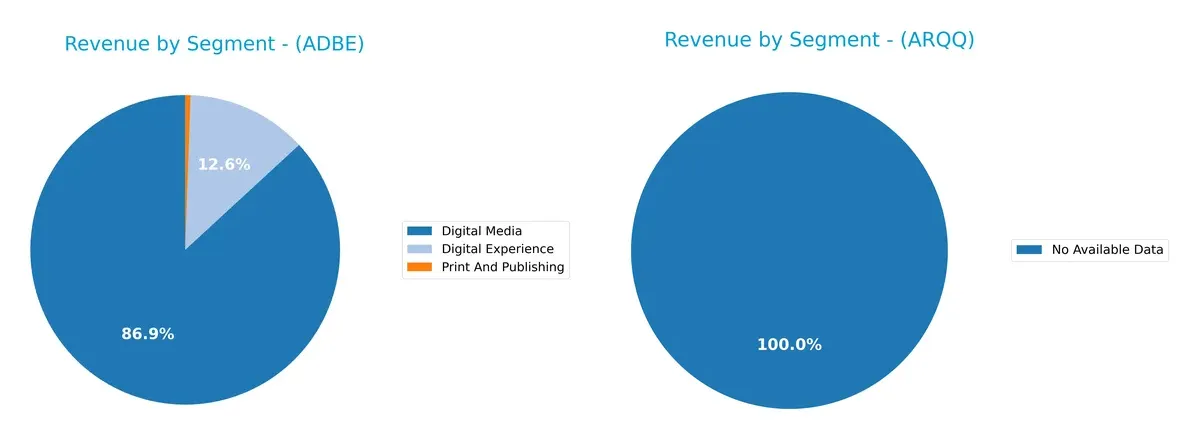
Adobe Inc. dwarfs Arqit Quantum with a broad revenue base anchored in Digital Media ($40.4B) and Digital Experience ($5.9B) for 2025. Adobe’s mix shows strong ecosystem lock-in through creative and marketing software. Arqit lacks reported segment data, signaling high uncertainty or early stage. Adobe’s diversified model reduces concentration risk, while Arqit’s absence of data clouds strategic clarity and risk assessment.
Strengths and Weaknesses Comparison
This table compares the Strengths and Weaknesses of Adobe Inc. and Arqit Quantum Inc.:
Adobe Inc. Strengths
- Strong profitability with 30% net margin
- High ROE at 61%
- Favorable debt-to-assets at 22.5%
- Significant global presence across Americas and EMEA
- Diverse product segments including Digital Experience and Media
Arqit Quantum Inc. Strengths
- High current and quick ratios at 2.69 indicate liquidity strength
- Very low debt-to-assets at 1.68%
- Favorable debt to equity ratio of 0.03
- Presence in multiple countries despite limited revenue data
Adobe Inc. Weaknesses
- Current ratio of 1.0 is borderline, signaling potential liquidity risk
- Unfavorable WACC at 10.6% exceeds ROIC, reducing value creation
- High PB ratio at 11.73 may indicate overvaluation
- No dividend yield
- Neutral asset turnover at 0.81
Arqit Quantum Inc. Weaknesses
- Negative profitability metrics with net margin at -6668% and ROE at -129%
- Unfavorable interest coverage at -782 and very low asset turnover at 0.01
- High WACC at 15.13%
- Negative PE ratio and high PB at 19.62
- No dividends and very low revenue diversification
Adobe excels in profitability, diversified revenue streams, and geographic reach, but shows some liquidity and valuation concerns. Arqit faces significant profitability and operational challenges despite strong liquidity and low leverage, reflecting its early-stage or turnaround status.
The Moat Duel: Analyzing Competitive Defensibility
A structural moat shields long-term profits from relentless competition erosion. Without it, sustainable value disappears quickly:
Adobe Inc.: Intangible Asset Moat through Brand and Ecosystem
Adobe’s moat stems from its dominant Creative Cloud ecosystem and strong brand recognition. This drives high ROIC (>26%) and margin stability. New AI tools could deepen its lead in 2026.
Arqit Quantum Inc.: Emerging Tech Moat via Innovation Potential
Arqit’s moat relies on cutting-edge quantum encryption technology. Unlike Adobe, it lacks scale and positive ROIC, though rising profitability hints at future value creation. Expansion into government cybersecurity markets remains a key opportunity.
Moat Strength Showdown: Ecosystem Dominance vs. Innovation Potential
Adobe’s wide, durable moat outpaces Arqit’s nascent competitive advantage. Adobe is better equipped to defend and grow market share, while Arqit must prove its technology can scale profitably.
Which stock offers better returns?
Over the past 12 months, both Adobe Inc. and Arqit Quantum Inc. have experienced notable price declines, with Adobe showing a sharper drop and higher volatility.
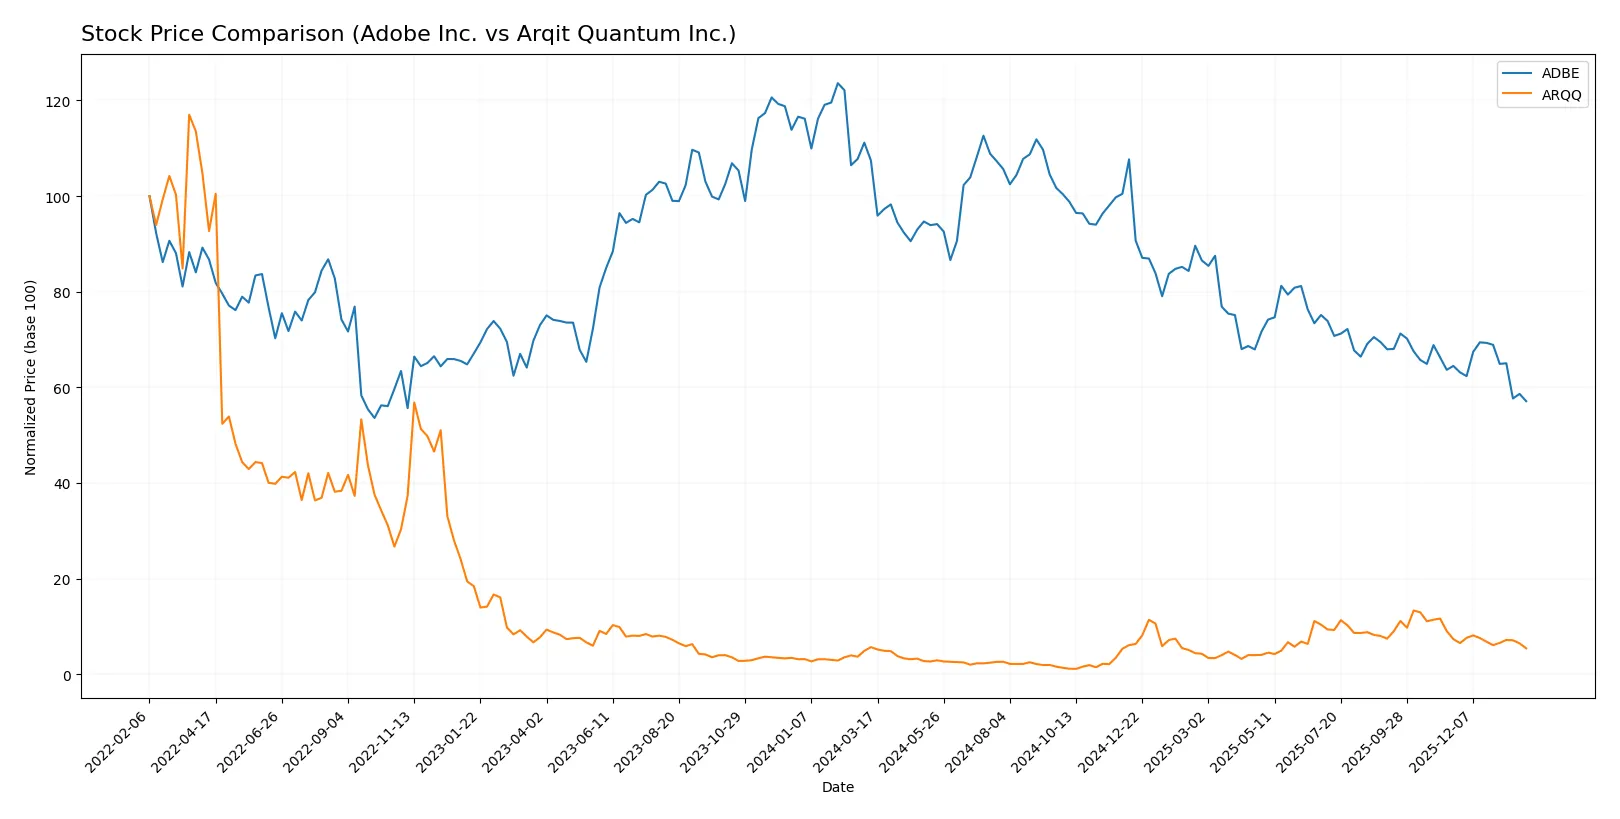
Trend Comparison
Adobe Inc.’s stock fell 46.85% over the past year, marking a clear bearish trend with decelerating losses. It recorded a high of 578.34 and a low of 293.25, showing significant price swings.
Arqit Quantum Inc.’s stock declined 4.38% over the same period, also bearish but less severe. The trend decelerated with lower volatility, ranging from 49.92 at its peak to 4.19 at its trough.
Comparing both, Adobe’s stock delivered the largest negative return, reflecting a more pronounced bearish trend and greater market turbulence than Arqit Quantum.
Target Prices
Analysts present a wide but optimistic target range for Adobe Inc. and a firm target for Arqit Quantum Inc.
| Company | Target Low | Target High | Consensus |
|---|---|---|---|
| Adobe Inc. | 280 | 500 | 390.31 |
| Arqit Quantum Inc. | 60 | 60 | 60 |
Adobe’s consensus target stands 33% above its current 293 price, signaling strong growth expectations. Arqit’s fixed target at 60 suggests significant upside from its 20.32 market price.

Don’t Let Luck Decide Your Entry Point
Optimize your entry points with our advanced ProRealTime indicators. You’ll get efficient buy signals with precise price targets for maximum performance. Start outperforming now!
How do institutions grade them?
Adobe Inc. Grades
The following table summarizes recent grades issued by major financial institutions for Adobe Inc.:
| Grading Company | Action | New Grade | Date |
|---|---|---|---|
| UBS | maintain | Neutral | 2026-01-26 |
| Oppenheimer | downgrade | Perform | 2026-01-13 |
| BMO Capital | downgrade | Market Perform | 2026-01-09 |
| Jefferies | downgrade | Hold | 2026-01-05 |
| Citigroup | maintain | Neutral | 2025-12-17 |
| BMO Capital | maintain | Outperform | 2025-12-15 |
| Keybanc | downgrade | Underweight | 2025-12-15 |
| Wolfe Research | maintain | Outperform | 2025-12-11 |
| TD Cowen | maintain | Hold | 2025-12-11 |
| Oppenheimer | maintain | Outperform | 2025-12-11 |
Arqit Quantum Inc. Grades
Below is a summary of grades issued exclusively by HC Wainwright & Co. for Arqit Quantum Inc.:
| Grading Company | Action | New Grade | Date |
|---|---|---|---|
| HC Wainwright & Co. | maintain | Buy | 2025-10-13 |
| HC Wainwright & Co. | maintain | Buy | 2025-09-18 |
| HC Wainwright & Co. | maintain | Buy | 2024-12-31 |
| HC Wainwright & Co. | maintain | Buy | 2024-12-06 |
| HC Wainwright & Co. | maintain | Buy | 2024-07-11 |
| HC Wainwright & Co. | maintain | Buy | 2024-05-29 |
| HC Wainwright & Co. | maintain | Buy | 2024-05-15 |
| HC Wainwright & Co. | maintain | Buy | 2023-11-22 |
| HC Wainwright & Co. | maintain | Buy | 2023-09-27 |
| HC Wainwright & Co. | maintain | Buy | 2023-09-26 |
Which company has the best grades?
Arqit Quantum Inc. consistently holds a Buy rating from a single firm, while Adobe Inc. shows mostly Neutral to Hold grades with multiple downgrades. Arqit’s stronger grades may suggest higher analyst confidence, potentially influencing investor sentiment differently.
Risks specific to each company
The following categories identify the critical pressure points and systemic threats facing both firms in the 2026 market environment:
1. Market & Competition
Adobe Inc.
- Dominates digital media and experience software with strong subscription models but faces intense tech competition.
Arqit Quantum Inc.
- Operates in emerging quantum cybersecurity with niche focus but struggles to scale and compete against traditional security giants.
2. Capital Structure & Debt
Adobe Inc.
- Moderate leverage (D/E 0.57) with favorable debt-to-assets (22.54%) and strong interest coverage (33.96).
Arqit Quantum Inc.
- Very low leverage (D/E 0.03) and debt-to-assets (1.68%) but negative interest coverage signals poor profitability and risk of cash burn.
3. Stock Volatility
Adobe Inc.
- Beta of 1.53 indicates above-market volatility typical for tech leaders but with stable trading volumes.
Arqit Quantum Inc.
- High beta of 2.41 reflects extreme price swings and risk, compounded by low liquidity and recent sharp price drops.
4. Regulatory & Legal
Adobe Inc.
- Subject to evolving digital privacy laws and antitrust scrutiny in US and global markets.
Arqit Quantum Inc.
- Faces regulatory uncertainty in quantum tech and cybersecurity standards, especially in UK and US jurisdictions.
5. Supply Chain & Operations
Adobe Inc.
- Robust cloud infrastructure supports scalable delivery; operational risks low due to digital nature.
Arqit Quantum Inc.
- Small workforce (82 employees) and reliance on satellite platforms create operational and scalability risks.
6. ESG & Climate Transition
Adobe Inc.
- Large company with ESG initiatives but faces pressure to reduce carbon footprint in data centers.
Arqit Quantum Inc.
- Early-stage firm with limited ESG disclosures; quantum tech could offer energy-efficient security solutions long term.
7. Geopolitical Exposure
Adobe Inc.
- Global footprint exposes it to US-China tech tensions and data sovereignty regulations.
Arqit Quantum Inc.
- UK-based with potential Brexit-related trade and regulatory uncertainties impacting growth trajectory.
Which company shows a better risk-adjusted profile?
Adobe’s dominant market position and strong financial health mitigate risks, despite regulatory and valuation concerns. Arqit’s severe profitability issues and distress-level Altman Z-score overshadow its low leverage, signaling high financial risk. The quantum cybersecurity firm’s stock volatility and operational scale add to uncertainty. Adobe presents a more balanced risk-adjusted profile in 2026.
Final Verdict: Which stock to choose?
Adobe Inc. shines through its unmatched ability to generate strong returns on invested capital, sustaining a durable competitive advantage in the software sector. Its cash flow reliability is a notable strength, though a current ratio near 1 signals a point of vigilance on short-term liquidity. Adobe suits portfolios seeking aggressive growth with a seasoned market leader.
Arqit Quantum’s strategic moat lies in its early-stage innovation potential within quantum encryption, marked by a solid balance sheet and low leverage. However, its unprofitable operations and value destruction pose significant risks. It fits investors with a high-risk appetite looking for speculative growth driven by emerging technology.
If you prioritize durable profitability and proven capital efficiency, Adobe outshines as the compelling choice due to its strong economic moat and stable cash generation. However, if you seek speculative exposure to frontier tech and can tolerate financial instability, Arqit offers a potential high-reward scenario despite its current value erosion. Both present distinct analytical scenarios aligned with different investor profiles.
Disclaimer: Investment carries a risk of loss of initial capital. The past performance is not a reliable indicator of future results. Be sure to understand risks before making an investment decision.
Go Further
I encourage you to read the complete analyses of Adobe Inc. and Arqit Quantum Inc. to enhance your investment decisions: