Home > Comparison > Technology > ADBE vs AKAM
The strategic rivalry between Adobe Inc. and Akamai Technologies defines the current trajectory of the software infrastructure sector. Adobe operates as a diversified software powerhouse focused on creative and digital experience solutions, while Akamai specializes in cloud services securing and optimizing internet content delivery. This analysis pits Adobe’s broad digital media ecosystem against Akamai’s niche edge computing and cybersecurity strengths. I will determine which company offers a superior risk-adjusted profile for diversified portfolios in 2026.
Table of contents
Companies Overview
Adobe Inc. and Akamai Technologies both hold critical roles in the software infrastructure market, shaping digital experiences globally.
Adobe Inc.: Creative and Customer Experience Powerhouse
Adobe dominates the software infrastructure sector with its flagship Creative Cloud subscription. It generates revenue by enabling content creation, publishing, and marketing through three segments: Digital Media, Digital Experience, and Publishing and Advertising. In 2026, Adobe’s strategic focus centers on expanding its integrated cloud platforms to optimize customer experiences and broaden enterprise adoption.
Akamai Technologies, Inc.: Cloud Security and Content Delivery Specialist
Akamai leads in delivering cloud services that secure and optimize internet content and business applications. It earns revenue by providing cybersecurity, web performance, media streaming, and edge compute solutions. In 2026, Akamai emphasizes enhancing its edge computing capabilities and cybersecurity offerings to meet rising online threats and the demand for faster, safer digital interactions.
Strategic Collision: Similarities & Divergences
Both companies excel in software infrastructure but diverge sharply in approach: Adobe builds a closed ecosystem focused on creative and marketing workflows, while Akamai offers an open-edge platform securing and accelerating content delivery. Their primary battleground lies in serving enterprises’ digital transformation needs. Adobe’s innovation targets content creators and marketers; Akamai’s strengths appeal to IT and security professionals, defining distinct investment risk and growth profiles.
Income Statement Comparison
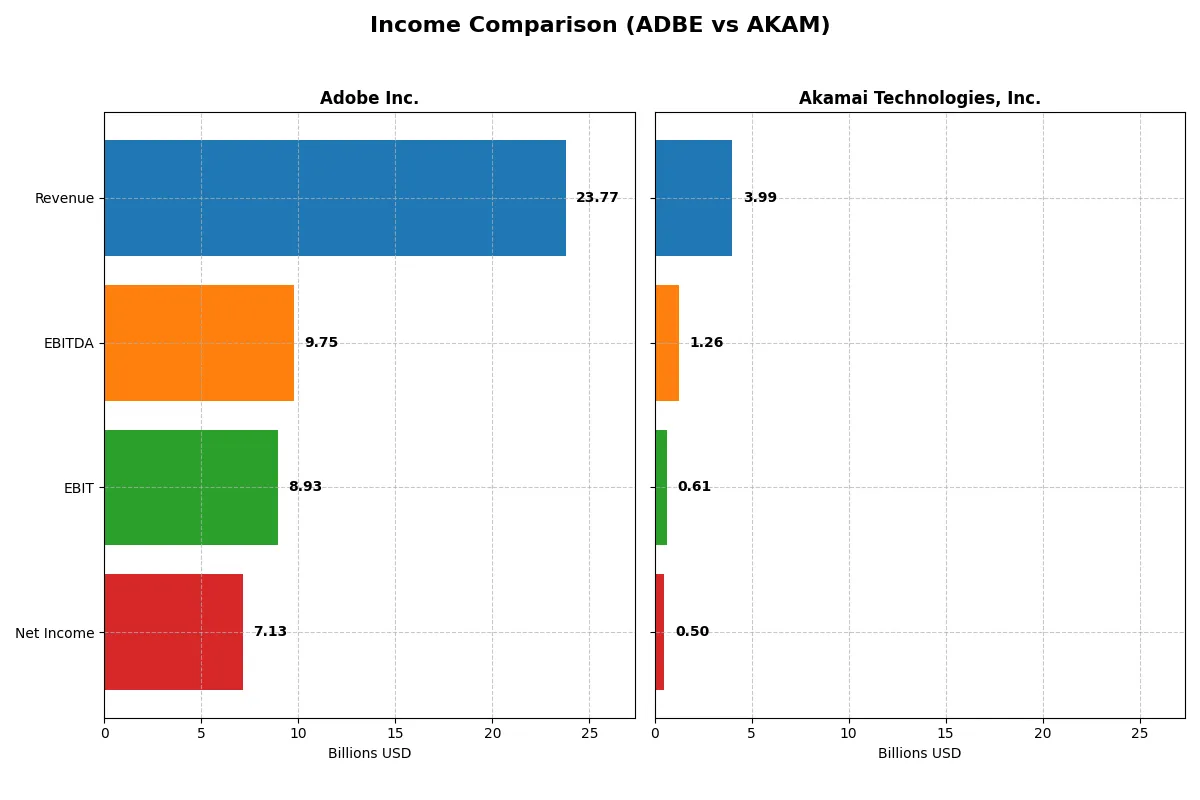
This data dissects the core profitability and scalability of both corporate engines to reveal who dominates the bottom line:
| Metric | Adobe Inc. (ADBE) | Akamai Technologies, Inc. (AKAM) |
|---|---|---|
| Revenue | 23.8B | 3.99B |
| Cost of Revenue | 2.71B | 1.62B |
| Operating Expenses | 12.4B | 1.84B |
| Gross Profit | 21.1B | 2.37B |
| EBITDA | 9.75B | 1.26B |
| EBIT | 8.93B | 614M |
| Interest Expense | 263M | 27.1M |
| Net Income | 7.13B | 505M |
| EPS | 16.73 | 3.34 |
| Fiscal Year | 2025 | 2024 |
Income Statement Analysis: The Bottom-Line Duel
This income statement comparison reveals which company drives superior profitability and efficiency in their core operations.
Adobe Inc. Analysis
Adobe’s revenue climbed steadily to $23.8B in 2025, with net income surging to $7.13B. Gross margin remains robust at 88.6%, signaling impressive cost control. Adobe’s net margin of 30% and EBIT margin of 37.6% highlight operational strength. Recent growth momentum is strong, with a 10.5% revenue increase and a 16% net margin expansion in the latest year.
Akamai Technologies, Inc. Analysis
Akamai’s revenue reached $4B in 2024, showing moderate growth of 4.7%. Net income declined to $505M, reflecting margin pressures. Gross margin stands at a healthy 59.4%, but net margin lags at 12.6%. EBIT margin dropped by 8.4%, indicating weakening profitability. Akamai’s recent earnings contraction contrasts with its revenue stability, signaling operational challenges.
Margin Power vs. Revenue Scale
Adobe’s superior margins and strong net income growth clearly outpace Akamai’s more modest revenue expansion and declining profitability. Adobe’s scale and efficiency create a dominant earnings engine. Investors seeking robust profit growth and margin resilience should note Adobe’s commanding fundamentals versus Akamai’s headwinds.
Financial Ratios Comparison
These vital ratios act as a diagnostic tool to expose the underlying fiscal health, valuation premiums, and capital efficiency of the companies analyzed:
| Ratios | Adobe Inc. (ADBE) | Akamai Technologies, Inc. (AKAM) |
|---|---|---|
| ROE | 61.3% | 10.4% |
| ROIC | 36.7% | 4.7% |
| P/E | 19.1 | 28.7 |
| P/B | 11.7 | 3.0 |
| Current Ratio | 1.0 | 1.2 |
| Quick Ratio | 1.0 | 1.2 |
| D/E (Debt-to-Equity) | 0.57 | 0.95 |
| Debt-to-Assets | 22.5% | 44.7% |
| Interest Coverage | 33.1 | 19.7 |
| Asset Turnover | 0.81 | 0.38 |
| Fixed Asset Turnover | 10.9 | 1.33 |
| Payout ratio | 0% | 0% |
| Dividend yield | 0% | 0% |
| Fiscal Year | 2025 | 2024 |
Efficiency & Valuation Duel: The Vital Signs
Ratios act as a company’s financial DNA, revealing hidden risks and operational strengths critical for investment decisions.
Adobe Inc.
Adobe delivers robust profitability with a 61.3% ROE and a strong 30% net margin, demonstrating operational excellence. Its valuation sits at a neutral 19.1 P/E, reflecting a reasonable price relative to earnings. Adobe does not pay dividends but efficiently reinvests in R&D, fueling sustainable growth and shareholder value over time.
Akamai Technologies, Inc.
Akamai shows moderate profitability, with a 10.4% ROE and a 12.7% net margin, indicating a more cautious operational stance. The stock appears stretched with a high 28.7 P/E, suggesting pricing optimism. Like Adobe, it pays no dividend, focusing capital on growth initiatives rather than immediate shareholder returns.
Premium Valuation vs. Operational Safety
Adobe balances superior returns and solid reinvestment despite a neutral valuation, showcasing operational strength. Akamai’s higher valuation and lower profitability raise caution. Investors favoring growth and operational efficiency may prefer Adobe, while those seeking potential turnaround plays might consider Akamai’s profile.
Which one offers the Superior Shareholder Reward?
Adobe Inc. (ADBE) and Akamai Technologies, Inc. (AKAM) both forgo dividends, focusing on reinvestment and buybacks. Adobe’s free cash flow per share is robust at 23.1, with no dividend payout, while Akamai’s FCF per share lags at 5.5. Adobe’s buyback intensity is higher, supported by a strong operating cash flow coverage ratio (1.51) and minimal debt-to-market cap (4.5%). Conversely, Akamai’s lower free cash flow conversion (0.55) and higher leverage (24.5%) limit buyback sustainability. Historically, Adobe’s reinvestment in innovation fuels growth and shareholder returns. I conclude Adobe offers a more attractive total return profile in 2026 due to superior capital allocation and sustainable buyback capacity.
Comparative Score Analysis: The Strategic Profile
The radar chart reveals the fundamental DNA and trade-offs of Adobe Inc. and Akamai Technologies, highlighting their financial strengths and valuation nuances:
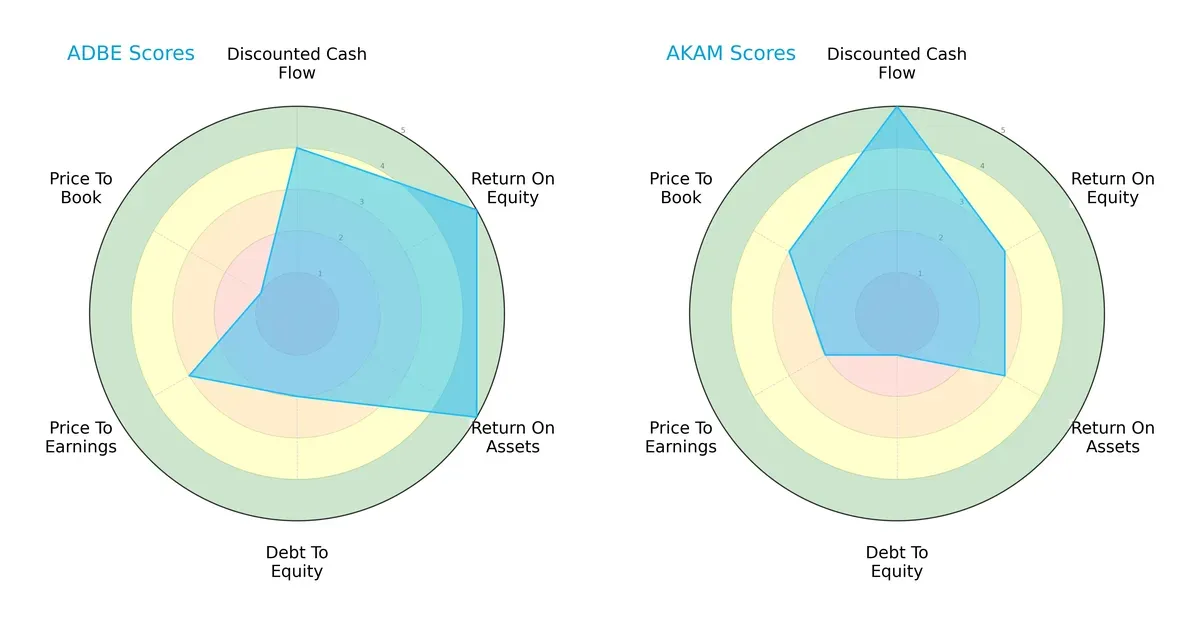
Adobe Inc. boasts top scores in ROE (5) and ROA (5), signaling superior profitability and asset efficiency. Akamai leads in discounted cash flow (5), suggesting strong future cash flow prospects. Adobe’s debt-to-equity score (2) and valuation metrics (PE 3, PB 1) reveal moderate leverage but expensive book value pricing. Akamai’s weaker debt score (1) flags higher financial risk despite more balanced valuation scores. Overall, Adobe presents a more balanced and robust profile, while Akamai relies on its DCF strength amid financial leverage concerns.
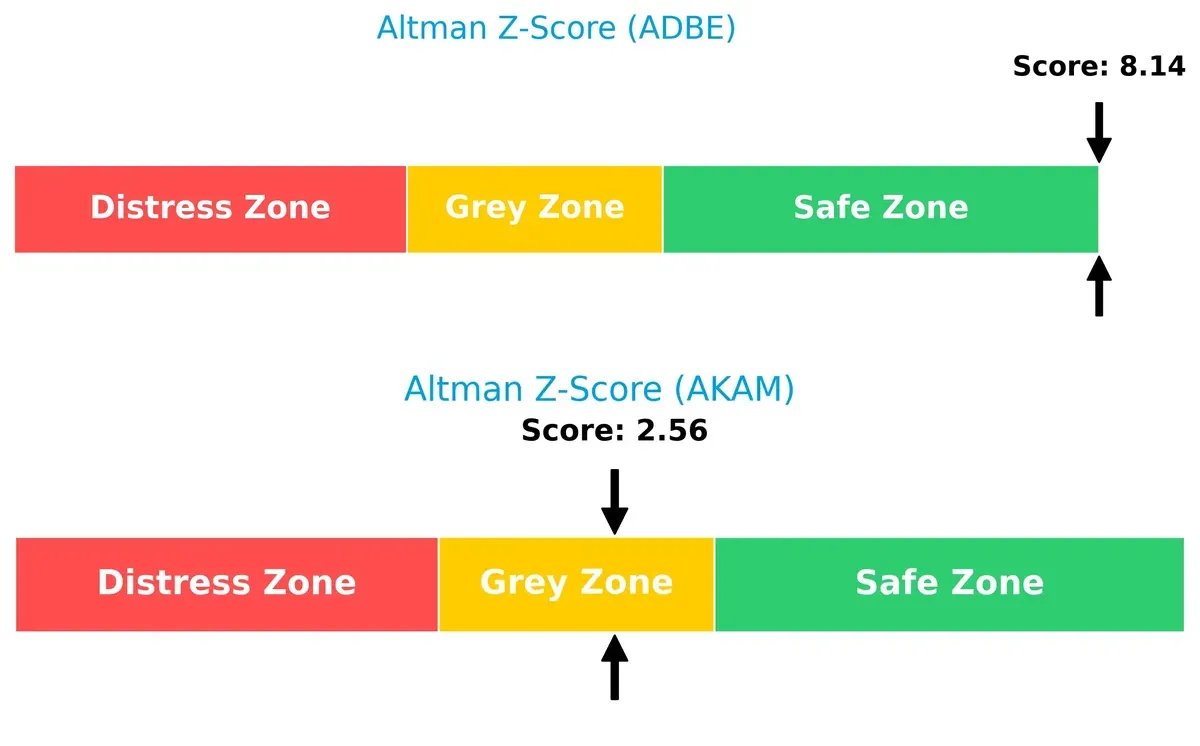
Bankruptcy Risk: Solvency Showdown
Adobe’s Altman Z-Score of 8.14 places it firmly in the safe zone, while Akamai’s 2.56 situates it in the grey zone, indicating higher bankruptcy risk in this cycle:
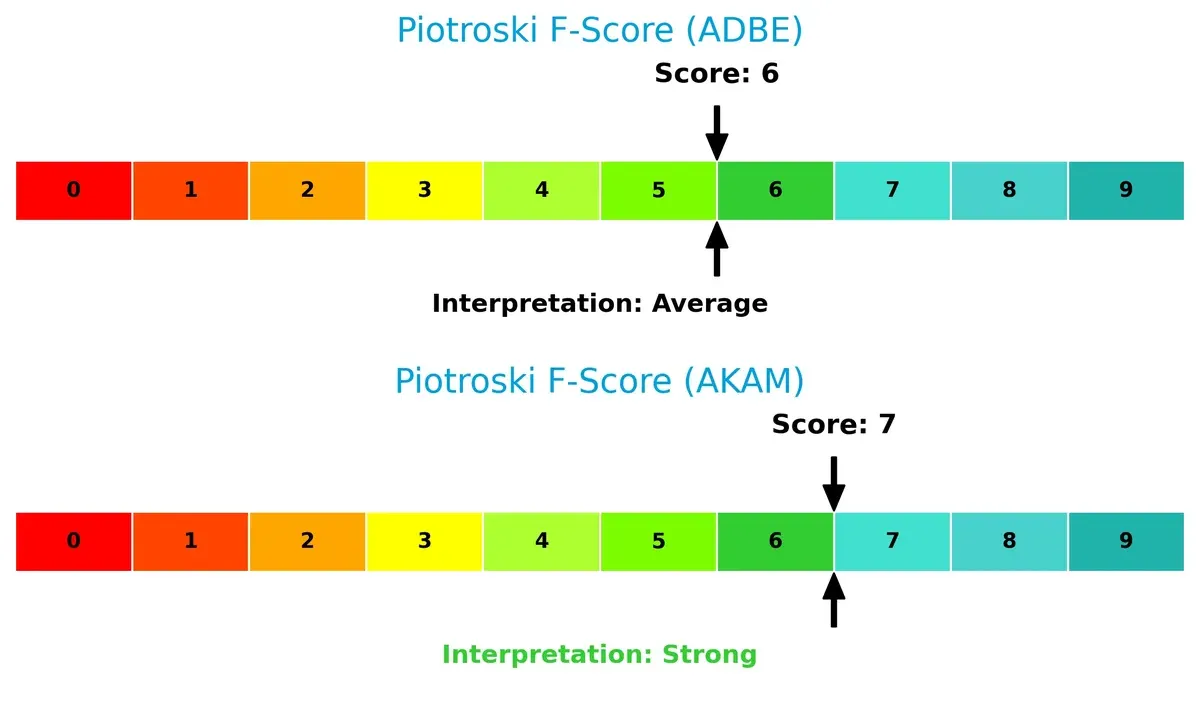
Financial Health: Quality of Operations
Akamai’s Piotroski F-Score of 7 surpasses Adobe’s 6, suggesting stronger financial health and operational quality, though both companies remain within acceptable ranges:
How are the two companies positioned?
This section dissects Adobe and Akamai’s operational DNA by comparing revenue distribution and internal dynamics—strengths and weaknesses. The goal is to confront their economic moats and determine which model offers the most resilient, sustainable competitive edge today.
Revenue Segmentation: The Strategic Mix
The following visual comparison dissects how both firms diversify their income streams and where their primary sector bets lie:
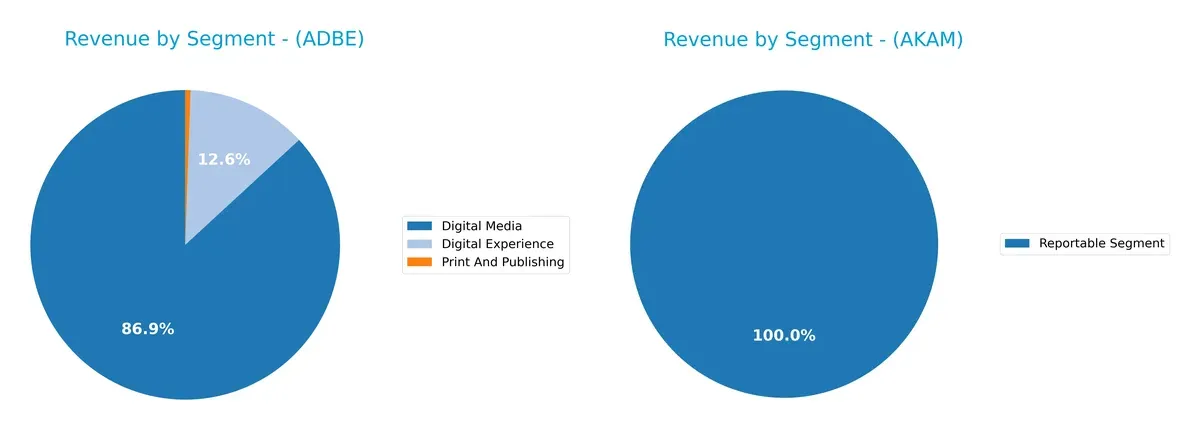
Adobe Inc. displays a clear revenue concentration in Digital Media at $40.4B, anchored by Digital Experience at $5.9B and a minor Print and Publishing segment. Akamai Technologies, with a single $4B Reportable Segment, lacks diversification. Adobe’s mix reveals ecosystem lock-in through creative and marketing software dominance, while Akamai’s reliance on one segment implies higher concentration risk and less flexibility to pivot amid market shifts.
Strengths and Weaknesses Comparison
This table compares the Strengths and Weaknesses of Adobe Inc. and Akamai Technologies, Inc.:
Adobe Inc. Strengths
- High net margin at 30%
- Strong ROE of 61.34%
- Favorable ROIC at 36.69%
- Low debt-to-assets at 22.54%
- Robust interest coverage of 33.96
- High fixed asset turnover of 10.88
- Diverse product segments with strong Digital Media revenue
- Significant global presence, especially Americas and EMEA
Akamai Technologies Strengths
- Positive net margin at 12.65%
- Favorable WACC at 6.14%
- Strong interest coverage of 22.65
- Good quick ratio at 1.23
- Balanced geographic revenue split between US and Non-US
- Stable market presence with consistent revenues
Adobe Inc. Weaknesses
- Unfavorable WACC at 10.6%
- High price-to-book at 11.73
- Current ratio only 1.0, a liquidity concern
- No dividend yield
- Neutral asset turnover at 0.81
- Exposure to unfavorable ratios making overall rating only slightly favorable
Akamai Technologies Weaknesses
- Low ROIC at 4.74% indicating weak capital efficiency
- Unfavorable P/E of 28.68 suggesting expensive valuation
- Asset turnover low at 0.38
- No dividend yield
- Debt-to-assets relatively high at 44.7%
- Neutral to unfavorable ratio balance leads to neutral overall rating
Adobe shows strong profitability and capital efficiency, supported by a diversified product base and solid global reach. Akamai’s strengths lie in its liquidity and cost of capital, though it faces challenges in capital efficiency and valuation. These factors define their strategic focus areas moving forward.
The Moat Duel: Analyzing Competitive Defensibility
A structural moat is the only protection long-term profits have against relentless competition erosion:
Adobe Inc.: Intangible Asset Moat with Subscription Lock-in
Adobe dominates through its Creative Cloud ecosystem, generating high ROIC above 26% and stable 30% net margins. Its subscription model deepens customer dependency. New AI tools in 2026 could further entrench its moat.
Akamai Technologies, Inc.: Cost and Infrastructure Moat Under Pressure
Akamai relies on its global content delivery network and cybersecurity scale advantage. Yet, declining ROIC and shrinking margins reveal weakening defenses. Expansion into edge computing offers upside, but competition intensifies.
Subscription Ecosystem vs. Infrastructure Scale: The Defensibility Face-off
Adobe’s growing ROIC and sticky subscription base create a deeper moat than Akamai’s eroding cost advantage. Adobe is better positioned to defend and expand market share amid evolving digital needs.
Which stock offers better returns?
Over the past year, Adobe Inc. and Akamai Technologies, Inc. have shown contrasting price trends, with notable shifts in momentum and trading volumes shaping their market performance.
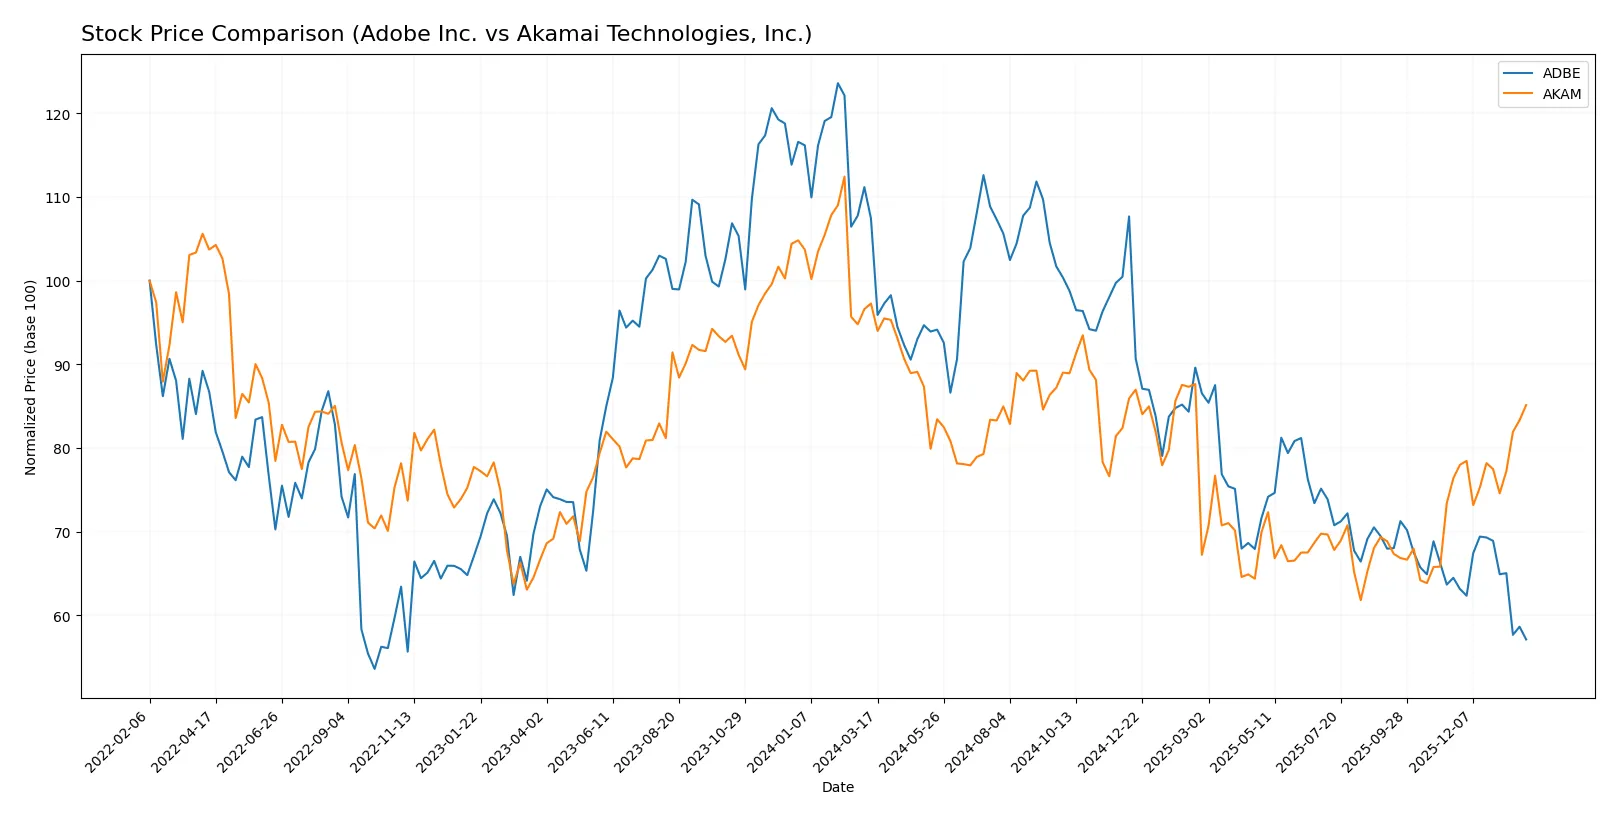
Trend Comparison
Adobe Inc. experienced a steep bearish trend with a -46.85% price decline over the past 12 months, showing deceleration and high volatility, ranging from $578.34 to $293.25.
Akamai Technologies faced a milder bearish trend of -12.48% over the same period but recently reversed to an 11.45% gain, indicating accelerating momentum with lower volatility.
Comparing both, Akamai delivered superior market performance with less severe losses and recent positive price momentum compared to Adobe’s prolonged decline.
Target Prices
Analysts present a moderately bullish consensus for Adobe Inc. and Akamai Technologies, indicating room for appreciation.
| Company | Target Low | Target High | Consensus |
|---|---|---|---|
| Adobe Inc. | 280 | 500 | 390.31 |
| Akamai Technologies, Inc. | 89 | 115 | 104.8 |
Adobe’s target consensus sits about 33% above its current price of 293.25, signaling strong growth expectations. Akamai’s consensus price of 104.8 implies modest upside from its current 97.15, reflecting cautious optimism.

Don’t Let Luck Decide Your Entry Point
Optimize your entry points with our advanced ProRealTime indicators. You’ll get efficient buy signals with precise price targets for maximum performance. Start outperforming now!
How do institutions grade them?
Here is a comparison of recent institutional grades for Adobe Inc. and Akamai Technologies, Inc.:
Adobe Inc. Grades
The following table summarizes Adobe’s recent grades from major financial institutions.
| Grading Company | Action | New Grade | Date |
|---|---|---|---|
| UBS | Maintain | Neutral | 2026-01-26 |
| Oppenheimer | Downgrade | Perform | 2026-01-13 |
| BMO Capital | Downgrade | Market Perform | 2026-01-09 |
| Jefferies | Downgrade | Hold | 2026-01-05 |
| Citigroup | Maintain | Neutral | 2025-12-17 |
| BMO Capital | Maintain | Outperform | 2025-12-15 |
| Keybanc | Downgrade | Underweight | 2025-12-15 |
| Wolfe Research | Maintain | Outperform | 2025-12-11 |
| TD Cowen | Maintain | Hold | 2025-12-11 |
| Oppenheimer | Maintain | Outperform | 2025-12-11 |
Akamai Technologies, Inc. Grades
Below is a summary of Akamai’s recent institutional grades.
| Grading Company | Action | New Grade | Date |
|---|---|---|---|
| Citigroup | Maintain | Neutral | 2026-01-16 |
| Morgan Stanley | Upgrade | Overweight | 2026-01-12 |
| Scotiabank | Maintain | Sector Outperform | 2026-01-09 |
| RBC Capital | Maintain | Sector Perform | 2026-01-05 |
| Piper Sandler | Maintain | Neutral | 2026-01-05 |
| Keybanc | Upgrade | Overweight | 2025-12-15 |
| TD Cowen | Maintain | Hold | 2025-11-13 |
| Citigroup | Maintain | Neutral | 2025-11-11 |
| Scotiabank | Maintain | Sector Outperform | 2025-11-07 |
| Piper Sandler | Maintain | Neutral | 2025-11-07 |
Which company has the best grades?
Akamai has received more upgrades and higher ratings such as Overweight and Sector Outperform. Adobe’s grades show multiple downgrades and a cluster around Neutral and Hold. Investors may view Akamai’s stronger grades as a signal of greater confidence from analysts.
Risks specific to each company
The following categories identify the critical pressure points and systemic threats facing both firms in the 2026 market environment:
1. Market & Competition
Adobe Inc. (ADBE)
- Dominates with diversified software offerings and strong Creative Cloud subscription base.
Akamai Technologies, Inc. (AKAM)
- Faces intense competition in cloud security and content delivery, with pressure from larger cloud providers.
2. Capital Structure & Debt
Adobe Inc. (ADBE)
- Moderate leverage (D/E 0.57), favorable debt-to-assets (22.54%), strong interest coverage (33.96).
Akamai Technologies, Inc. (AKAM)
- Higher leverage (D/E 0.95), neutral debt-to-assets (44.7%), adequate interest coverage (22.65).
3. Stock Volatility
Adobe Inc. (ADBE)
- Exhibits higher beta (1.53), indicating elevated market sensitivity and volatility risk.
Akamai Technologies, Inc. (AKAM)
- Lower beta (0.69) signals more stable price movements and less market volatility.
4. Regulatory & Legal
Adobe Inc. (ADBE)
- Subject to data privacy and intellectual property regulations globally; no major legal red flags.
Akamai Technologies, Inc. (AKAM)
- Similar regulatory exposure in cybersecurity and data handling; ongoing scrutiny in cloud services.
5. Supply Chain & Operations
Adobe Inc. (ADBE)
- Relies heavily on digital infrastructure; limited physical supply chain risks.
Akamai Technologies, Inc. (AKAM)
- Dependent on global network infrastructure; vulnerable to operational disruptions and tech integration challenges.
6. ESG & Climate Transition
Adobe Inc. (ADBE)
- Increasing focus on sustainability in cloud operations; improving ESG disclosures.
Akamai Technologies, Inc. (AKAM)
- Faces pressure to reduce carbon footprint in data centers and network operations; moderate ESG progress.
7. Geopolitical Exposure
Adobe Inc. (ADBE)
- Global software distribution exposes it to trade tensions and data localization laws.
Akamai Technologies, Inc. (AKAM)
- Significant international presence; geopolitical tensions could impact cross-border cloud services and content delivery.
Which company shows a better risk-adjusted profile?
Adobe’s primary risk stems from market volatility and high valuation multiples, exposing it to correction risks despite strong fundamentals. Akamai’s biggest concern lies in its elevated leverage and moderate operational risks within a highly competitive cloud environment. Adobe’s superior Altman Z-Score (8.14 vs. 2.56) and stronger profitability metrics grant it a better risk-adjusted profile. However, Adobe’s current ratio at 1.0 flags liquidity caution. Akamai’s stable beta and stronger Piotroski score (7 vs. 6) indicate operational resilience but higher financial risk. In 2026, Adobe’s balance of robust earnings and manageable debt outweighs Akamai’s leverage concerns.
Final Verdict: Which stock to choose?
Adobe Inc. wields an impressive superpower in its durable competitive advantage, marked by a high and growing ROIC well above its cost of capital. Its efficient capital allocation and strong profitability support robust value creation. A point of vigilance remains its stretched valuation multiples and tight liquidity, fitting it for aggressive growth-focused portfolios willing to weather volatility.
Akamai Technologies benefits from a strategic moat rooted in its network infrastructure and recurring revenue streams, offering a steadier income profile. While its profitability and capital efficiency lag behind Adobe’s, Akamai exhibits better current liquidity and a lower valuation premium, making it a reasonable choice for investors prioritizing growth at a reasonable price (GARP) with a more conservative risk appetite.
If you prioritize long-term value creation and can tolerate short-term valuation risks, Adobe outshines with its proven ability to generate excess returns and strong growth prospects. However, if you seek more stable cash flow and a lower entry multiple, Akamai offers better stability despite weaker profitability metrics. Each scenario reflects distinct investor profiles balancing growth ambitions and risk tolerance.
Disclaimer: Investment carries a risk of loss of initial capital. The past performance is not a reliable indicator of future results. Be sure to understand risks before making an investment decision.
Go Further
I encourage you to read the complete analyses of Adobe Inc. and Akamai Technologies, Inc. to enhance your investment decisions: