Home > Comparison > Consumer Defensive > UL vs ACU
The strategic rivalry between Unilever PLC and Acme United Corporation shapes the competitive landscape of the consumer defensive sector. Unilever, a global fast-moving consumer goods giant, contrasts sharply with Acme United’s niche focus on first aid and safety products. This head-to-head pits scale and brand breadth against specialized market penetration. This analysis will reveal which corporate trajectory offers the superior risk-adjusted return potential for a diversified portfolio.

Table of contents
Companies Overview
Unilever and Acme United stand as key players in the household and personal products sector, commanding distinct market positions.
Unilever PLC: Global Consumer Goods Powerhouse
Unilever dominates as a fast-moving consumer goods company with a diverse portfolio spanning Beauty & Personal Care, Foods & Refreshment, and Home Care. It generates revenue through iconic brands like Dove, Ben & Jerry’s, and Knorr. In 2026, Unilever sharpens its focus on sustainability and brand innovation to maintain global market leadership.
Acme United Corporation: Specialized Consumer Products Supplier
Acme United carves a niche as a supplier of first aid, cutting, and safety products for industrial, school, and retail markets. It earns revenue through well-known brands such as Westcott, Clauss, and First Aid Only. The company prioritizes expanding its product range and distribution channels to grow its presence in North America and internationally.
Strategic Collision: Similarities & Divergences
Both companies operate in consumer defensive products but differ in scale and approach. Unilever pursues a broad, global strategy with brand diversification, while Acme United focuses on specialized tools and safety products. Their main battleground lies in distribution efficiency and brand recognition. These contrasts shape distinct investment profiles: Unilever offers scale and stability; Acme United delivers niche market agility.
Income Statement Comparison
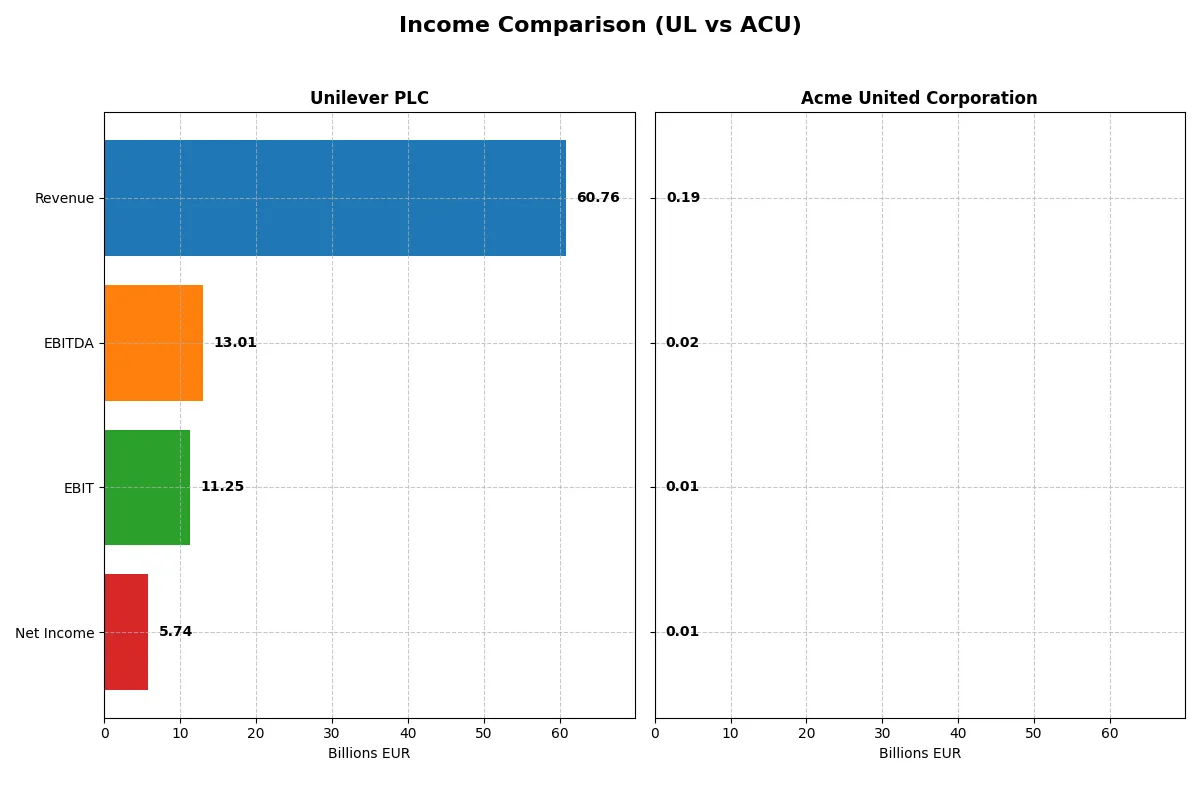
The following data dissects the core profitability and scalability of both corporate engines to reveal who dominates the bottom line:
| Metric | Unilever PLC (UL) | Acme United Corp (ACU) |
|---|---|---|
| Revenue | 60.8B EUR | 194.5M USD |
| Cost of Revenue | 0 EUR | 118.1M USD |
| Operating Expenses | 51.4B EUR | 62.2M USD |
| Gross Profit | 60.8B EUR | 76.4M USD |
| EBITDA | 13.0B EUR | 20.4M USD |
| EBIT | 11.3B EUR | 14.4M USD |
| Interest Expense | 1.1B EUR | 2.1M USD |
| Net Income | 5.7B EUR | 10.0M USD |
| EPS | 2.30 EUR | 2.71 USD |
| Fiscal Year | 2024 | 2024 |
Income Statement Analysis: The Bottom-Line Duel
This income statement comparison reveals which company operates with greater efficiency and profit power in a competitive market landscape.
Unilever PLC Analysis
Unilever’s revenue climbed steadily from 51B EUR in 2020 to 61B EUR in 2024, showing 20% growth over five years. Net income fluctuated but remains strong at 5.7B EUR in 2024. The company sustains a robust 100% gross margin (2024), with an EBIT margin of 18.5%, indicating solid operational control despite a slight net margin dip to 9.5%. Efficiency gains slowed in 2024, reflected in a marginal 1.9% revenue rise but 11% EBIT growth.
Acme United Corporation Analysis
Acme United’s revenue increased modestly to 194M USD in 2024 from 164M USD in 2020, marking roughly 19% growth. Net income rose to 10M USD but showed a steep decline in 2024 compared to 2023. The firm posts a healthy 39% gross margin but a lower EBIT margin at 7.4%, reflecting tighter expense control challenges. The latest year revealed a 44% drop in EBIT and net margin, signaling potential momentum loss despite solid longer-term growth.
Margin Strength vs. Growth Dynamics
Unilever dominates with superior margins and operational scale, delivering consistent profitability and margin expansion over five years. Acme United shows respectable revenue growth and net income gains but struggles with volatile margins and recent profit contraction. For investors, Unilever’s profile offers stable earnings power, while Acme’s growth narrative carries higher risk due to margin pressure.
Financial Ratios Comparison
These vital ratios act as a diagnostic tool to expose the underlying fiscal health, valuation premiums, and capital efficiency of the companies compared below:
| Ratios | Unilever PLC (UL) | Acme United Corporation (ACU) |
|---|---|---|
| ROE | 28.7% | 9.4% |
| ROIC | 11.1% | 8.2% |
| P/E | 26.9 | 13.8 |
| P/B | 7.7 | 1.3 |
| Current Ratio | 0.76 | 4.17 |
| Quick Ratio | 0.56 | 1.71 |
| D/E | 1.53 | 0.31 |
| Debt-to-Assets | 38.4% | 20.3% |
| Interest Coverage | 8.4x | 6.8x |
| Asset Turnover | 0.76 | 1.20 |
| Fixed Asset Turnover | 5.21 | 5.33 |
| Payout ratio | 75.2% | 22.2% |
| Dividend yield | 2.79% | 1.61% |
| Fiscal Year | 2024 | 2024 |
Efficiency & Valuation Duel: The Vital Signs
Financial ratios act as a company’s DNA, exposing hidden risks and operational strengths that shape investor confidence.
Unilever PLC
Unilever delivers strong profitability with a 28.7% ROE and favorable 11.1% ROIC, signaling efficient capital use. However, its valuation looks stretched, trading at a 26.9 P/E and 7.7 P/B, above sector norms. The firm rewards shareholders with a solid 2.79% dividend yield, balancing payout with reinvestment in stable operations.
Acme United Corporation
Acme shows modest profitability, with a 9.4% ROE and neutral 8.2% ROIC, reflecting moderate operational efficiency. The stock trades at a reasonable 13.8 P/E and a low 1.3 P/B, indicating an attractive valuation. Shareholder returns are mixed, with a 1.61% dividend and a focus on growth, given its favorable free cash flow metrics.
Premium Valuation vs. Operational Agility
Unilever’s premium multiples reflect confidence in its robust profitability and shareholder dividends but carry valuation risk. Acme offers better valuation metrics and operational agility but with lower profitability. Conservative investors may prefer Unilever’s steady income, while growth-focused investors might find Acme’s profile more appealing.
Which one offers the Superior Shareholder Reward?
I compare Unilever PLC (UL) and Acme United Corporation (ACU) on dividend yield, payout ratio, and buyback intensity. UL offers a robust 2.79% dividend yield with a high 75% payout ratio, supported by solid free cash flow coverage above 80%. ACU pays a lower 1.61% yield with a modest 22% payout, prioritizing reinvestment. UL’s consistent, substantial buybacks complement its dividend, providing balanced shareholder returns. ACU’s buyback activity is less pronounced but aligns with growth focus. I conclude UL offers a more sustainable and attractive total return profile for 2026 investors seeking steady income and disciplined capital allocation.
Comparative Score Analysis: The Strategic Profile
The radar chart reveals the fundamental DNA and trade-offs of Unilever PLC and Acme United Corporation, highlighting their distinct financial strengths and weaknesses:
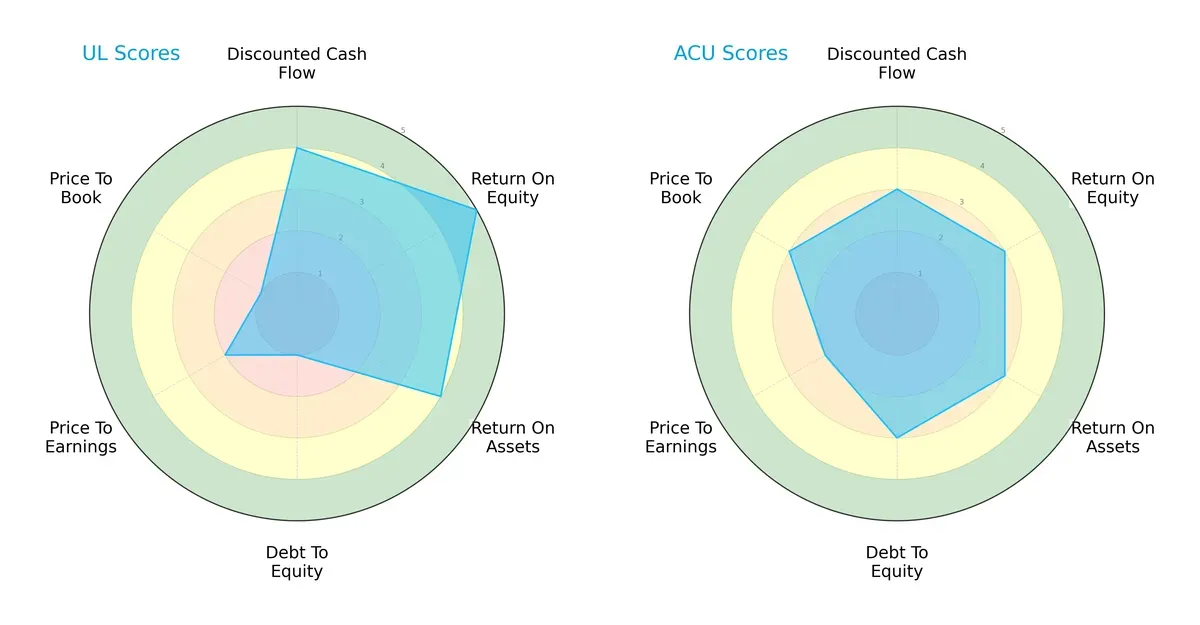
Unilever excels in return metrics with higher ROE (5 vs. 3) and ROA (4 vs. 3) scores, showing operational efficiency. Acme United displays a stronger balance sheet with a better debt-to-equity score (3 vs. 1), indicating lower financial risk. Valuation metrics favor Acme, particularly in price-to-book (3 vs. 1), suggesting better market pricing. Overall, Unilever leans on profitability, while Acme offers a more balanced financial profile.
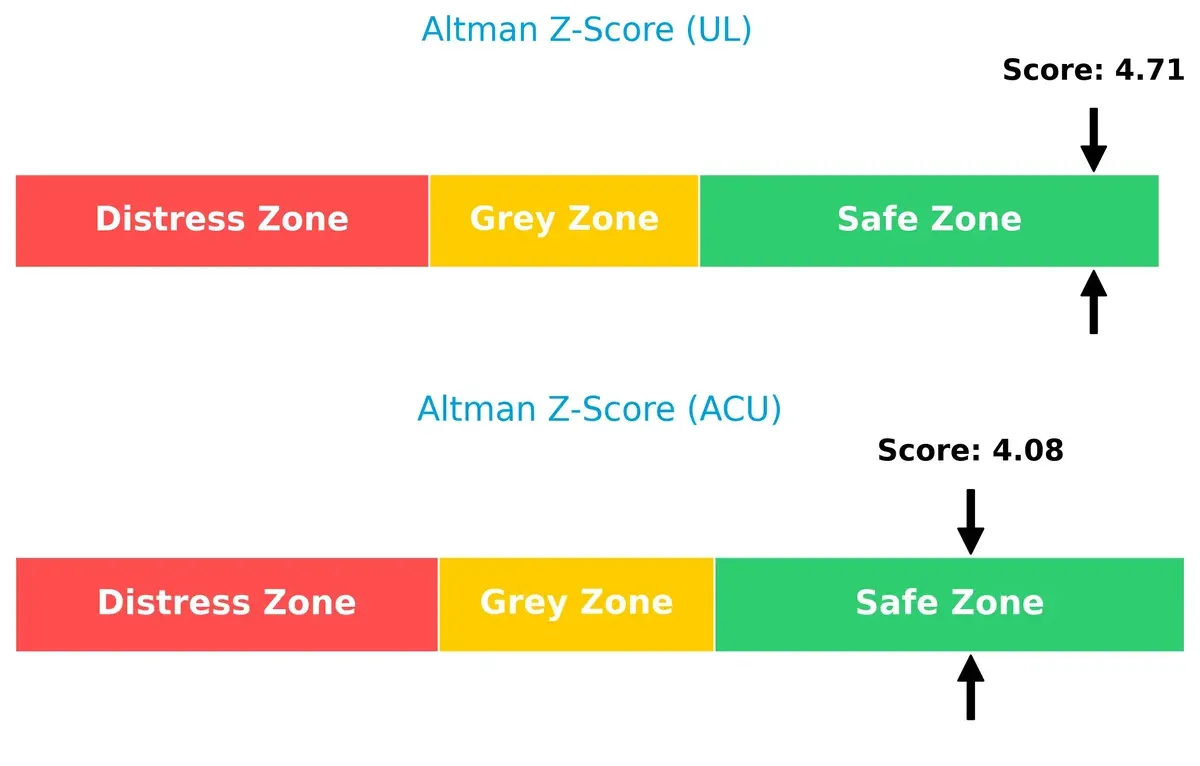
Bankruptcy Risk: Solvency Showdown
Unilever’s Altman Z-Score of 4.71 surpasses Acme United’s 4.08, positioning both safely above bankruptcy risk thresholds but giving Unilever a modest solvency edge in this cycle:
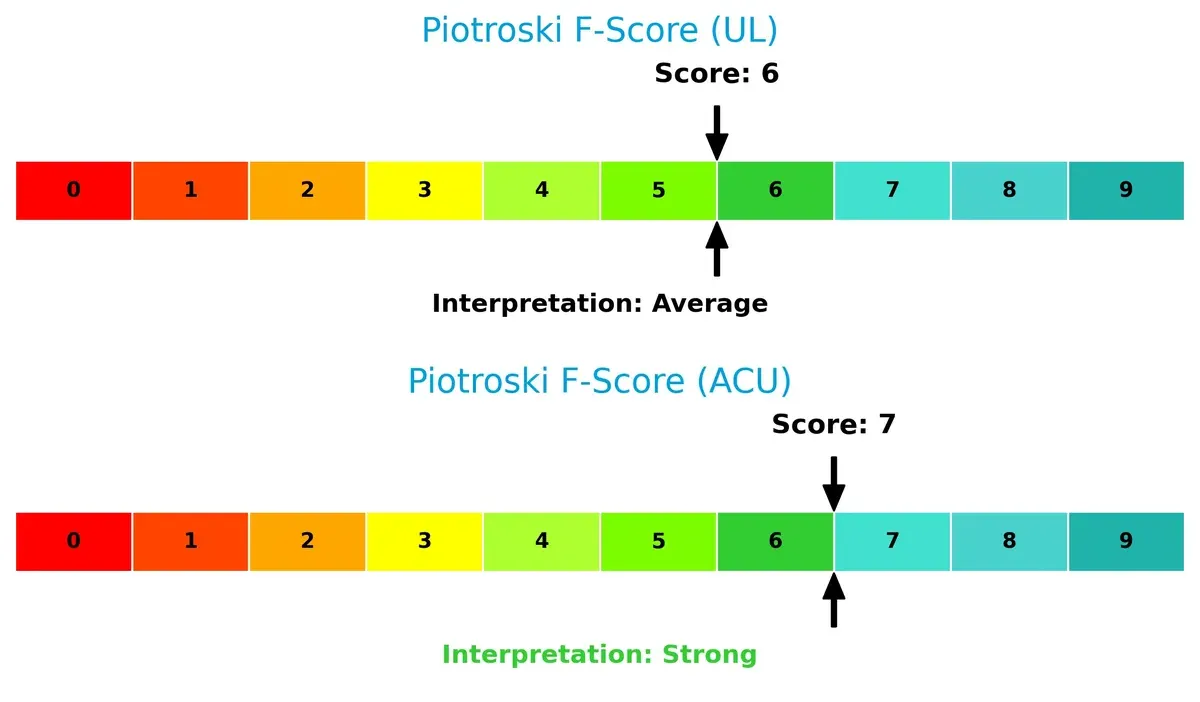
Financial Health: Quality of Operations
Acme United’s Piotroski F-Score of 7 outperforms Unilever’s 6, indicating stronger internal financial health. This suggests Acme manages profitability, leverage, and liquidity with slightly better discipline:
How are the two companies positioned?
This section dissects the operational DNA of Unilever and Acme United by comparing their revenue distribution and internal dynamics. The objective is to confront their economic moats and identify which model offers the most durable competitive advantage today.
Revenue Segmentation: The Strategic Mix
This visual comparison dissects how Unilever PLC and Acme United Corporation diversify their income streams and where their primary sector bets lie:
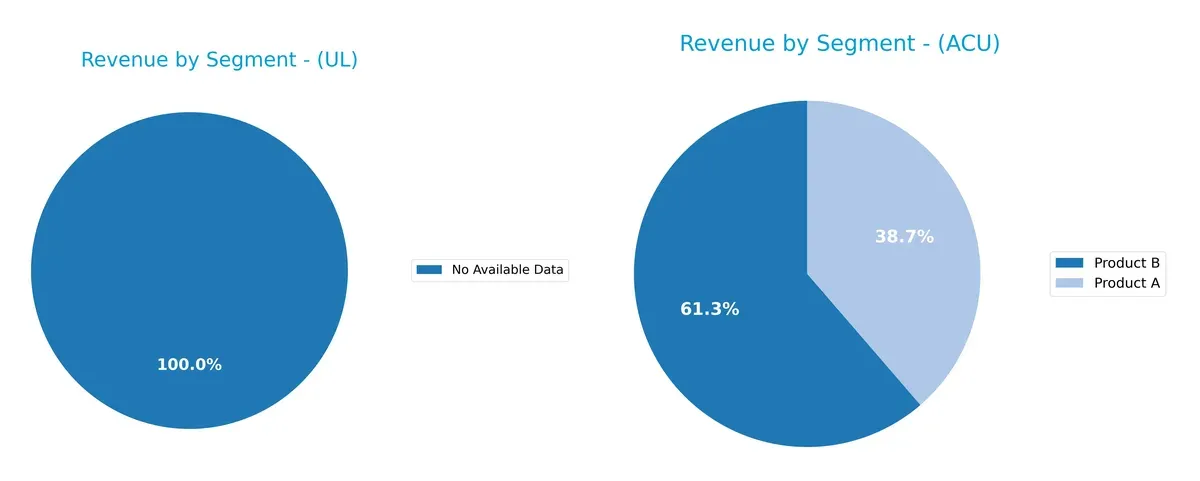
Unilever’s revenue segmentation data is unavailable, preventing direct comparison. Acme United relies heavily on Product B, which dwarfs Product A with $119M vs. $75M in 2024. Historically, Acme also shows strong concentration in the U.S. segment, signaling a strategic bet on geographic dominance. This concentration poses risks but may leverage infrastructure and market positioning effectively. Without Unilever’s data, Acme’s focused segmentation stands in contrast to typical broad consumer goods diversification.
Strengths and Weaknesses Comparison
This table compares the strengths and weaknesses of Unilever PLC and Acme United Corporation:
Unilever PLC Strengths
- Strong global presence across Europe, Americas, Asia Pacific, and Africa
- High ROE of 28.73%, indicating efficient equity use
- ROIC at 11.12% well above WACC of 4.46%, showing value creation
- Favorable interest coverage of 10.06 supports debt servicing
- Dividend yield of 2.79% appeals to income investors
Acme United Corporation Strengths
- Favorable P/E of 13.78 and P/B of 1.29 indicate undervaluation
- Strong asset turnover of 1.2 and fixed asset turnover of 5.33 reflect operational efficiency
- Low debt-to-equity ratio of 0.31 reduces financial risk
- Diverse revenue from Product A and B with increasing sales
- Geographic concentration in North America with growing U.S. market
Unilever PLC Weaknesses
- Low current ratio of 0.76 and quick ratio of 0.56 signal liquidity constraints
- High debt-to-equity of 1.53 increases leverage risk
- Price-to-book of 7.74 suggests potential overvaluation
- Net margin neutral at 9.45%, indicating moderate profitability
- Asset turnover moderate at 0.76 limits revenue generation from assets
Acme United Corporation Weaknesses
- ROE at 9.37% is low compared to sector benchmarks, showing weaker profitability
- Current ratio high at 4.17 may indicate inefficient asset use
- Dividend yield neutral at 1.61% offers limited income
- Geographic concentration risks due to heavy U.S. dependency
- Net margin neutral at 5.15% points to modest profitability
Unilever demonstrates a broad global footprint and strong capital efficiency but faces liquidity and valuation challenges. Acme shows operational efficiency and lower leverage with potential valuation appeal, yet profitability and geographic concentration require monitoring. Both companies illustrate distinct strategic trade-offs in financial health and market positioning.
The Moat Duel: Analyzing Competitive Defensibility
A structural moat shields long-term profits from relentless competition erosion. Without it, growth and margins dissolve quickly:
Unilever PLC: Intangible Asset Fortress
Unilever’s moat stems from powerful brand equity and product diversification. This drives stable 18.5% EBIT margins and a 6.7% ROIC premium over WACC. Expansion in emerging markets and innovation could deepen its moat, though margin pressure looms.
Acme United Corporation: Niche Cost and Product Advantage
Acme United relies on specialized product lines and cost-efficient manufacturing. Its 7.4% EBIT margin and ROIC below WACC reflect weaker value creation versus Unilever. Growth depends on penetrating new industrial markets and revitalizing product mix.
Brand Equity vs. Specialized Cost Leadership
Unilever holds the wider moat with strong value creation and diversified global reach. Acme United’s narrower moat suffers from profitability challenges and slower ROIC growth. Unilever is better positioned to defend and grow market share amid intensifying competition.
Which stock offers better returns?
The past year shows Unilever PLC gaining 23.44%, reflecting a strong but decelerating bullish trend. Acme United Corporation grew 5.21%, accelerating its upward momentum since late 2025.
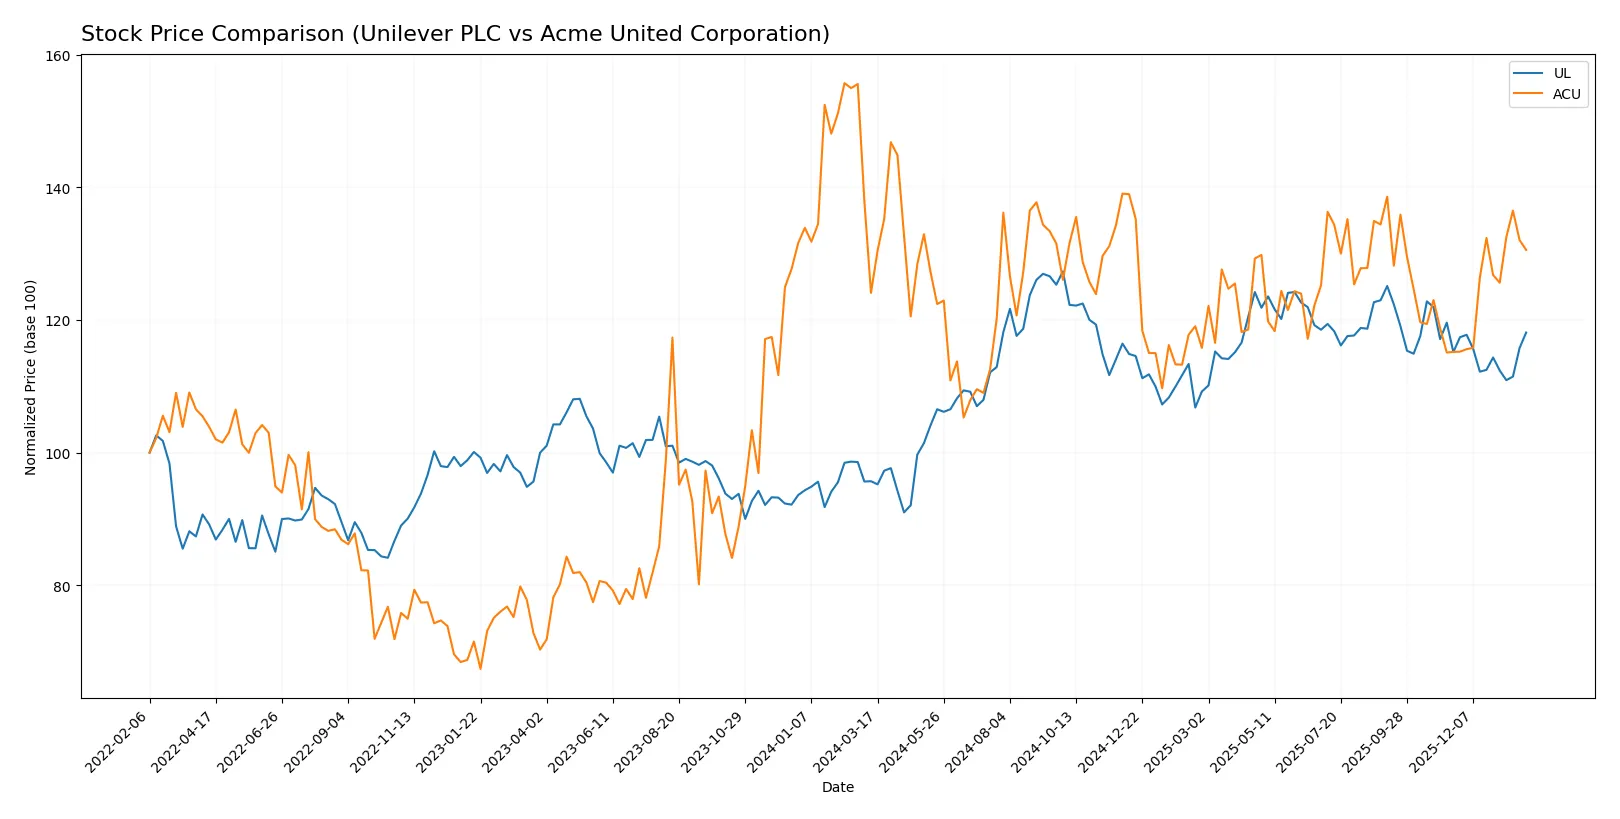
Trend Comparison
Unilever PLC’s stock rose 23.44% over the past 12 months, indicating a bullish trend with decelerating price gains. The range spanned 52.66 to 73.69, with moderate volatility (4.65 std deviation).
Acme United Corporation’s shares increased 5.21% last year, signaling a bullish trend with accelerating gains. Its price moved between 33.7 and 46.99, showing lower volatility than Unilever (2.76 std deviation).
Unilever outperformed Acme with a 23.44% gain versus 5.21%, despite slower momentum recently. Acme’s accelerating trend contrasts with Unilever’s deceleration but did not match its overall return.
Target Prices
Analysts provide a clear target price consensus for Unilever PLC, indicating moderate upside potential.
| Company | Target Low | Target High | Consensus |
|---|---|---|---|
| Unilever PLC | 60.1 | 71 | 65.55 |
The consensus target price for Unilever sits slightly below the current price of $68.36, suggesting limited near-term upside but stable valuation. No verified target price data is available for Acme United Corporation.

Don’t Let Luck Decide Your Entry Point
Optimize your entry points with our advanced ProRealTime indicators. You’ll get efficient buy signals with precise price targets for maximum performance. Start outperforming now!
How do institutions grade them?
Institutional grades for Unilever PLC and Acme United Corporation are summarized below:
Unilever PLC Grades
The table shows recent grading actions by reputable firms for Unilever PLC.
| Grading Company | Action | New Grade | Date |
|---|---|---|---|
| Erste Group | Downgrade | Hold | 2024-11-19 |
| B of A Securities | Upgrade | Buy | 2024-08-22 |
| JP Morgan | Upgrade | Overweight | 2024-05-23 |
| Argus Research | Maintain | Buy | 2024-05-08 |
| Morgan Stanley | Downgrade | Underweight | 2024-02-27 |
| Bernstein | Upgrade | Market Perform | 2022-03-14 |
| Bernstein | Upgrade | Market Perform | 2022-03-13 |
| Bernstein | Upgrade | Market Perform | 2021-11-01 |
| Bernstein | Upgrade | Market Perform | 2021-10-31 |
| Deutsche Bank | Downgrade | Hold | 2021-09-16 |
Acme United Corporation Grades
The table below lists the only recent institutional grade available for Acme United Corporation.
| Grading Company | Action | New Grade | Date |
|---|---|---|---|
| DA Davidson | Maintain | Buy | 2016-07-01 |
Which company has the best grades?
Unilever PLC has multiple recent upgrades and generally holds Buy or Market Perform ratings, reflecting mixed but generally positive sentiment. Acme United’s single, older Buy rating offers limited current insight. Investors may find Unilever’s diverse and recent assessments more informative for decision-making.
Risks specific to each company
The following categories identify the critical pressure points and systemic threats facing both firms in the 2026 market environment:
1. Market & Competition
Unilever PLC
- Competes globally in fast-moving consumer goods, facing stiff competition from multinational giants and shifting consumer preferences.
Acme United Corporation
- Operates in niche segments with limited scale, vulnerable to competition from larger distributors and private label brands.
2. Capital Structure & Debt
Unilever PLC
- High debt-to-equity ratio (1.53) signals elevated leverage risk despite strong interest coverage (10.06).
Acme United Corporation
- Low debt-to-equity ratio (0.31) indicates conservative leverage, supporting financial flexibility.
3. Stock Volatility
Unilever PLC
- Low beta (0.223) shows defensive stock behavior, less sensitive to market swings.
Acme United Corporation
- Moderate beta (0.74) suggests higher volatility and greater market sensitivity.
4. Regulatory & Legal
Unilever PLC
- Faces complex global regulatory environments, including food safety, environmental laws, and labor standards.
Acme United Corporation
- Primarily US-based with fewer regulatory burdens but exposed to product safety and compliance risks.
5. Supply Chain & Operations
Unilever PLC
- Global supply chain exposed to geopolitical tensions and commodity price fluctuations.
Acme United Corporation
- Smaller scale supply chain with potential operational disruptions but more localized control.
6. ESG & Climate Transition
Unilever PLC
- Significant ESG initiatives but pressure to meet aggressive sustainability targets may increase costs.
Acme United Corporation
- Emerging ESG focus; less scrutiny but risks lagging behind peers in climate adaptation.
7. Geopolitical Exposure
Unilever PLC
- Extensive international footprint exposes it to currency risks, trade barriers, and political instability.
Acme United Corporation
- Primarily domestic US operations reduce direct geopolitical risk but limit growth diversification.
Which company shows a better risk-adjusted profile?
Unilever’s major risk stems from its high leverage amid global operational complexity. Acme’s key risk lies in its smaller scale and market niche vulnerability. Acme’s stronger balance sheet and favorable valuation metrics offer a better risk-adjusted profile. Notably, Unilever’s current ratio below 1 signals liquidity pressure, amplifying risk concerns despite its global strength.
Final Verdict: Which stock to choose?
Unilever PLC’s superpower lies in its robust capital efficiency and strong brand moat, delivering solid returns on equity well above cost of capital. Its point of vigilance is the stretched balance sheet and suboptimal liquidity ratios. It suits portfolios aiming for steady, slightly favorable value creation with moderate growth.
Acme United Corporation’s strategic moat is its low valuation and solid financial stability, reflected in conservative leverage and strong asset turnover. Compared to Unilever, it offers a safer capital structure but faces challenges in profitability growth. It fits well within GARP portfolios seeking undervalued growth with a margin of safety.
If you prioritize capital efficiency and brand-driven value creation, Unilever outshines with its proven economic moat despite financial leverage risks. However, if you seek undervalued stability and cleaner balance sheets for risk-conscious growth, Acme United offers better stability and a more attractive entry point in a niche market. Both present distinct analytical scenarios depending on your risk tolerance and growth expectations.
Disclaimer: Investment carries a risk of loss of initial capital. The past performance is not a reliable indicator of future results. Be sure to understand risks before making an investment decision.
Go Further
I encourage you to read the complete analyses of Unilever PLC and Acme United Corporation to enhance your investment decisions: