Home > Comparison > Consumer Defensive > PG vs ACU
The strategic rivalry between The Procter & Gamble Company and Acme United Corporation shapes the Household & Personal Products industry landscape. Procter & Gamble operates as a global, capital-intensive consumer goods giant with diversified product segments. In contrast, Acme United focuses on niche, high-margin safety and cutting tools with a lean operational model. This analysis contrasts their corporate strategies to identify which stock offers superior risk-adjusted returns for a diversified portfolio.
Table of contents
Companies Overview
The Procter & Gamble Company and Acme United Corporation shape the household and personal products market with distinct scales and strategies.
The Procter & Gamble Company: Global Consumer Goods Leader
Procter & Gamble dominates as a branded consumer packaged goods giant with a $355B market cap. It generates revenue through diverse segments including Beauty, Grooming, Health Care, Fabric & Home Care, and Baby, Feminine & Family Care. In 2026, its strategic focus emphasizes expanding digital commerce and innovation to maintain global brand leadership.
Acme United Corporation: Specialty Cutting and Safety Products
Acme United operates as a niche supplier of first aid, cutting, and safety tools with a $159M market cap. It earns revenue from branded products under Westcott, Clauss, Camillus, and others, targeting schools, offices, and industrial markets. The company’s 2026 strategy centers on broadening product offerings and strengthening distribution channels in North America and Europe.
Strategic Collision: Similarities & Divergences
Both companies compete within the consumer defensive sector but diverge sharply in scale and scope. Procter & Gamble pursues a broad, diversified portfolio with global reach, while Acme United focuses on specialized, smaller-scale product lines and regional expansion. Their battleground lies in brand strength versus product innovation. Investors face contrasting profiles: P&G’s stability and scale versus Acme’s growth potential and agility.
Income Statement Comparison
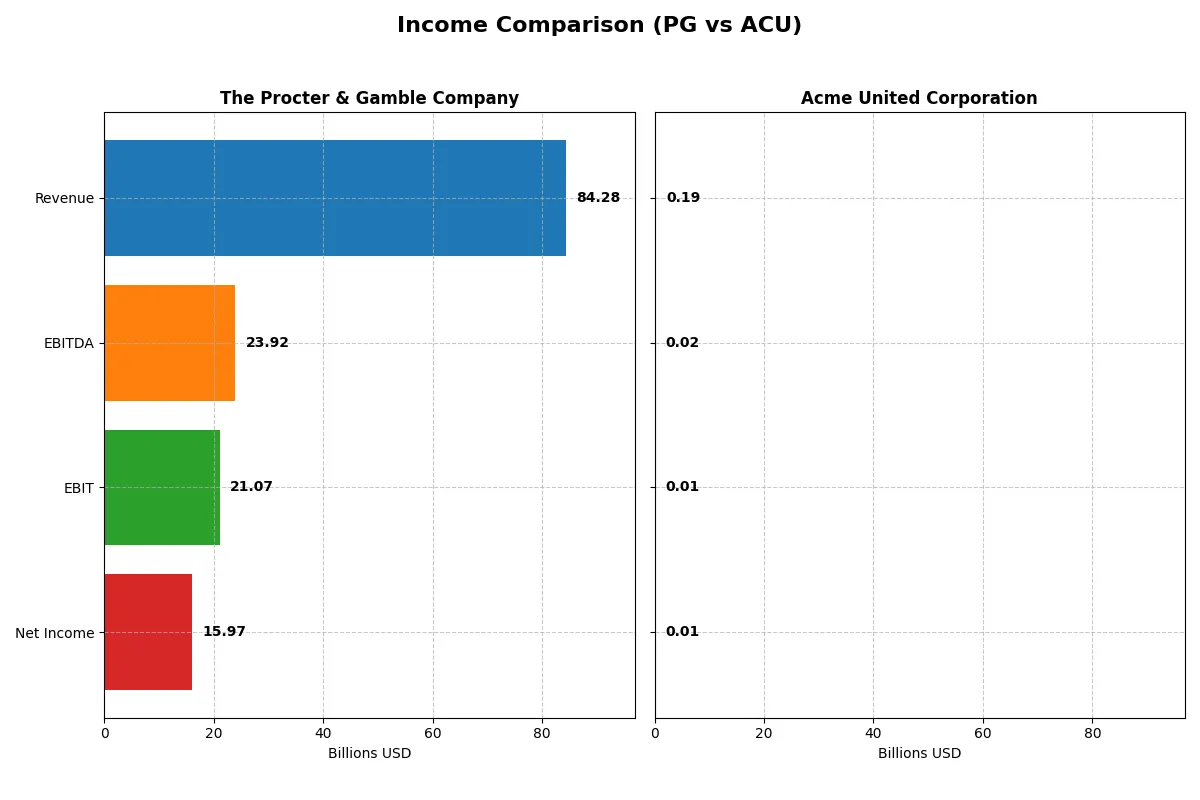
This data dissects the core profitability and scalability of both corporate engines to reveal who dominates the bottom line:
| Metric | The Procter & Gamble Company (PG) | Acme United Corporation (ACU) |
|---|---|---|
| Revenue | 84.3B | 194.5M |
| Cost of Revenue | 41.2B | 118.1M |
| Operating Expenses | 22.7B | 62.2M |
| Gross Profit | 43.1B | 76.4M |
| EBITDA | 23.9B | 20.4M |
| EBIT | 21.1B | 14.4M |
| Interest Expense | 907M | 2.1M |
| Net Income | 15.97B | 10.0M |
| EPS | 6.67 | 2.71 |
| Fiscal Year | 2025 | 2024 |
Income Statement Analysis: The Bottom-Line Duel
This income statement comparison will reveal which company deploys its resources most efficiently to generate profits and sustain growth.
The Procter & Gamble Company Analysis
Procter & Gamble’s revenue climbed steadily from 76B in 2021 to 84.3B in 2025, with net income rising from 14.3B to nearly 16B. The firm maintains robust margins, boasting a gross margin above 51% and a net margin near 19%, indicating strong cost control. In 2025, EBIT grew 7%, reflecting improving operational momentum despite flat revenue growth.
Acme United Corporation Analysis
Acme United’s revenue advanced from 164M in 2020 to 194M in 2024, with net income surging from 8.1M to 10M. Gross margin stands at a favorable 39%, but EBIT margin lags at 7.4%, signaling thinner profitability. The latest year shows a sharp decline in EBIT and net margin by over 44%, suggesting recent operational challenges despite long-term growth.
Margin Dominance vs. Growth Volatility
P&G leads with superior margin health and consistent profit expansion, delivering nearly 19% net margin and steady EBIT growth. Acme United, while growing revenue and net income over five years, faces recent margin compression and earnings volatility. For investors prioritizing stability and efficiency, P&G’s profile offers a clearer value proposition.
Financial Ratios Comparison
These vital ratios act as a diagnostic tool to expose underlying fiscal health, valuation premiums, and capital efficiency across companies:
| Ratios | The Procter & Gamble Company (PG) | Acme United Corporation (ACU) |
|---|---|---|
| ROE | 30.7% | 9.4% |
| ROIC | 16.5% | 8.2% |
| P/E | 24.5 | 13.8 |
| P/B | 7.52 | 1.29 |
| Current Ratio | 0.70 | 4.17 |
| Quick Ratio | 0.49 | 1.71 |
| D/E (Debt-to-Equity) | 0.68 | 0.31 |
| Debt-to-Assets | 28.3% | 20.3% |
| Interest Coverage | 22.5 | 6.8 |
| Asset Turnover | 0.67 | 1.20 |
| Fixed Asset Turnover | 3.53 | 5.33 |
| Payout Ratio | 61.8% | 22.2% |
| Dividend Yield | 2.52% | 1.61% |
| Fiscal Year | 2025 | 2024 |
Efficiency & Valuation Duel: The Vital Signs
Financial ratios act as a company’s DNA, exposing hidden risks and highlighting operational strengths essential for investor insight.
The Procter & Gamble Company
Procter & Gamble demonstrates robust profitability with a 30.7% ROE and a strong 18.95% net margin. Its valuation is fair, with a neutral 24.5 P/E but an elevated 7.5 P/B, indicating some price premium. The company rewards shareholders via a 2.52% dividend yield, balancing steady income with reinvestment in its core operations.
Acme United Corporation
Acme United posts modest profitability, with a 9.37% ROE and a neutral 5.15% net margin. It trades at a more attractive 13.8 P/E and a low 1.29 P/B, reflecting potential undervaluation. The firm’s shareholder returns lean on moderate dividends (1.61%) and a focus on operational efficiency, evidenced by favorable asset turnover ratios.
Valuation Discipline vs. Profitability Strength
Procter & Gamble offers higher profitability but trades at a stretched price-to-book ratio, exposing valuation risk. Acme United presents leaner profits but a more disciplined valuation profile. Investors prioritizing stable earnings and dividend yield may favor Procter & Gamble, while value-focused investors might lean toward Acme United’s operational efficiency and lower multiples.
Which one offers the Superior Shareholder Reward?
I observe that The Procter & Gamble Company (PG) offers a more balanced distribution strategy combining a stable 2.5% dividend yield with a high 62% payout ratio. PG’s free cash flow comfortably covers dividends, supporting sustainability. Its share buybacks, while less aggressive than Acme United Corporation’s (ACU), add steady value. ACU yields a lower 1.6% dividend with a 22% payout ratio, reflecting a conservative cash return focus. However, ACU’s buyback intensity surpasses PG’s, enhancing total returns but with less dividend reliability. I conclude PG’s integrated dividend and buyback approach delivers a superior total shareholder reward in 2026.
Comparative Score Analysis: The Strategic Profile
The radar chart reveals the fundamental DNA and trade-offs of The Procter & Gamble Company and Acme United Corporation:
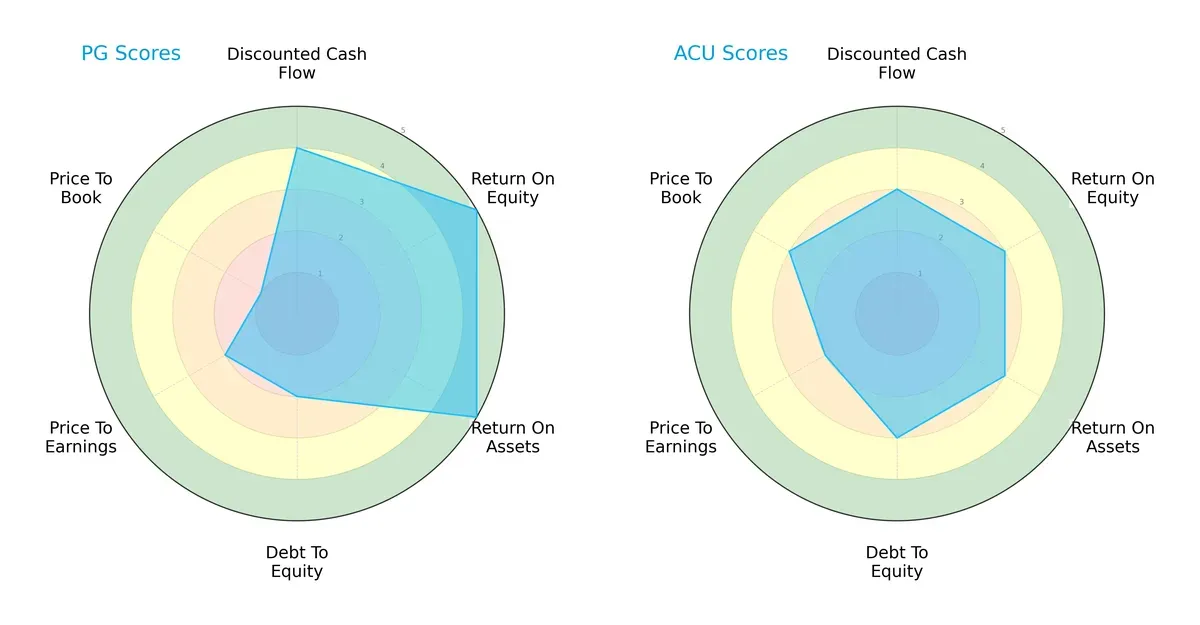
The Procter & Gamble Company outperforms Acme United in profitability metrics, showing superior ROE (5 vs. 3) and ROA (5 vs. 3). However, P&G carries higher valuation risks with weaker Price-to-Book (1 vs. 3) and Debt-to-Equity scores (2 vs. 3). Acme United exhibits a more balanced but moderate profile, relying less on leverage and valuation extremes.
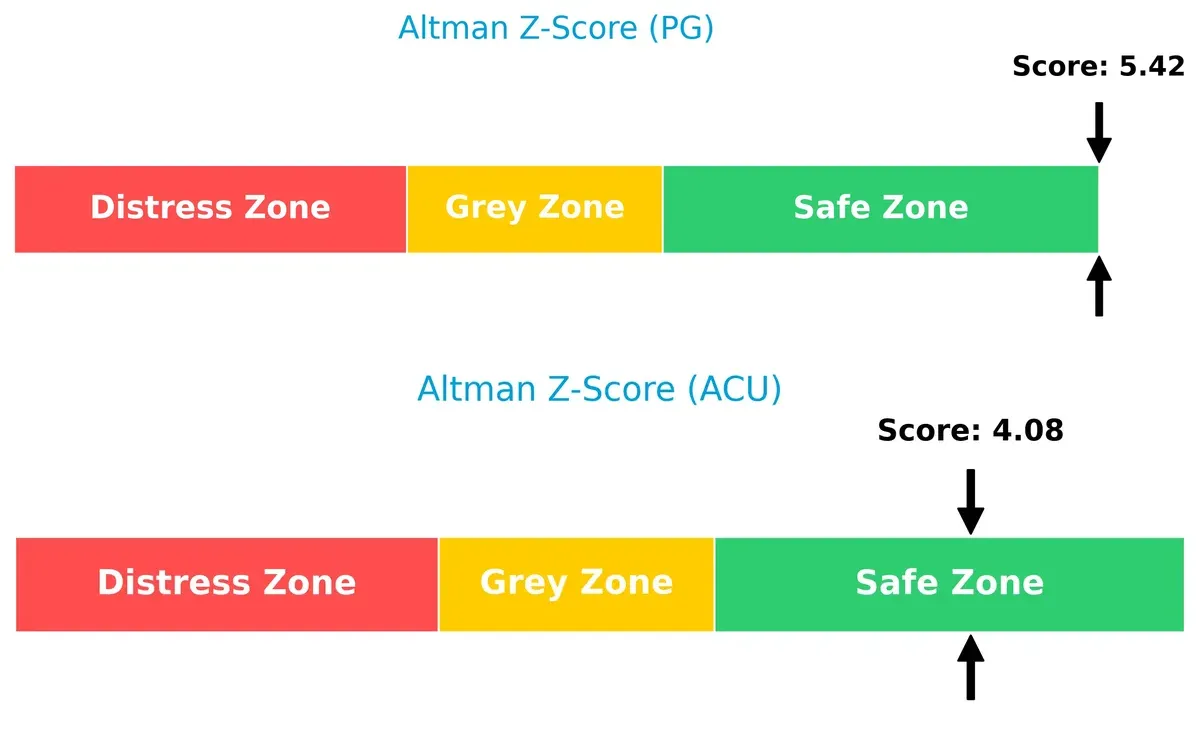
Bankruptcy Risk: Solvency Showdown
The Procter & Gamble Company’s Altman Z-Score (5.42) surpasses Acme United’s (4.08), signaling a stronger buffer against bankruptcy risks in this economic cycle:
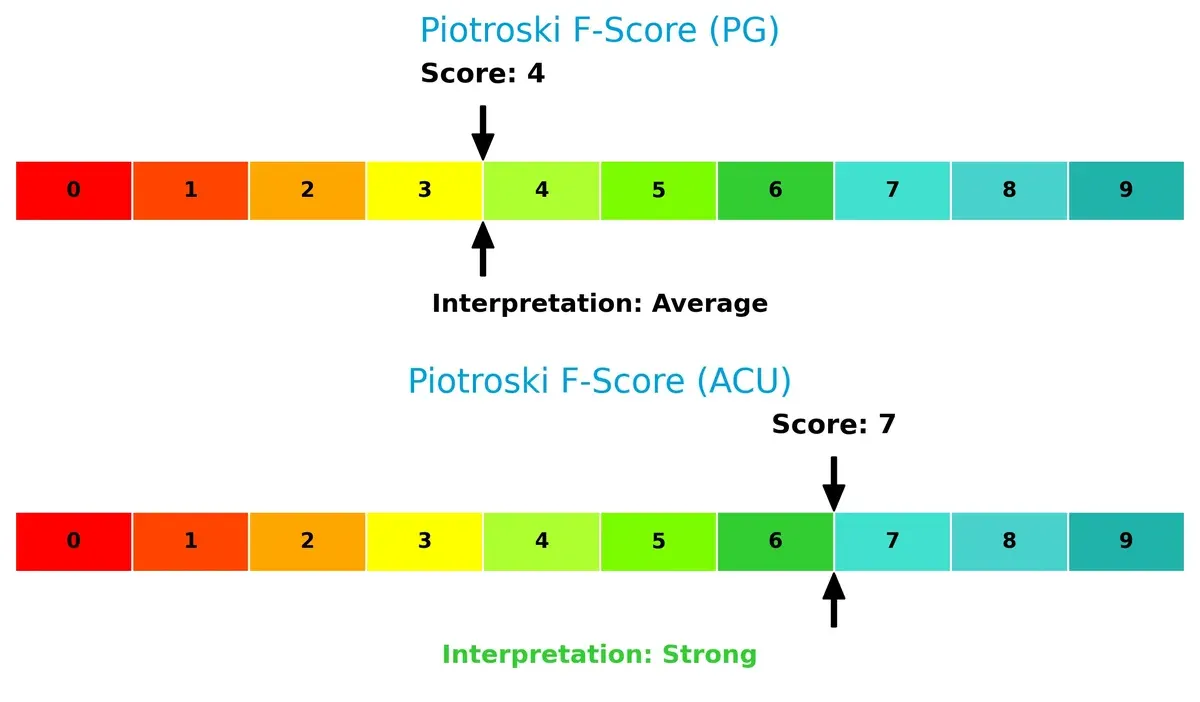
Financial Health: Quality of Operations
Acme United leads with a Piotroski F-Score of 7 versus P&G’s 4, indicating healthier internal operations and fewer red flags in financial quality:
How are the two companies positioned?
This section dissects PG and ACU’s operational DNA by comparing their revenue distribution and internal dynamics. The goal is to confront their economic moats to identify which model offers the most resilient competitive advantage today.
Revenue Segmentation: The Strategic Mix
This visual comparison dissects how The Procter & Gamble Company and Acme United Corporation diversify their income streams and where their primary sector bets lie:
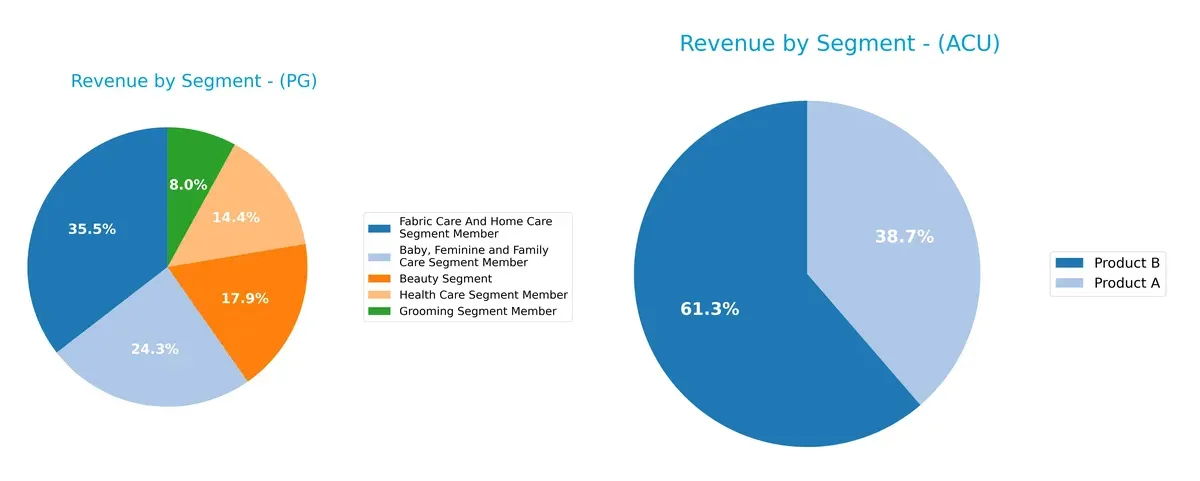
Procter & Gamble boasts a broad revenue mix, with Fabric Care & Home Care anchoring at $29.6B and strong contributions from Baby Care ($20.2B) and Beauty ($14.9B). Acme United leans heavily on Product B, which dwarfs Product A at $119M vs. $75M in 2024. P&G’s diversified portfolio reduces concentration risk, while Acme’s focus on fewer products increases exposure but may allow sharper strategic focus.
Strengths and Weaknesses Comparison
This table compares the Strengths and Weaknesses of The Procter & Gamble Company (PG) and Acme United Corporation (ACU):
PG Strengths
- Diverse product segments with over $94B revenue
- Strong global presence with balanced US and Non-US sales
- High net margin (18.95%) and ROE (30.71%) indicate superior profitability
- Favorable ROIC (16.47%) vs WACC (5.4%) shows efficient capital allocation
- High interest coverage (23.23) reduces financial risk
- Robust fixed asset turnover (3.53) reflects asset efficiency
ACU Strengths
- Favorable valuation metrics (PE 13.78, PB 1.29) suggest market undervaluation
- Favorable ROIC (8.16%) and WACC (6.96%) indicate solid capital returns
- Strong liquidity ratios (quick ratio 1.71) enhance short-term financial stability
- Low debt-to-equity (0.31) and debt-to-assets (20.25%) signal conservative leverage
- Higher asset turnover (1.2) and fixed asset turnover (5.33) imply operational efficiency
- Geographic diversification across US, Europe, and Canada
PG Weaknesses
- Low current (0.7) and quick ratios (0.49) raise liquidity concerns
- High price-to-book (7.52) signals possible overvaluation
- Moderate asset turnover (0.67) limits revenue generation efficiency
- Dependence on mature consumer goods markets might constrain growth
ACU Weaknesses
- Lower profitability with net margin (5.15%) and ROE (9.37%) below sector leaders
- Current ratio (4.17) unusually high, may indicate inefficient working capital use
- Smaller scale and less diversified product portfolio limit market power
- Geographic sales heavily concentrated in the US
Both companies show favorable financial health but differ in scale and profitability. PG’s broad diversification and strong returns contrast with ACU’s efficient operations and attractive valuation. These factors shape their strategic priorities going forward.
The Moat Duel: Analyzing Competitive Defensibility
A structural moat is the only true shield protecting long-term profits from the relentless erosion of competition. Let’s examine how each company defends its turf:
The Procter & Gamble Company: Brand Power and Scale Moat
P&G’s moat centers on its vast portfolio of trusted brands and scale economies. This manifests in a very favorable ROIC 11% above WACC and stable margins near 19%. New product innovations and global market expansion in 2026 should strengthen this moat further.
Acme United Corporation: Niche Product Specialization Moat
Acme’s moat relies on specialized cutting and safety tools, a narrower scope than P&G’s broad brand power. Its ROIC lags slightly above cost at 1.2%, with declining profitability signaling pressure. Growth hinges on penetrating new markets or innovating beyond current niches.
Scale Dominance vs. Niche Specialization: Who Wields the Wider Moat?
P&G commands a wider and deeper moat, proven by a durable, growing ROIC and strong global presence. Acme’s shrinking returns and limited scale leave it vulnerable. P&G is clearly better positioned to defend and grow its market share in 2026 and beyond.
Which stock offers better returns?
The past year reveals contrasting price movements: one stock declines with accelerating losses, while the other gains steadily with rising momentum.
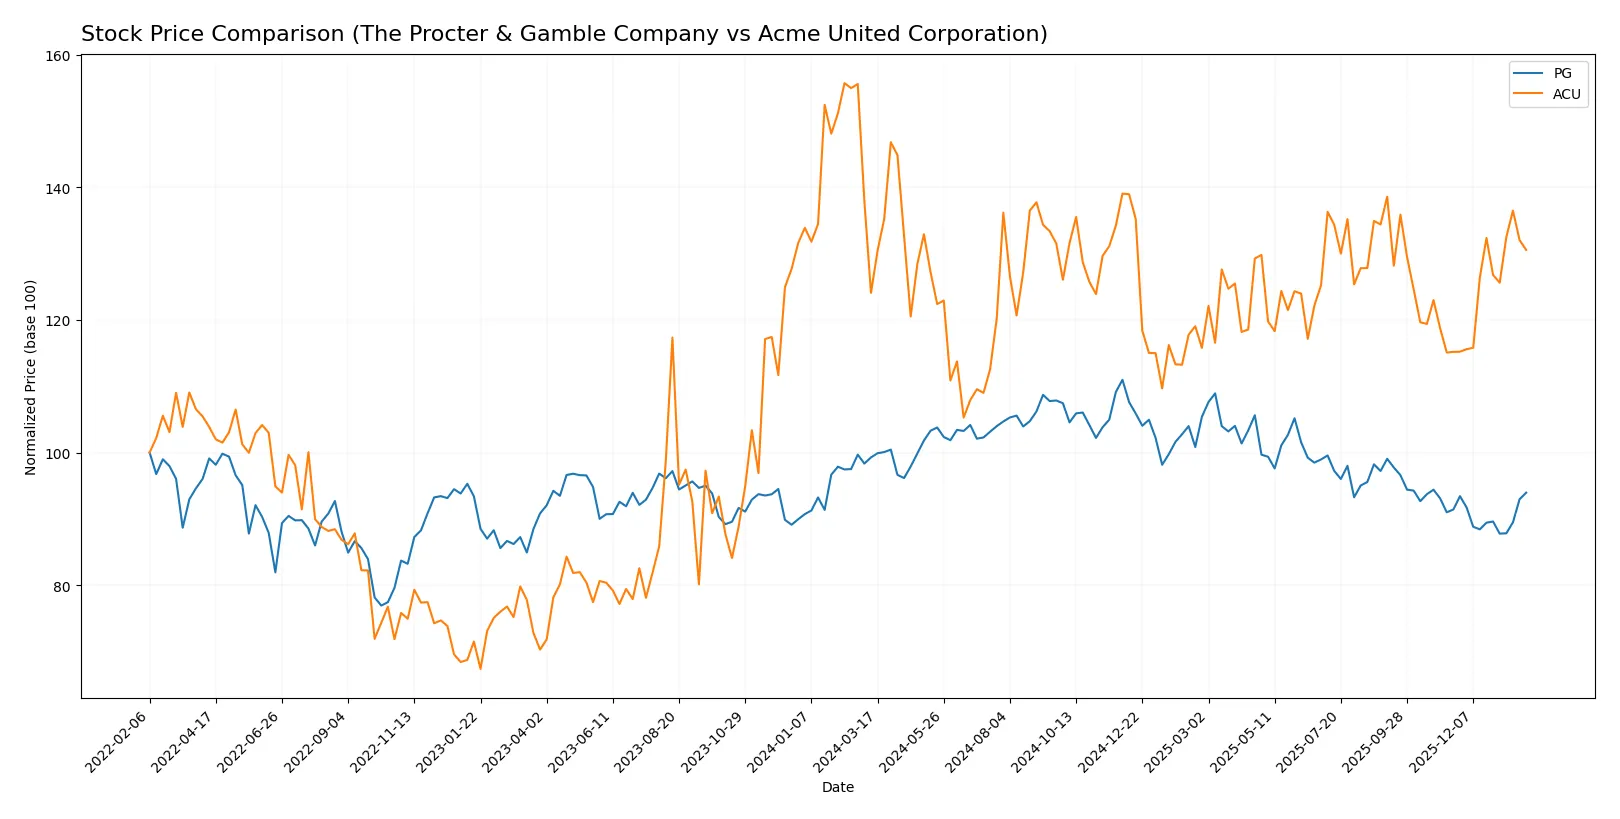
Trend Comparison
The Procter & Gamble Company (PG) shows a bearish trend over the past 12 months, with a -5.35% price change and accelerating downward momentum. Recent months indicate a mild bullish rebound of 2.78%.
Acme United Corporation (ACU) displays a bullish trend, rising 5.21% over the year with accelerating gains and lower volatility. The recent 13.34% surge confirms strong positive momentum.
Comparing both, ACU outperforms PG in market returns, delivering stronger growth and acceleration throughout the year.
Target Prices
Analysts present a clear target price consensus for The Procter & Gamble Company, reflecting moderate upside potential.
| Company | Target Low | Target High | Consensus |
|---|---|---|---|
| The Procter & Gamble Company | 150 | 179 | 165.67 |
The consensus target price of 165.67 suggests a 9% upside from the current 151.77 stock price. This indicates cautious optimism among analysts. No verified target price data is available for Acme United Corporation.

Don’t Let Luck Decide Your Entry Point
Optimize your entry points with our advanced ProRealTime indicators. You’ll get efficient buy signals with precise price targets for maximum performance. Start outperforming now!
How do institutions grade them?
Here is a summary of recent institutional grades for The Procter & Gamble Company and Acme United Corporation:
The Procter & Gamble Company Grades
Below are recent grades from reputable financial institutions for PG:
| Grading Company | Action | New Grade | Date |
|---|---|---|---|
| TD Cowen | Downgrade | Hold | 2026-01-27 |
| UBS | Maintain | Buy | 2026-01-23 |
| JP Morgan | Upgrade | Overweight | 2026-01-23 |
| Wells Fargo | Maintain | Overweight | 2026-01-23 |
| UBS | Maintain | Buy | 2026-01-14 |
| TD Cowen | Maintain | Buy | 2026-01-08 |
| Wells Fargo | Maintain | Overweight | 2026-01-05 |
| JP Morgan | Maintain | Neutral | 2025-12-18 |
| Jefferies | Upgrade | Buy | 2025-12-17 |
| JP Morgan | Maintain | Neutral | 2025-10-27 |
Acme United Corporation Grades
Below is the only available institutional grade for ACU:
| Grading Company | Action | New Grade | Date |
|---|---|---|---|
| DA Davidson | Maintain | Buy | 2016-07-01 |
Which company has the best grades?
The Procter & Gamble Company has a broader and more recent set of grades, mostly Buy and Overweight, indicating stronger institutional confidence. Acme United Corporation has only one dated Buy rating from 2016. Investors may view PG’s current and multiple upgrades as a signal of sustained institutional support.
Risks specific to each company
The following categories identify the critical pressure points and systemic threats facing both firms in the 2026 market environment:
1. Market & Competition
The Procter & Gamble Company
- Dominates consumer packaged goods with strong brand moats but faces intense global competition and evolving consumer trends.
Acme United Corporation
- Operates in niche cutting and first aid supplies markets, facing limited but specialized competition and lower brand recognition.
2. Capital Structure & Debt
The Procter & Gamble Company
- Maintains moderate debt-to-equity at 0.68 with strong interest coverage of 23.2x, reflecting prudent leverage management.
Acme United Corporation
- Lower debt-to-equity at 0.31 and solid interest coverage of 6.9x, indicating conservative capital structure but with less financial firepower.
3. Stock Volatility
The Procter & Gamble Company
- Exhibits low beta of 0.39, signaling defensive stock behavior and lower market volatility exposure.
Acme United Corporation
- Higher beta of 0.74, implying greater price swings and increased sensitivity to market cycles.
4. Regulatory & Legal
The Procter & Gamble Company
- Faces extensive regulatory scrutiny due to global scale and product diversity, increasing compliance costs and litigation risks.
Acme United Corporation
- Encounters moderate regulatory oversight in safety and consumer product standards, with less complex legal exposure.
5. Supply Chain & Operations
The Procter & Gamble Company
- Complex global supply chain vulnerable to disruptions but benefits from scale and advanced logistics capabilities.
Acme United Corporation
- Smaller, more localized supply chain reduces complexity but limits economies of scale and operational flexibility.
6. ESG & Climate Transition
The Procter & Gamble Company
- Faces strong ESG pressures to reduce carbon footprint and improve sustainability, critical for brand reputation.
Acme United Corporation
- Emerging ESG initiatives but less public pressure due to smaller footprint and industry profile.
7. Geopolitical Exposure
The Procter & Gamble Company
- Significant exposure to global geopolitical risks due to multinational operations and international sales.
Acme United Corporation
- Primarily North American focus limits geopolitical risk but constrains growth diversification.
Which company shows a better risk-adjusted profile?
The Procter & Gamble Company faces its most impactful risk in regulatory and supply chain complexity, while Acme United’s chief concern lies in higher stock volatility and limited market scale. PG’s robust capital structure and low volatility grant it a superior risk-adjusted profile. PG’s ample interest coverage and low beta mitigate financial and market risks more effectively than ACU’s higher beta and smaller scale.
Final Verdict: Which stock to choose?
The Procter & Gamble Company (PG) commands a durable competitive edge with its ability to generate consistently high returns on invested capital well above its cost of capital. It operates as a cash machine with impressive profitability and margin resilience. A point of vigilance remains its stretched liquidity ratios. PG fits well in portfolios seeking steady, long-term income and value preservation.
Acme United Corporation (ACU) offers a strategic moat rooted in its undervalued price multiples and solid asset turnover, reflecting operational efficiency. Its financial safety profile appears stronger on liquidity metrics compared to PG, though profitability and ROIC trends signal caution. ACU could appeal to investors targeting GARP strategies with a tilt toward value and growth potential in smaller-cap exposure.
If you prioritize durable value creation and income stability, PG is the compelling choice due to its proven moat and superior profitability metrics. However, if you seek a more aggressive GARP profile with better liquidity and growth upside at a reasonable valuation, ACU offers better stability in that niche. Both carry distinct risks, so alignment with your investment horizon and risk tolerance is essential.
Disclaimer: Investment carries a risk of loss of initial capital. The past performance is not a reliable indicator of future results. Be sure to understand risks before making an investment decision.
Go Further
I encourage you to read the complete analyses of The Procter & Gamble Company and Acme United Corporation to enhance your investment decisions: