Home > Comparison > Consumer Defensive > EL vs ACU
The strategic rivalry between The Estée Lauder Companies Inc. and Acme United Corporation shapes the competitive landscape of the Consumer Defensive sector. Estée Lauder operates as a global leader in premium personal products, leveraging brand diversity and scale. Acme United focuses on niche safety and cutting tools with a more specialized operational model. This analysis aims to identify which company offers a superior risk-adjusted growth trajectory for a diversified portfolio in this evolving market.

Table of contents
Companies Overview
The Estée Lauder Companies and Acme United Corporation hold distinct yet influential positions in the household and personal products market.
The Estée Lauder Companies Inc.: Leader in Prestige Beauty Products
The Estée Lauder Companies excels as a global powerhouse in luxury skin care, makeup, fragrance, and hair care. It generates revenue through a diversified portfolio of iconic brands sold via department stores, specialty retailers, and digital platforms. In 2026, the company focuses strategically on expanding its digital presence and premium product innovation to sustain growth and market dominance.
Acme United Corporation: Specialty Tools and Safety Solutions Provider
Acme United serves niche markets with cutting, safety, and first aid products for schools, offices, and industries. Its core revenue stems from branded tools like Westcott scissors and First Aid Only kits distributed through wholesalers and retailers. The company’s 2026 strategy centers on broadening product lines and enhancing distribution channels to capture more specialized market segments.
Strategic Collision: Similarities & Divergences
Both companies operate in the consumer defensive sector yet pursue different philosophies—Estée Lauder cultivates a vast premium brand ecosystem, while Acme United emphasizes targeted utility and safety products. Their competition unfolds primarily in retail distribution and brand loyalty. Estée Lauder appeals to luxury investors; Acme United attracts those favoring steady niche market exposure.
Income Statement Comparison
This data dissects the core profitability and scalability of both corporate engines to reveal who dominates the bottom line:
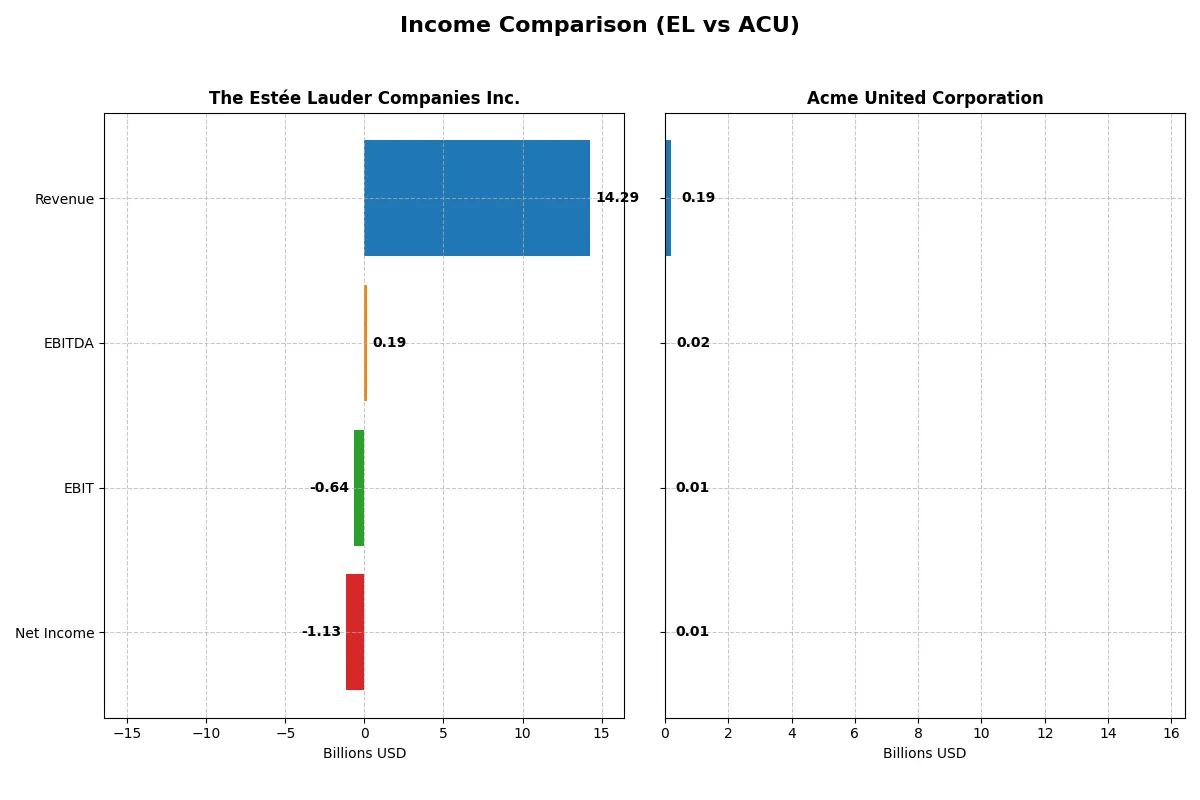
| Metric | The Estée Lauder Companies Inc. (EL) | Acme United Corporation (ACU) |
|---|---|---|
| Revenue | 14.3B | 194.5M |
| Cost of Revenue | 3.73B | 118.1M |
| Operating Expenses | 9.60B | 62.2M |
| Gross Profit | 10.6B | 76.4M |
| EBITDA | 193M | 20.4M |
| EBIT | -636M | 14.4M |
| Interest Expense | 404M | 2.1M |
| Net Income | -1.13B | 10.0M |
| EPS | -3.15 | 2.71 |
| Fiscal Year | 2025 | 2024 |
Income Statement Analysis: The Bottom-Line Duel
This income statement comparison reveals which company operates its core business more efficiently and sustains profitability under market pressures.
The Estée Lauder Companies Inc. Analysis
Estée Lauder’s revenue declined steadily from $17.7B in 2022 to $14.3B in 2025, with net income plunging from $2.4B to a -$1.1B loss. Despite a strong gross margin near 74%, the company’s net margin turned sharply negative in 2025, reflecting deteriorating profitability and operational challenges. The recent year signals a troubling downturn in earnings efficiency.
Acme United Corporation Analysis
Acme United’s revenue showed modest growth, reaching $194M in 2024, up from $164M in 2020. Net income rose from $8.1M to $10M in 2024, though it dipped from $18M in 2023. The firm maintains a healthy gross margin above 39% and a positive net margin over 5%, indicating stable profitability despite some volatility in operating income. Recent performance suggests resilience but with margin pressure.
Verdict: Scale Versus Stability in Profitability
Estée Lauder leads in scale but suffers from deteriorating margins and a net loss in the latest year. Acme United, while smaller, sustains consistent profitability with positive margin trends. For investors prioritizing steady earnings and margin health, Acme’s profile offers more reliability, whereas Estée Lauder’s scale comes with heightened risk from recent operational inefficiencies.
Financial Ratios Comparison
These vital ratios act as a diagnostic tool to expose the underlying fiscal health, valuation premiums, and capital efficiency of each company:
| Ratios | The Estée Lauder Companies Inc. (EL) | Acme United Corporation (ACU) |
|---|---|---|
| ROE | -29.3% (2025) | 9.4% (2024) |
| ROIC | 6.4% (2025) | 8.2% (2024) |
| P/E | -25.7 (2025) | 13.8 (2024) |
| P/B | 7.53 (2025) | 1.29 (2024) |
| Current Ratio | 1.30 (2025) | 4.17 (2024) |
| Quick Ratio | 0.92 (2025) | 1.71 (2024) |
| D/E | 2.44 (2025) | 0.31 (2024) |
| Debt-to-Assets | 47.5% (2025) | 20.3% (2024) |
| Interest Coverage | 2.37 (2025) | 6.79 (2024) |
| Asset Turnover | 0.72 (2025) | 1.20 (2024) |
| Fixed Asset Turnover | 2.79 (2025) | 5.33 (2024) |
| Payout ratio | -54.5% (2025) | 22.2% (2024) |
| Dividend yield | 2.12% (2025) | 1.61% (2024) |
| Fiscal Year | 2025 | 2024 |
Efficiency & Valuation Duel: The Vital Signs
Financial ratios serve as the company’s DNA, exposing hidden risks and operational excellence essential for informed investment decisions.
The Estée Lauder Companies Inc. (EL)
Estée Lauder shows unfavorable profitability with a -29.31% ROE and negative net margin, indicating operational challenges. Its valuation appears favorable with a low P/E of -25.68, yet a stretched price-to-book of 7.53 raises caution. The company delivers a 2.12% dividend yield, balancing weak profitability with shareholder returns.
Acme United Corporation (ACU)
Acme United maintains neutral profitability with a 9.37% ROE and positive 5.15% net margin, reflecting steady efficiency. Its valuation is attractive, featuring a favorable P/E of 13.78 and a low P/B of 1.29, signaling undervaluation. Strong liquidity and debt metrics support stability, while a modest 1.61% dividend yield complements shareholder value.
Premium Valuation vs. Operational Safety
Acme United offers a superior blend of operational efficiency and conservative valuation, reducing risk for investors. Estée Lauder’s attractive P/E masks underlying profitability weaknesses and high leverage. Investors seeking stability may prefer Acme’s profile, while those tolerating risk might consider Estée Lauder’s potential rebound.
Which one offers the Superior Shareholder Reward?
I compare Estée Lauder (EL) and Acme United Corporation (ACU) by their dividend yields, payout ratios, and buyback intensity. EL yields 2.12% with a negative payout ratio, signaling dividend cuts amid losses. ACU yields 1.61%, with a conservative 22% payout, well covered by free cash flow. EL’s buyback activity is muted, constrained by leverage and negative net income. ACU employs moderate buybacks alongside steady dividends, supported by strong cash flow and lower debt. Historically, ACU’s balanced distribution and robust free cash flow suggest a more sustainable total shareholder return. I conclude ACU offers superior shareholder reward in 2026.
Comparative Score Analysis: The Strategic Profile
The radar chart reveals the fundamental DNA and trade-offs shaping The Estée Lauder Companies Inc. and Acme United Corporation’s financial profiles:
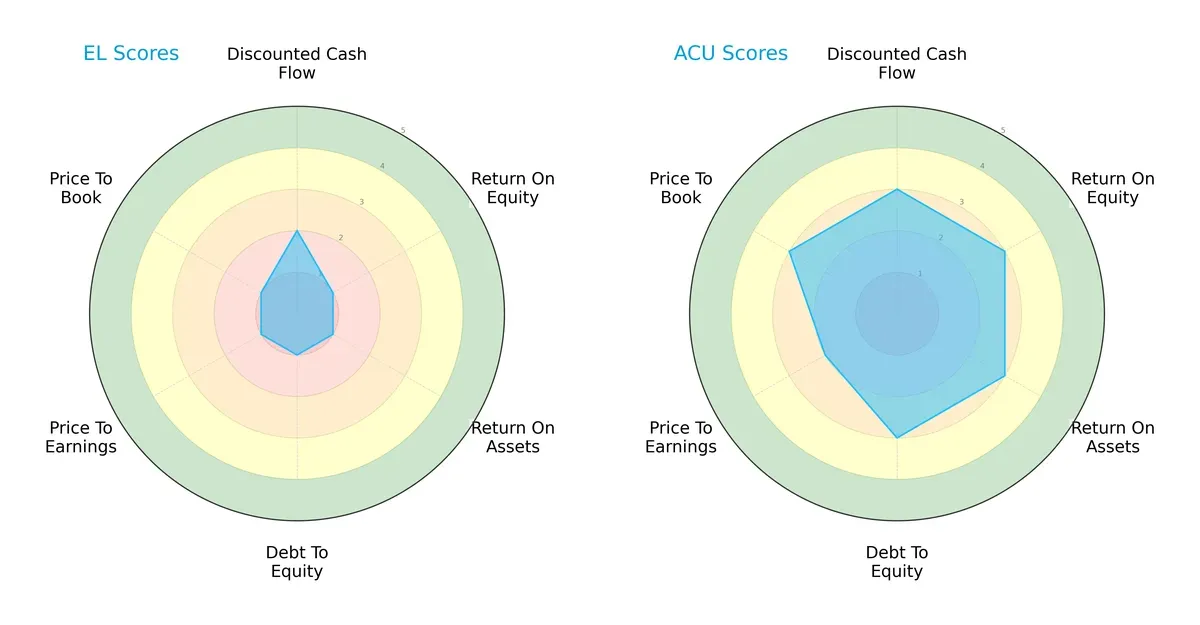
Acme United delivers a more balanced profile with moderate scores across DCF (3), ROE (3), ROA (3), Debt/Equity (3), and valuation metrics (P/E 2, P/B 3). In contrast, Estée Lauder relies heavily on a specific edge in DCF (2) but suffers very unfavorable scores (1) in profitability and leverage, signaling structural weaknesses and valuation risks. Historically in consumer goods, such uneven profiles heighten vulnerability during economic downturns. Acme’s steadier metrics suggest stronger resilience and capital efficiency.
Bankruptcy Risk: Solvency Showdown
The Altman Z-Score delta underscores Acme United’s superior long-term survival prospects in this cycle:
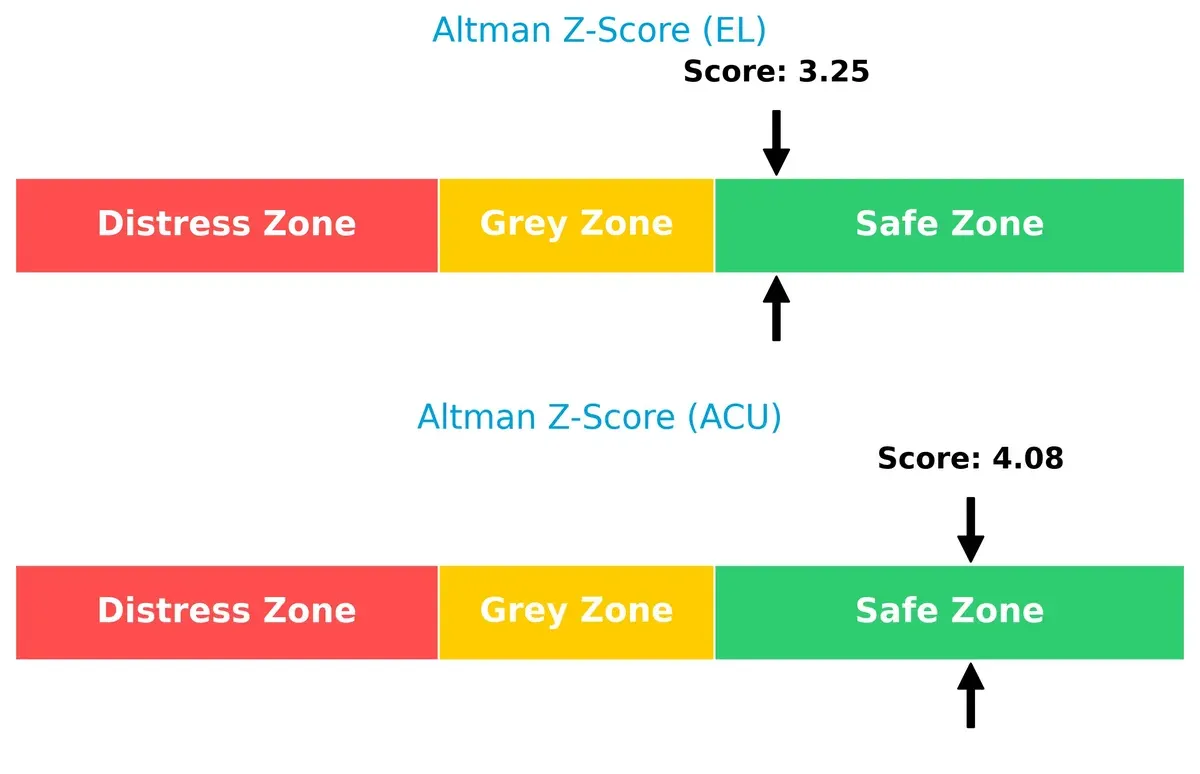
Both companies sit in the safe zone, but Acme’s 4.08 score outpaces Estée Lauder’s 3.25. This margin reflects Acme’s stronger liquidity, lower financial distress risk, and healthier balance sheet, critical for weathering sector volatility.
Financial Health: Quality of Operations
Piotroski F-Scores highlight Acme United’s stronger internal financial quality versus Estée Lauder:
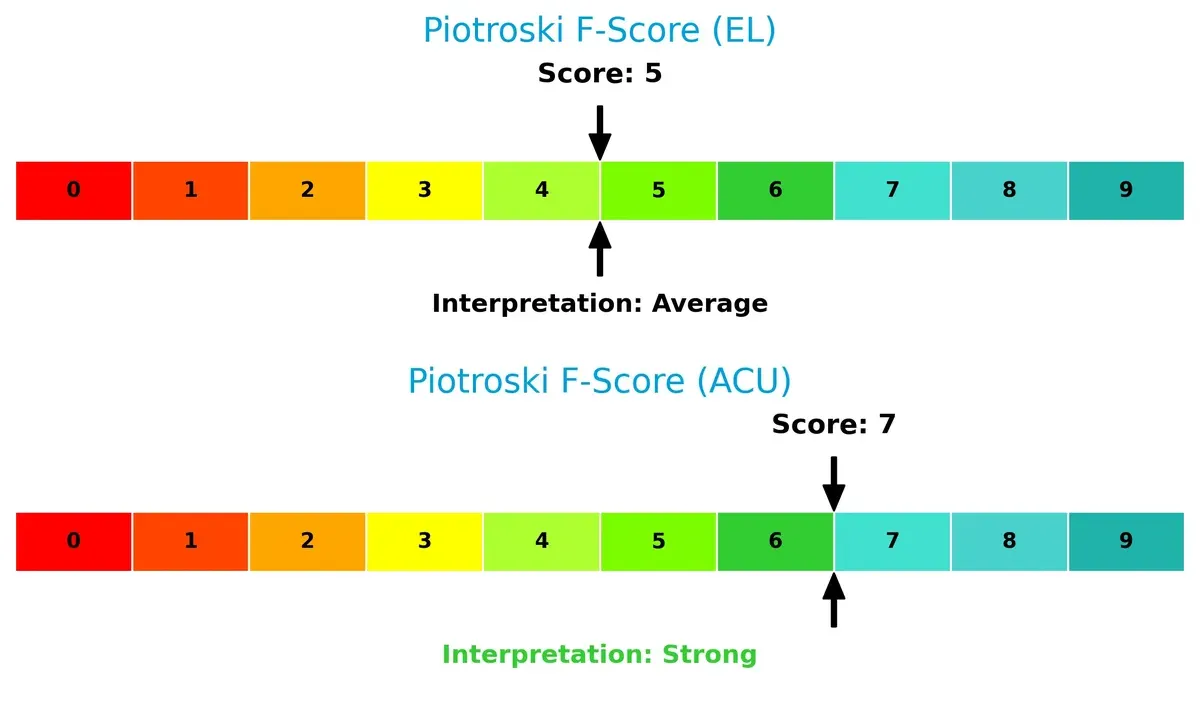
Acme scores a robust 7, indicating strong profitability, leverage, and operational efficiency. Estée Lauder’s 5 flags moderate financial health with potential red flags in internal metrics. In my experience, firms with scores below 6 often face operational headwinds that can erode shareholder value over time. Acme’s score signals better quality fundamentals and risk management.
How are the two companies positioned?
This section dissects the operational DNA of EL and ACU by comparing their revenue distribution and internal dynamics. The goal is to confront their economic moats and reveal which business model offers the most resilient competitive advantage today.
Revenue Segmentation: The Strategic Mix
This visual comparison dissects how The Estée Lauder Companies and Acme United diversify their income streams and where their primary sector bets lie:
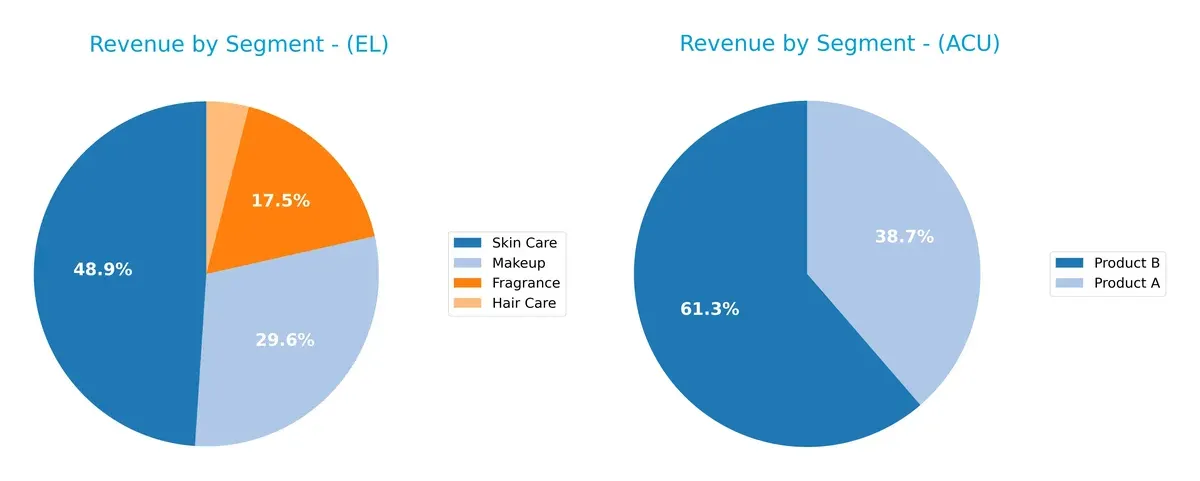
The Estée Lauder Companies anchor revenue in Skin Care with $6.96B, dwarfs other segments, while Makeup and Fragrance contribute $4.21B and $2.49B respectively. This signals a strong ecosystem lock-in in personal care. Acme United, by contrast, pivots between Product A ($75M) and Product B ($119M), showing a more balanced but narrower product focus. Estée Lauder’s concentration risks contrast with Acme’s broader segment spread.
Strengths and Weaknesses Comparison
This table compares the Strengths and Weaknesses of The Estée Lauder Companies Inc. (EL) and Acme United Corporation (ACU):
EL Strengths
- Diverse product segments including Skin Care, Makeup, Fragrance, Hair Care
- Strong global presence across United States, Asia Pacific, EMEA
- Established market share in luxury cosmetics
ACU Strengths
- Favorable financial ratios including low debt-to-equity and strong interest coverage
- Efficient asset turnover and fixed asset utilization
- Focused geographic presence with significant US revenue
EL Weaknesses
- Negative net margin and ROE indicate profitability challenges
- High debt-to-equity ratio increases financial risk
- Price-to-book ratio suggests potential overvaluation
- Interest coverage below zero signals difficulty covering interest expense
ACU Weaknesses
- High current ratio may indicate inefficient asset use
- ROE below industry benchmarks signals weaker profitability
- Limited product diversification compared to large peers
The Estée Lauder Companies show strength in diversified products and global reach but face profitability and leverage concerns. Acme United benefits from solid financial health and operational efficiency but has room to improve profitability and broaden its product base. These factors shape each company’s strategic focus going forward.
The Moat Duel: Analyzing Competitive Defensibility
A structural moat is the only true guard against profit erosion from competition over the long term:
The Estée Lauder Companies Inc.: Intangible Assets Moat
I see Estée Lauder’s primary moat in its powerful brand portfolio and product innovation. Despite a high gross margin of 74%, its declining ROIC and negative net margin signal weakening value creation. New markets in Asia-Pacific offer growth but risk intensifying competition in 2026.
Acme United Corporation: Cost Advantage Moat
Acme United’s moat lies in efficient cost management and niche product focus, supporting stable margins around 39%. Though its ROIC slightly trails WACC, it delivers value better than Estée Lauder. Expansion in industrial and safety segments could improve its competitive edge in 2026.
Brand Power vs. Cost Efficiency: The Moat Showdown
Estée Lauder’s intangible asset moat is broader but currently eroding, while Acme United’s cost advantage is narrower yet more consistent. I conclude Acme United is better positioned to defend its market share amid rising cost pressures.
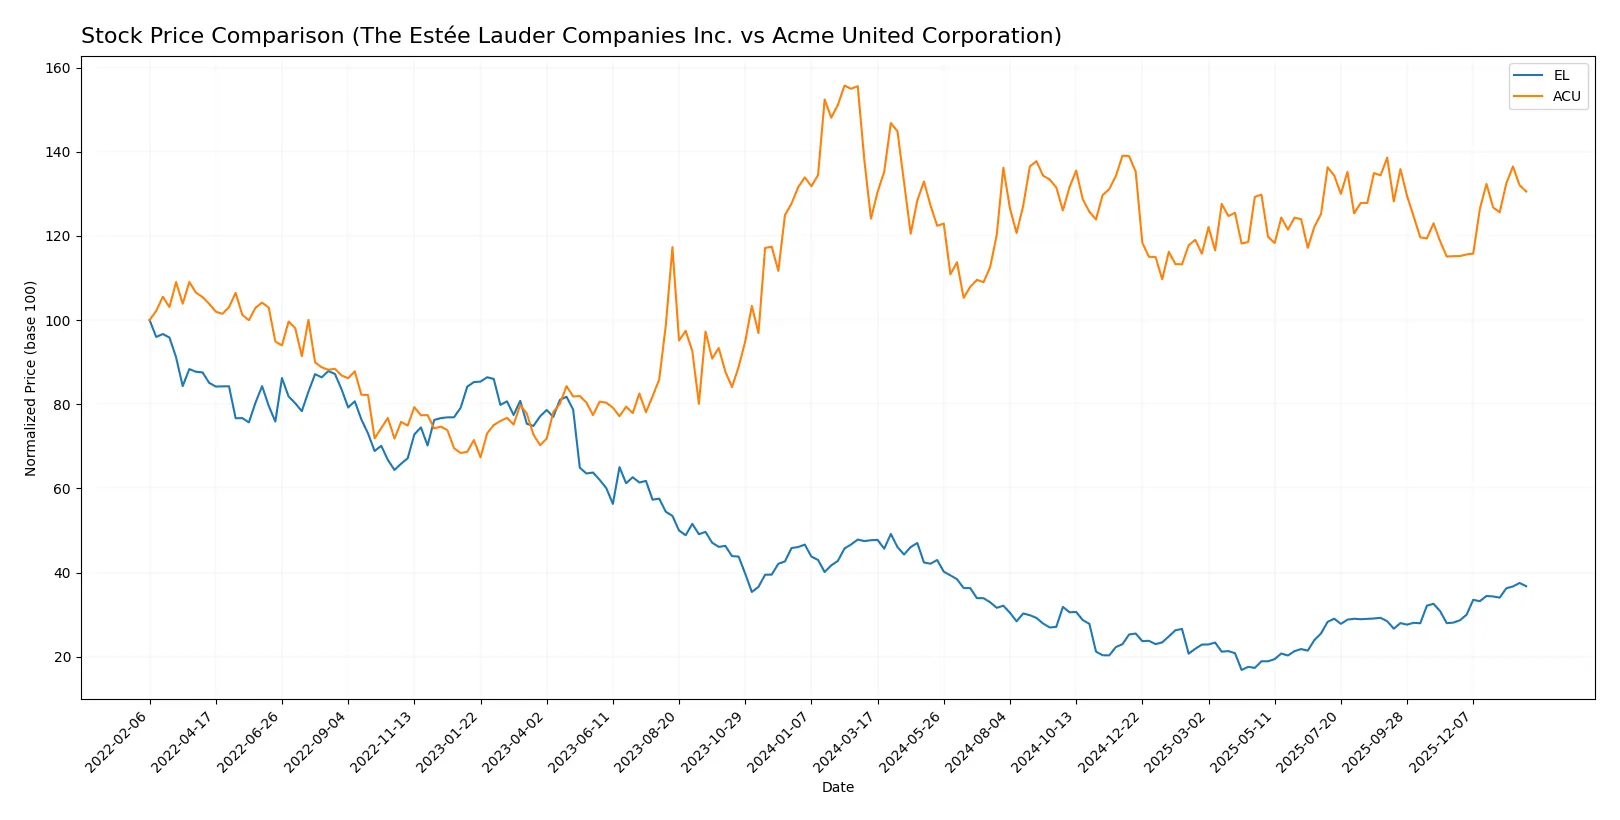
Which stock offers better returns?
The past year shows diverging trajectories: The Estée Lauder Companies Inc. faced a sharp 22.9% decline but accelerated recently, while Acme United Corporation advanced steadily with a 5.2% gain.
Trend Comparison
The Estée Lauder Companies Inc. stock declined 22.9% over 12 months, marking a bearish trend with accelerating downward momentum and a high 24.11 volatility. Recent months reversed sharply, gaining 30.7%.
Acme United Corporation rose 5.2% in the same period, confirming a bullish trend with moderate acceleration and low 2.76 volatility. Its recent 13.3% gain reflects continued steady upward momentum.
Acme United outperformed The Estée Lauder Companies Inc. over the year, delivering positive returns versus a significant overall decline despite EL’s recent rebound.
Target Prices
Analysts set a balanced target consensus for The Estée Lauder Companies Inc.
| Company | Target Low | Target High | Consensus |
|---|---|---|---|
| The Estée Lauder Companies Inc. | 70 | 140 | 113.42 |
The target consensus of 113.42 sits just below the current price of 115.28, indicating modest upside potential with a cautious analyst outlook. No verified target price data is available for Acme United Corporation.

Don’t Let Luck Decide Your Entry Point
Optimize your entry points with our advanced ProRealTime indicators. You’ll get efficient buy signals with precise price targets for maximum performance. Start outperforming now!
How do institutions grade them?
This section summarizes recent grades assigned to the two companies by recognized financial institutions:
The Estée Lauder Companies Inc. Grades
The table below lists the latest grades from major banks and investment firms for The Estée Lauder Companies Inc.:
| Grading Company | Action | New Grade | Date |
|---|---|---|---|
| Deutsche Bank | Maintain | Buy | 2026-01-29 |
| TD Cowen | Maintain | Hold | 2026-01-21 |
| JP Morgan | Maintain | Overweight | 2026-01-16 |
| Citigroup | Maintain | Neutral | 2026-01-14 |
| UBS | Maintain | Neutral | 2026-01-14 |
| Wells Fargo | Maintain | Equal Weight | 2026-01-05 |
| Raymond James | Upgrade | Strong Buy | 2026-01-05 |
| Citigroup | Maintain | Neutral | 2025-12-17 |
| Evercore ISI Group | Maintain | Outperform | 2025-12-16 |
| Rothschild & Co | Downgrade | Sell | 2025-11-25 |
Acme United Corporation Grades
The following is the only available institutional grade for Acme United Corporation:
| Grading Company | Action | New Grade | Date |
|---|---|---|---|
| DA Davidson | Maintain | Buy | 2016-07-01 |
Which company has the best grades?
The Estée Lauder Companies Inc. has a broader and more recent set of grades, ranging mostly from Hold to Strong Buy, with one Sell downgrade. Acme United Corporation’s single grade is dated 2016, limiting its relevance. Investors may find Estée Lauder’s current consensus more informative for decision-making.
Risks specific to each company
The following categories identify critical pressure points and systemic threats facing both firms in the 2026 market environment:
1. Market & Competition
The Estée Lauder Companies Inc.
- Faces intense competition in luxury beauty with volatile consumer trends.
Acme United Corporation
- Competes in niche cutting and safety tools with limited brand power but stable demand.
2. Capital Structure & Debt
The Estée Lauder Companies Inc.
- High debt-to-equity ratio (2.44) raises financial risk and interest burden concerns.
Acme United Corporation
- Low debt-to-equity (0.31) indicates strong balance sheet and manageable financial obligations.
3. Stock Volatility
The Estée Lauder Companies Inc.
- Beta of 1.15 suggests above-market volatility, increasing risk for investors.
Acme United Corporation
- Beta of 0.74 indicates lower volatility and more stable stock performance.
4. Regulatory & Legal
The Estée Lauder Companies Inc.
- Exposure to complex international cosmetic regulations and potential class action suits.
Acme United Corporation
- Faces standard safety and compliance rules in manufacturing and retail sectors.
5. Supply Chain & Operations
The Estée Lauder Companies Inc.
- Global supply chain complexity increases risk of disruption and cost inflation.
Acme United Corporation
- More localized supply chain with less exposure to global shocks.
6. ESG & Climate Transition
The Estée Lauder Companies Inc.
- Pressure to meet aggressive sustainability goals amid costly raw material shifts.
Acme United Corporation
- ESG risks moderate given product type and operational scale but still evolving policies.
7. Geopolitical Exposure
The Estée Lauder Companies Inc.
- Significant international sales expose it to currency and geopolitical risks.
Acme United Corporation
- Primarily North American focus limits geopolitical uncertainties.
Which company shows a better risk-adjusted profile?
Acme United faces lower financial leverage and stock volatility, with stable operational risks. Estée Lauder’s high debt and international exposure amplify its risk profile. Acme’s favorable Altman Z-score (4.08) and stronger Piotroski score (7) confirm superior financial health. Estée Lauder’s negative profitability and high leverage present red flags. Acme’s robust balance sheet and moderate market risk offer a better risk-adjusted investment opportunity in 2026.
Final Verdict: Which stock to choose?
The Estée Lauder Companies Inc. (EL) stands out for its brand prestige and pricing power, driving a resilient gross margin near 74%. However, its declining profitability and value destruction are points of vigilance. EL suits investors seeking aggressive growth with tolerance for cyclical earnings pressure.
Acme United Corporation (ACU) impresses with a solid balance sheet and efficient capital use, reflecting a slightly unfavorable but stable moat. Its strategic moat lies in operational efficiency and consistent free cash flow, offering better stability than EL. ACU fits well within a GARP (Growth at a Reasonable Price) portfolio seeking steady fundamentals.
If you prioritize brand strength and market dominance with a high-risk tolerance, EL is the compelling choice despite its earnings challenges. However, if you seek financial stability and efficient capital deployment with moderate growth, ACU offers better stability and a more favorable risk profile. Both cases warrant cautious monitoring given their respective headwinds.
Disclaimer: Investment carries a risk of loss of initial capital. The past performance is not a reliable indicator of future results. Be sure to understand risks before making an investment decision.
Go Further
I encourage you to read the complete analyses of The Estée Lauder Companies Inc. and Acme United Corporation to enhance your investment decisions: