Home > Comparison > Consumer Defensive > NUS vs ACU
The strategic rivalry between Nu Skin Enterprises, Inc. and Acme United Corporation shapes the competitive landscape of the Consumer Defensive sector. Nu Skin, a global beauty and wellness product developer, contrasts sharply with Acme United’s focused portfolio of first aid and cutting tools. This analysis probes their divergent operational models and growth vectors to identify which company offers a superior risk-adjusted return for a diversified portfolio in today’s evolving market environment.
Table of contents
Companies Overview
Nu Skin Enterprises and Acme United both operate in the Household & Personal Products sector with distinct market approaches and product portfolios.
Nu Skin Enterprises, Inc.: Global Beauty & Wellness Innovator
Nu Skin Enterprises dominates the beauty and wellness market by developing and distributing anti-aging skin care systems and nutritional supplements. Its revenue stems largely from direct sales and distributor networks worldwide. In 2026, Nu Skin emphasizes expanding its ageLOC brand and innovation in skin treatment devices, targeting sustained growth through product development and global retail presence.
Acme United Corporation: Diverse Safety & Cutting Tools Supplier
Acme United commands niche markets in first aid, safety, and cutting tools, supplying schools, offices, and industrial clients. It generates revenue through branded products like Westcott scissors and First Aid Only safety kits. The company’s 2026 strategy focuses on broadening distribution channels and strengthening its core brands across North America and Europe, leveraging direct sales and e-commerce platforms.
Strategic Collision: Similarities & Divergences
Both companies prioritize direct sales and brand-driven growth but diverge sharply in product focus—Nu Skin’s closed ecosystem of beauty and wellness contrasts with Acme’s broad open-market approach in safety and cutting tools. Their primary battleground is market share within consumer defensive goods, but Nu Skin targets innovation-led expansion while Acme leans on diversified product categories. These differences create distinct investment profiles shaped by innovation intensity versus steady category leadership.
Income Statement Comparison
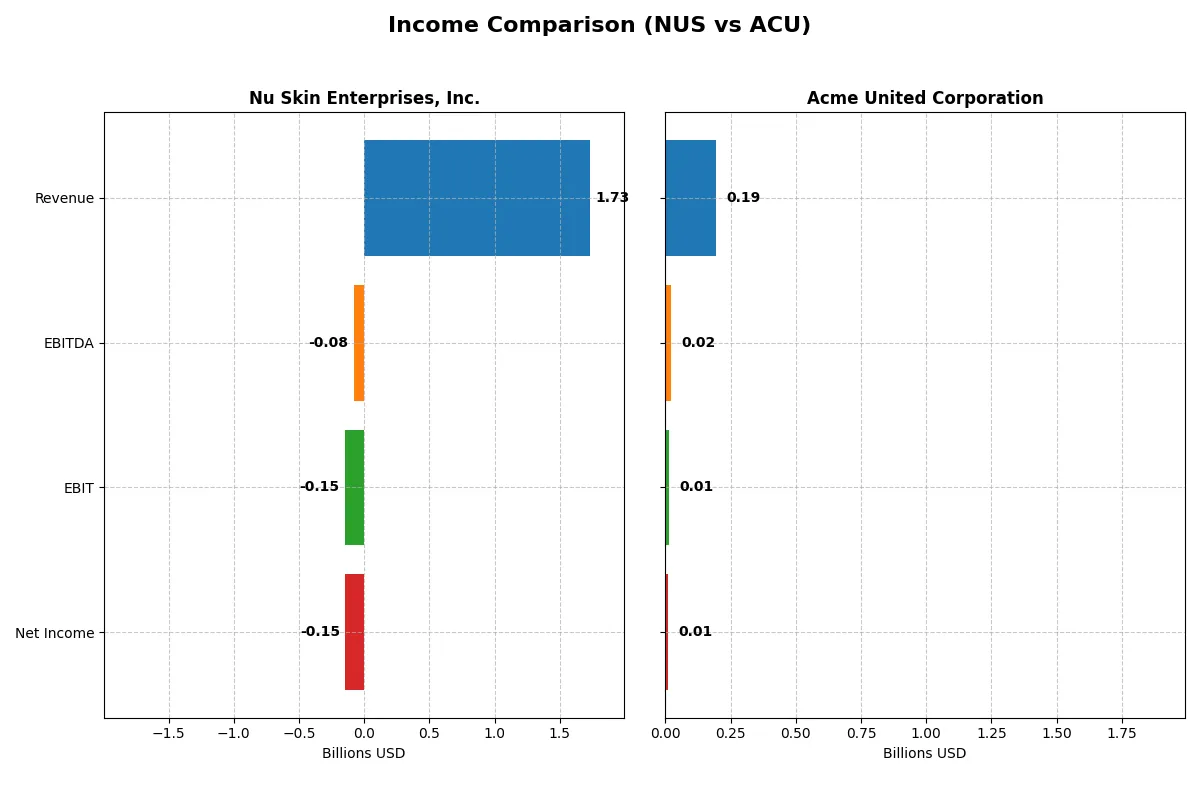
This data dissects the core profitability and scalability of both corporate engines to reveal who dominates the bottom line:
| Metric | Nu Skin Enterprises, Inc. (NUS) | Acme United Corporation (ACU) |
|---|---|---|
| Revenue | 1.73B | 194.5M |
| Cost of Revenue | 550.2M | 118.1M |
| Operating Expenses | 1.33B | 62.2M |
| Gross Profit | 1.18B | 76.4M |
| EBITDA | -78.8M | 20.4M |
| EBIT | -148.6M | 14.4M |
| Interest Expense | 26.4M | 2.1M |
| Net Income | -146.6M | 10.0M |
| EPS | -2.95 | 2.71 |
| Fiscal Year | 2024 | 2024 |
Income Statement Analysis: The Bottom-Line Duel
This income statement comparison uncovers the true operational efficiency and profitability momentum of each company’s business model.
Nu Skin Enterprises, Inc. Analysis
Nu Skin’s revenue fell sharply by 12% in 2024 to $1.73B, continuing a downward trend since 2020. Despite a solid 68% gross margin, net income collapsed to a $147M loss, reflecting margin compression and operational inefficiencies. The negative 8.5% EBIT margin in 2024 signals deteriorating profitability and mounting costs that outpaced revenue declines.
Acme United Corporation Analysis
Acme United’s revenue grew modestly by 1.6% to $194M in 2024, supported by a stable gross margin near 39%. Net income dropped 44% to $10M, with net margin compressing but remaining positive at 5.1%. While EBIT declined sharply, the company sustains profitability, showing resilience and controlled cost management in a competitive environment.
Margin Dominance vs. Consistent Profitability
Nu Skin’s larger scale contrasts with Acme United’s steadier profit profile. Nu Skin struggles with declining revenues and losses, while Acme United maintains modest growth and positive net margins. For investors, Acme’s consistent profitability and margin stability offer a more attractive risk-reward balance compared to Nu Skin’s recent earnings volatility and margin erosion.
Financial Ratios Comparison
These vital ratios act as a diagnostic tool to expose the underlying fiscal health, valuation premiums, and capital efficiency of the companies analyzed:
| Ratios | Nu Skin Enterprises, Inc. (NUS) | Acme United Corporation (ACU) |
|---|---|---|
| ROE | -22.5% | 9.4% |
| ROIC | -10.4% | 8.2% |
| P/E | -2.33 | 13.78 |
| P/B | 0.53 | 1.29 |
| Current Ratio | 1.82 | 4.17 |
| Quick Ratio | 1.17 | 1.71 |
| D/E (Debt-to-Equity) | 0.73 | 0.31 |
| Debt-to-Assets | 32.6% | 20.3% |
| Interest Coverage | -5.74 | 6.79 |
| Asset Turnover | 1.18 | 1.20 |
| Fixed Asset Turnover | 3.71 | 5.33 |
| Payout Ratio | -8.1% | 22.2% |
| Dividend Yield | 3.49% | 1.61% |
| Fiscal Year | 2024 | 2024 |
Efficiency & Valuation Duel: The Vital Signs
Financial ratios serve as a company’s DNA, exposing hidden risks and revealing operational excellence crucial for investment decisions.
Nu Skin Enterprises, Inc.
Nu Skin suffers from deeply negative profitability with ROE at -22.5% and ROIC at -10.4%, indicating operational challenges. Despite favorable valuation metrics—P/E of -2.33 and P/B of 0.53—the stock appears underpriced due to poor earnings. The company returns value via a solid 3.49% dividend yield, balancing weak earnings with shareholder income.
Acme United Corporation
Acme United shows moderate profitability with a 9.37% ROE and neutral ROIC of 8.16%, reflecting steady operational efficiency. Its valuation multiples—P/E of 13.78 and P/B of 1.29—look reasonable, neither stretched nor deeply discounted. The company favors reinvestment over dividends, paying a modest 1.61% yield while maintaining strong liquidity and debt metrics.
Valuation Discipline Meets Operational Realities
Acme United offers a better mix of operational efficiency and balanced valuation, with fewer unfavorable financial signals than Nu Skin. Investors seeking stability and growth may prefer Acme’s profile, while those prioritizing immediate income might consider Nu Skin’s higher dividend despite its profitability risks.
Which one offers the Superior Shareholder Reward?
I observe Nu Skin Enterprises, Inc. (NUS) pays a high dividend yield around 8% in 2024, but its payout ratio is unsustainably low or negative at times, reflecting operational struggles. Acme United Corporation (ACU) offers a modest 1.6% yield with a conservative payout near 22%, signaling prudent capital allocation. NUS shows inconsistent buyback signals, while ACU maintains steady free cash flow supporting moderate buybacks and dividends. NUS’s distribution is risky given negative margins and debt leverage. ACU’s balanced dividend and buyback model, underpinned by solid margins and lower leverage, offers a more sustainable and attractive total return profile for 2026 investors.
Comparative Score Analysis: The Strategic Profile
The radar chart reveals the fundamental DNA and trade-offs of both firms, showcasing their core financial strengths and valuation dynamics:
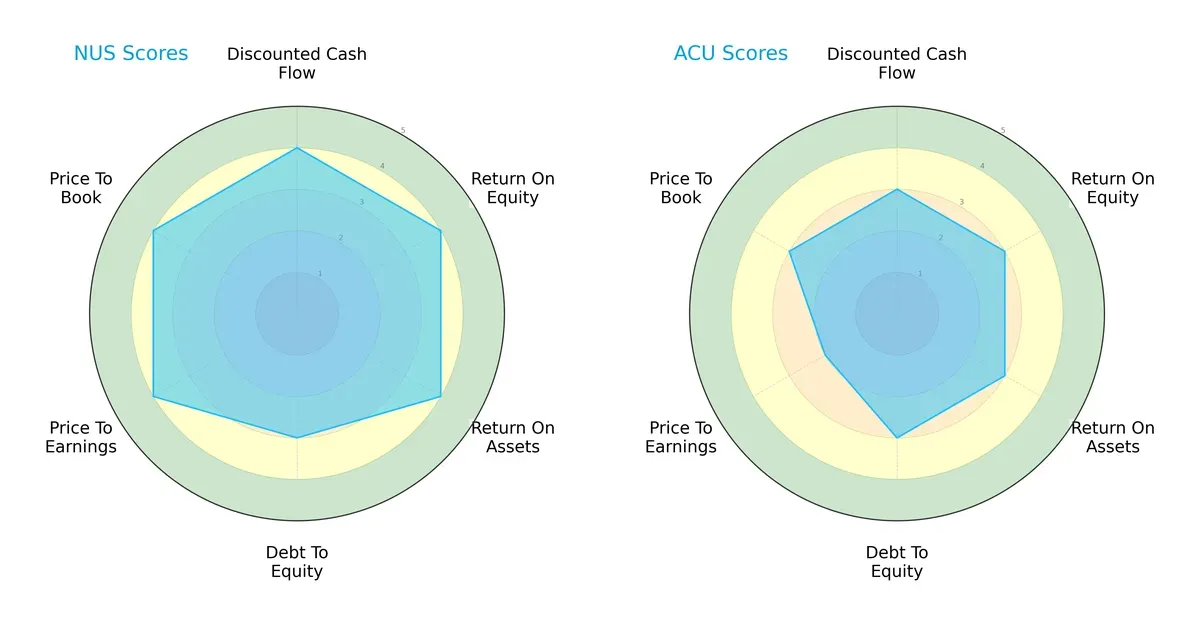
Nu Skin Enterprises, Inc. (NUS) presents a more balanced profile with strong DCF, ROE, ROA, and valuation scores, indicating efficient capital use and attractive pricing. Acme United Corporation (ACU) relies more on moderate financial metrics but lags on valuation, reflecting possible overvaluation or lower growth expectations.
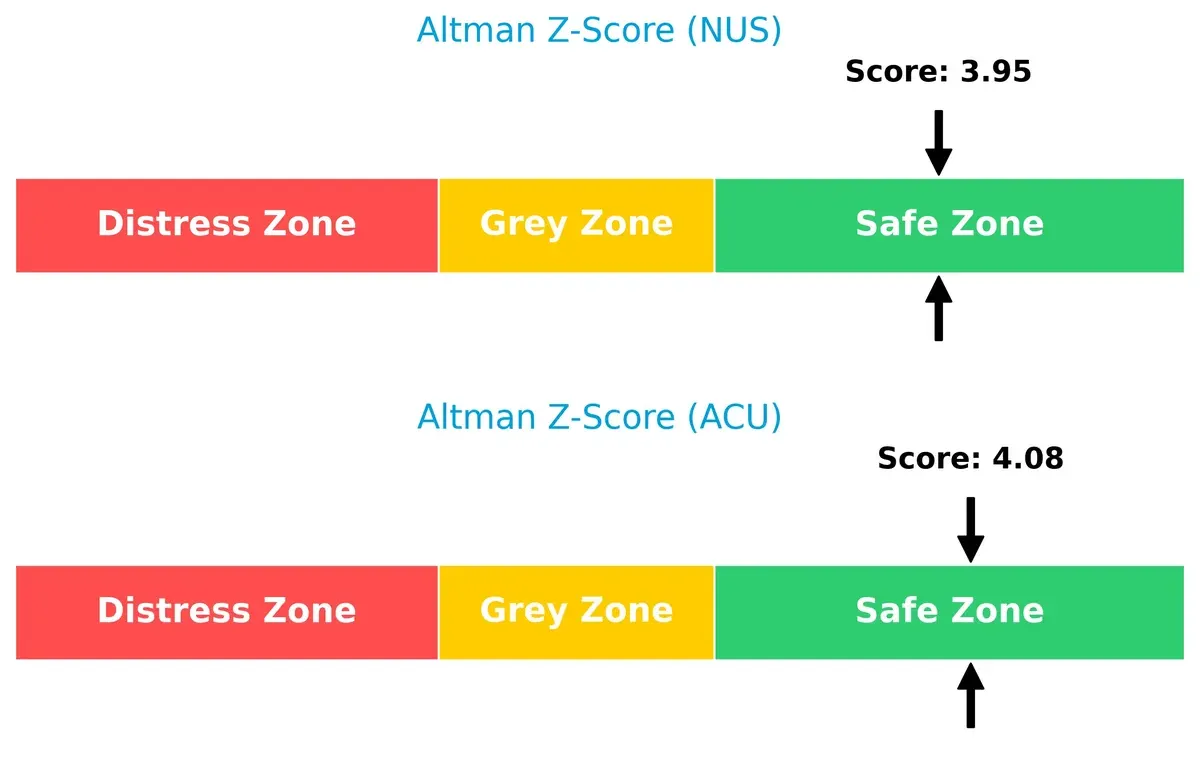
Bankruptcy Risk: Solvency Showdown
Nu Skin’s Altman Z-Score of 3.95 versus Acme United’s 4.08 places both comfortably in the safe zone, signaling robust solvency and low bankruptcy risk in this cycle:
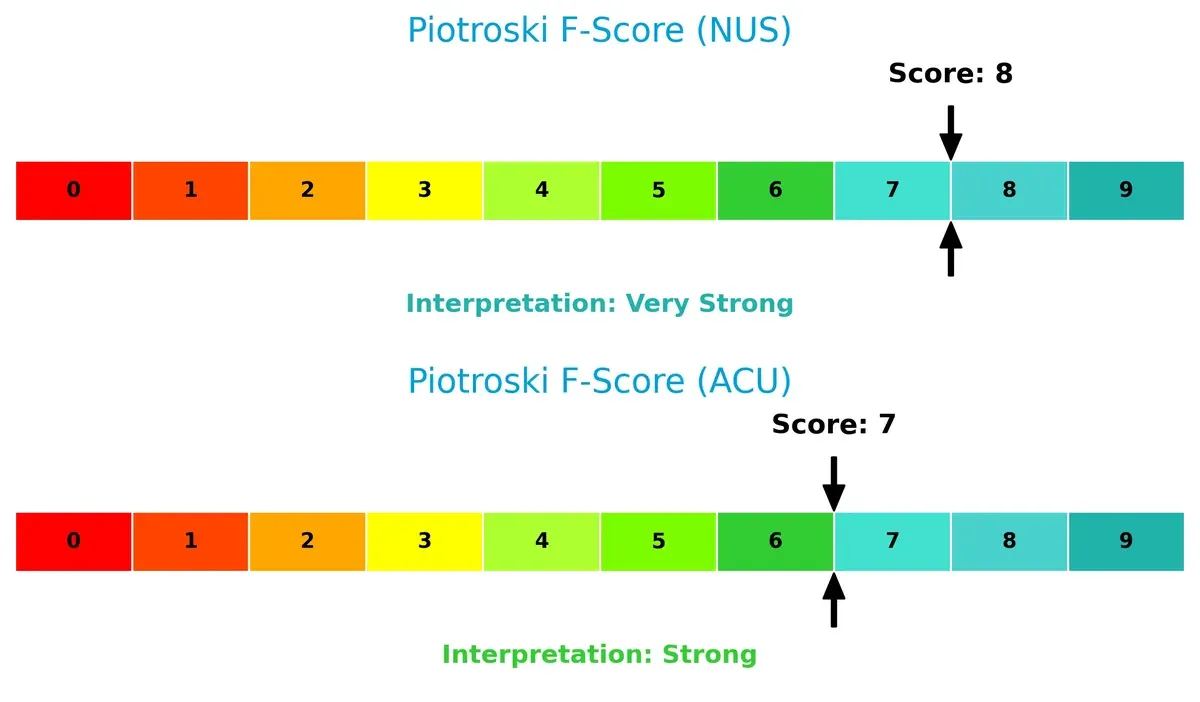
Financial Health: Quality of Operations
Nu Skin scores an 8 on the Piotroski scale, indicating very strong financial health. Acme United scores 7, showing solid but slightly weaker operational quality:
How are the two companies positioned?
This section dissects the operational DNA of Nu Skin and Acme United by comparing their revenue distribution and internal strengths and weaknesses. The goal is to confront their economic moats and identify which business model delivers the most resilient, sustainable competitive advantage today.
Revenue Segmentation: The Strategic Mix
This comparison dissects how Nu Skin Enterprises and Acme United diversify their income streams and where their primary sector bets lie:
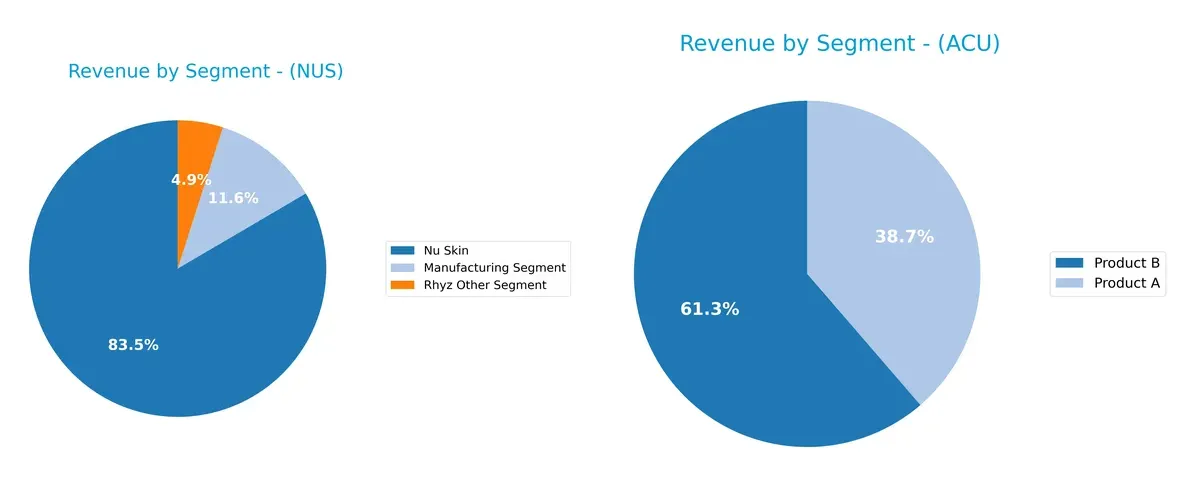
Nu Skin Enterprises anchors its revenue heavily in the “Nu Skin” segment, generating $1.45B in 2024, dwarfing its smaller Manufacturing ($201M) and Rhyz Other ($85M) segments. This concentration signals reliance on a flagship brand, risking dependency but benefiting from strong ecosystem lock-in. Acme United shows a more balanced split between Product A ($75M) and Product B ($119M), reflecting diversified income that mitigates concentration risk and allows strategic agility in shifting markets.
Strengths and Weaknesses Comparison
This table compares the Strengths and Weaknesses of Nu Skin Enterprises, Inc. and Acme United Corporation:
Nu Skin Strengths
- Diverse product lines with Nu Skin and manufacturing segments
- Global presence across Americas, Europe, Asia
- Favorable liquidity ratios, including current ratio at 1.82
- Positive asset turnover and fixed asset turnover metrics
- Dividend yield at 3.49% supports shareholder returns
Acme United Strengths
- Strong product segmentation with Product A and B
- Solid presence in North America and Europe
- Favorable debt-to-equity and debt-to-assets ratios indicating low leverage
- High interest coverage ratio at 6.9 shows good debt servicing ability
- Favorable asset turnover and fixed asset turnover ratios
Nu Skin Weaknesses
- Negative profitability with net margin at -8.46% and ROE at -22.5%
- Unfavorable return on invested capital at -10.4%
- Negative interest coverage ratio (-5.63) signals financial stress
- Moderate debt levels with neutral debt evaluation
- Declining revenue trend in core Nu Skin segment
Acme United Weaknesses
- Current ratio at 4.17 is unusually high, possibly indicating inefficient asset use
- ROE at 9.37% marked as unfavorable in context
- Dividend yield is neutral at 1.61%, less attractive for income investors
- Limited geographic diversification focused mainly in North America and Europe
Nu Skin shows a broad global footprint and strong operational efficiency but faces significant profitability and financial stress challenges. Acme United maintains healthier leverage and debt coverage but has less geographic diversification and mixed profitability signals. Both companies must address their distinct weaknesses to strengthen long-term strategic positioning.
The Moat Duel: Analyzing Competitive Defensibility
A structural moat is the only thing protecting long-term profits from the relentless erosion of competition. Let’s dissect how each firm defends its turf:
Nu Skin Enterprises, Inc.: Intangible Asset Moat
Nu Skin’s moat stems from strong brand recognition and proprietary skincare formulations. Despite a solid 68% gross margin, declining ROIC and negative net margins signal value erosion. New product launches face headwinds amid shrinking revenue, threatening the moat’s durability in 2026.
Acme United Corporation: Cost Advantage Moat
Acme United leverages efficient manufacturing and distribution to maintain a competitive cost edge. Margins hover positively with a 39% gross margin and consistent net profits. Although ROIC slightly trails WACC and dips, steady revenue growth hints at moat resilience and modest expansion opportunities ahead.
Brand Equity vs. Operational Efficiency: The Moat Showdown
Nu Skin’s intangible asset moat is deeper but currently undermined by profitability loss and revenue decline. Acme United’s cost advantage moat is narrower yet more stable, backed by ongoing value creation. I view Acme United as better positioned to defend and grow its market share in 2026.
Which stock offers better returns?
The past year saw Nu Skin Enterprises, Inc. slide 16.7%, showing accelerating decline from a high of 13.83 to a low near 5.48. Acme United Corporation gained 5.2%, accelerating upward from 33.7 to almost 47.
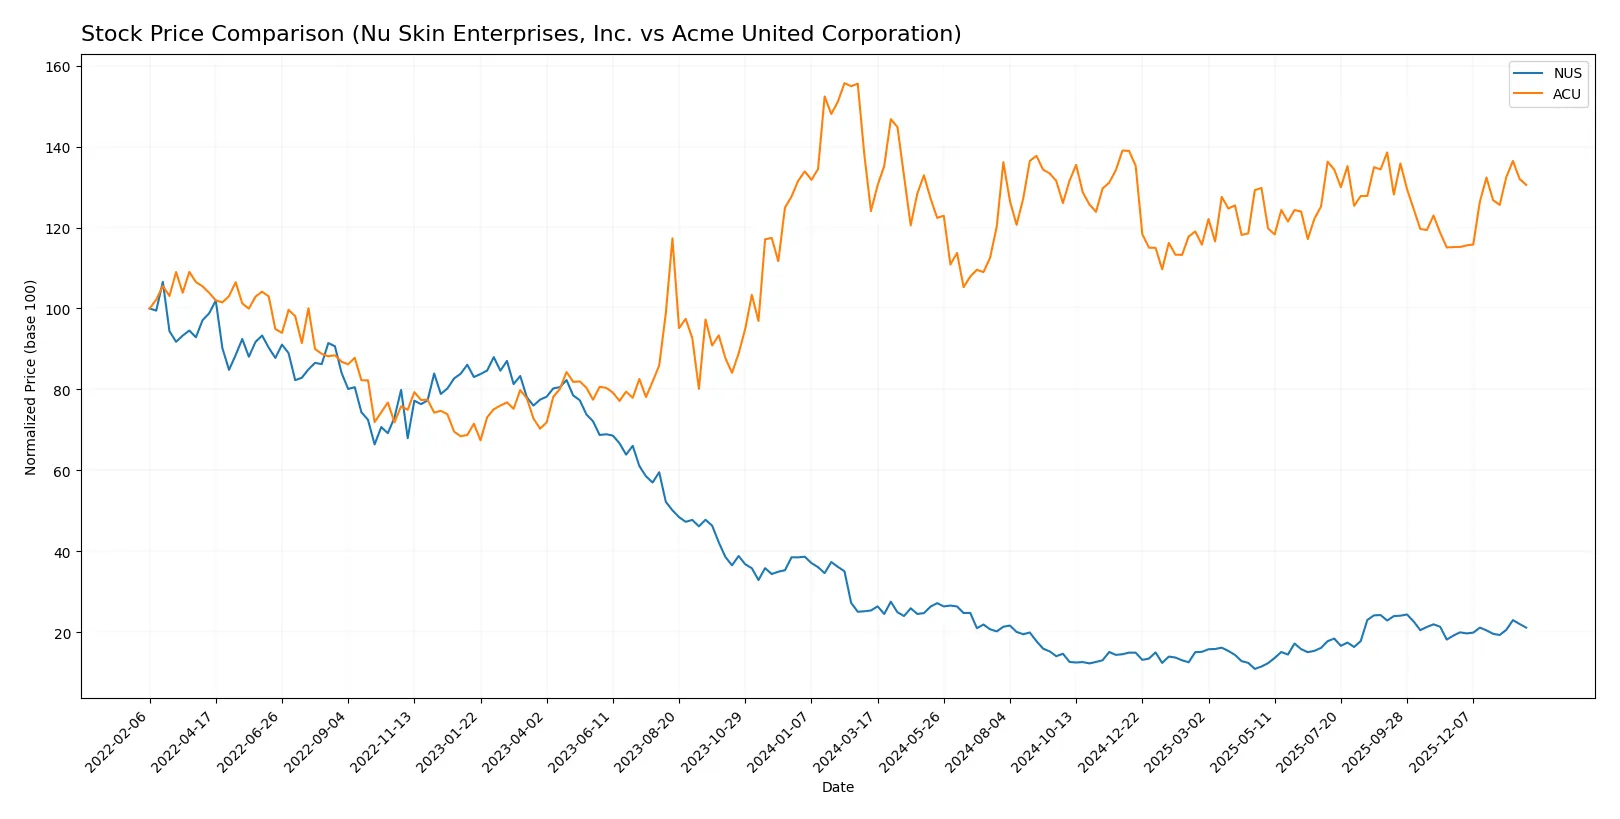
Trend Comparison
Nu Skin Enterprises, Inc. posted a bearish 16.7% drop over 12 months with accelerating downside and moderate volatility (2.31 std dev). A recent 10.3% rebound shows some recovery from November 2025 to February 2026.
Acme United Corporation recorded a bullish 5.2% rise over the year with accelerating gains and slightly higher volatility (2.76 std dev). Its recent 13.3% surge features strong buyer dominance and steeper momentum.
Acme United outperformed Nu Skin with positive price growth and stronger recent momentum, delivering the highest market return in this period.
Target Prices
Nu Skin Enterprises, Inc. shows a firm target price consensus from analysts.
| Company | Target Low | Target High | Consensus |
|---|---|---|---|
| Nu Skin Enterprises, Inc. | 11 | 11 | 11 |
Analysts expect Nu Skin to reach $11, slightly above its current price of $10.61, indicating modest upside potential. No verified target price data is available for Acme United Corporation.

Don’t Let Luck Decide Your Entry Point
Optimize your entry points with our advanced ProRealTime indicators. You’ll get efficient buy signals with precise price targets for maximum performance. Start outperforming now!
How do institutions grade them?
The following summarizes recent institutional grades for Nu Skin Enterprises, Inc. and Acme United Corporation:
Nu Skin Enterprises, Inc. Grades
This table shows Nu Skin Enterprises’ recent grade actions from reliable institutions.
| Grading Company | Action | New Grade | Date |
|---|---|---|---|
| DA Davidson | Maintain | Neutral | 2024-12-20 |
| Citigroup | Maintain | Neutral | 2024-10-22 |
| DA Davidson | Maintain | Neutral | 2024-08-12 |
| Citigroup | Maintain | Neutral | 2024-08-09 |
| DA Davidson | Maintain | Neutral | 2024-05-09 |
| DA Davidson | Maintain | Neutral | 2024-01-05 |
| Stifel | Maintain | Hold | 2023-10-16 |
| Stifel | Maintain | Hold | 2023-10-15 |
| Citigroup | Maintain | Neutral | 2023-09-29 |
| Citigroup | Maintain | Neutral | 2023-09-28 |
Acme United Corporation Grades
This table lists the only reliable institutional grade found for Acme United Corporation.
| Grading Company | Action | New Grade | Date |
|---|---|---|---|
| DA Davidson | Maintain | Buy | 2016-07-01 |
Which company has the best grades?
Acme United holds a Buy grade from DA Davidson, albeit dated from 2016. Nu Skin’s recent grades cluster around Neutral and Hold. Investors may view Acme’s Buy as more favorable, but its age limits relevance.
Risks specific to each company
The following categories identify critical pressure points and systemic threats facing both firms in the 2026 market environment:
1. Market & Competition
Nu Skin Enterprises, Inc. (NUS)
- Faces intense competition in beauty and wellness markets with evolving consumer preferences.
Acme United Corporation (ACU)
- Operates in diverse segments with steady demand but faces pressure from low-cost competitors.
2. Capital Structure & Debt
Nu Skin Enterprises, Inc. (NUS)
- Moderate debt-to-equity ratio (0.73) with negative interest coverage, signaling distress in covering debt costs.
Acme United Corporation (ACU)
- Lower debt-to-equity (0.31) and positive interest coverage indicate stronger financial flexibility and lower leverage risk.
3. Stock Volatility
Nu Skin Enterprises, Inc. (NUS)
- Beta near 1 (0.977) suggests volatility in line with the market, exposing investors to average market risk.
Acme United Corporation (ACU)
- Lower beta (0.74) indicates less sensitivity to market swings and potentially less stock volatility.
4. Regulatory & Legal
Nu Skin Enterprises, Inc. (NUS)
- Operates globally with complex regulatory environments, especially in China, increasing compliance risk.
Acme United Corporation (ACU)
- Mainly US and international markets with standard regulatory challenges but less complexity than NUS.
5. Supply Chain & Operations
Nu Skin Enterprises, Inc. (NUS)
- Global supply chain subject to disruption risks, especially for specialized skincare devices.
Acme United Corporation (ACU)
- Diverse product lines reduce single-point risk but depend on manufacturing efficiency and logistics.
6. ESG & Climate Transition
Nu Skin Enterprises, Inc. (NUS)
- Beauty sector faces increasing scrutiny on sustainability and ingredient sourcing, requiring costly adaptations.
Acme United Corporation (ACU)
- Product safety and environmental impact under watch; moderate ESG risks due to product types and materials.
7. Geopolitical Exposure
Nu Skin Enterprises, Inc. (NUS)
- Significant exposure to China’s market and regulatory shifts poses geopolitical and economic risks.
Acme United Corporation (ACU)
- Primarily North American focus with less direct exposure to volatile geopolitical regions.
Which company shows a better risk-adjusted profile?
Nu Skin’s biggest risk is its strained debt servicing capacity amid negative profitability, raising bankruptcy concerns. Acme United’s main risk lies in competitive pressures and a stretched current ratio, which may affect liquidity. Overall, Acme United shows a better risk-adjusted profile with stronger balance sheet metrics and lower leverage. Notably, Nu Skin’s negative interest coverage ratio (-5.63) signals urgent financial stress, justifying cautious positioning despite its favorable Altman Z-Score.
Final Verdict: Which stock to choose?
Nu Skin Enterprises, Inc. (NUS) boasts a superpower in its asset efficiency and a strong dividend yield, attracting income-focused investors. However, its sharply declining profitability and negative returns on capital signal a point of vigilance. It fits better within aggressive growth portfolios willing to weather volatility for potential turnaround gains.
Acme United Corporation (ACU) exhibits a strategic moat through solid operational cash flow and a safer balance sheet, reflecting moderate but consistent profitability. Relative to NUS, ACU offers better financial stability, making it more suitable for GARP (Growth at a Reasonable Price) investors seeking steady, lower-risk exposure.
If you prioritize aggressive growth and can tolerate operational headwinds, NUS is the compelling choice due to its efficient asset base and dividend appeal despite short-term losses. However, if you seek greater stability with moderate growth, ACU offers better downside protection and a more consistent cash flow profile, though it commands a modest valuation premium.
Disclaimer: Investment carries a risk of loss of initial capital. The past performance is not a reliable indicator of future results. Be sure to understand risks before making an investment decision.
Go Further
I encourage you to read the complete analyses of Nu Skin Enterprises, Inc. and Acme United Corporation to enhance your investment decisions: