Home > Comparison > Consumer Defensive > NWL vs ACU
The strategic rivalry between Newell Brands Inc. and Acme United Corporation shapes the landscape of the Household & Personal Products sector. Newell operates as a diversified consumer defensive powerhouse with a broad portfolio spanning home appliances and outdoor gear. Acme United, a niche-focused manufacturer, targets specialized cutting and first aid products. This analysis will dissect their distinct operational paradigms to identify which offers superior risk-adjusted returns for a diversified portfolio in 2026.
Table of contents
Companies Overview
Newell Brands and Acme United stand as key players in the household and personal products sector, each carving distinct niches.
Newell Brands Inc.: Diversified Consumer Products Leader
Newell Brands dominates the consumer and commercial products market with a broad portfolio including home appliances, outdoor gear, and office supplies. Its revenue stems from five segments, such as Commercial Solutions and Learning and Development. In 2026, the company’s strategic focus remains on expanding its brand portfolio and enhancing distribution channels to deepen market penetration.
Acme United Corporation: Specialty Cutting and Safety Products Provider
Acme United specializes in first aid, cutting, and safety tools across school, office, and industrial markets. It generates income through its Westcott, Clauss, and Camillus brands. The company prioritizes innovation in safety and utility products while expanding its reach in wholesale and retail channels in 2026.
Strategic Collision: Similarities & Divergences
Newell Brands adopts a diversified, multi-segment approach with a broad product range, contrasting Acme United’s focused niche in cutting and safety tools. Both compete for market share in household essentials but differ in scale and product breadth. Their distinct profiles reflect Newell’s large-scale brand portfolio versus Acme’s specialized product innovation and targeted distribution.
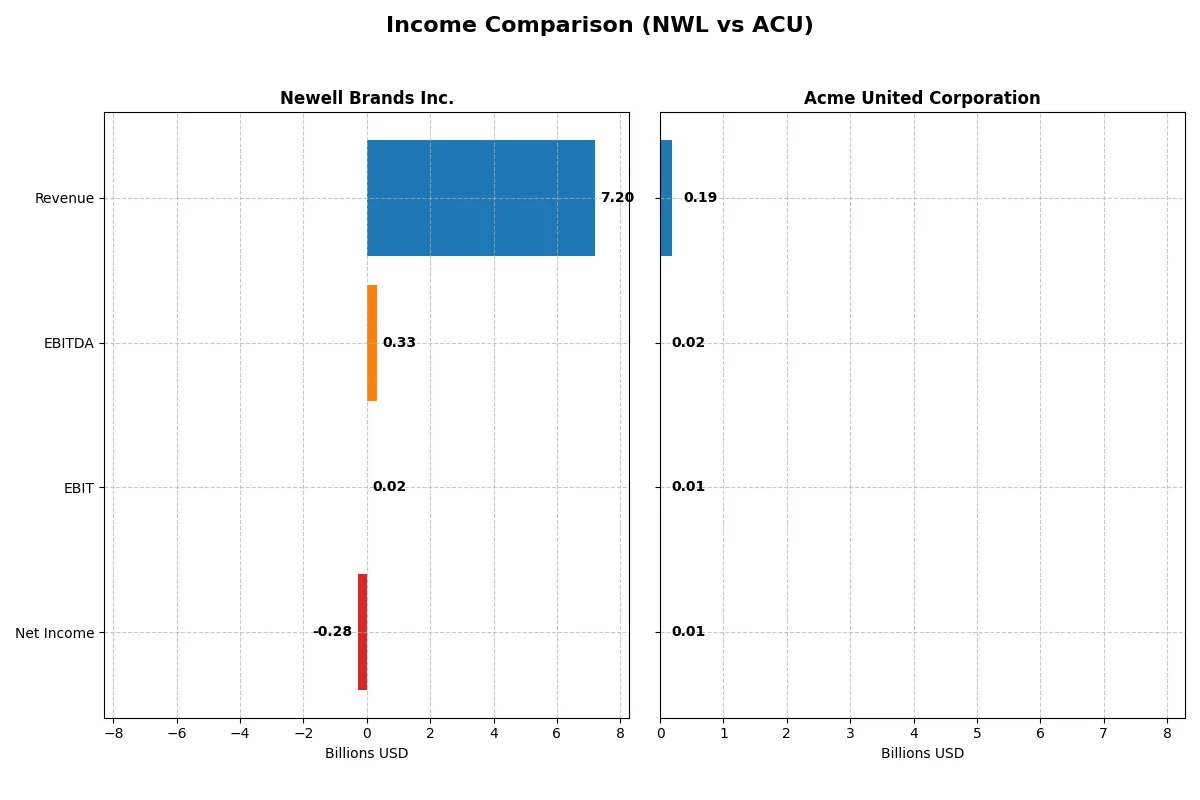
Income Statement Comparison
This table dissects the core profitability and scalability of both corporate engines to reveal who dominates the bottom line:
| Metric | Newell Brands Inc. (NWL) | Acme United Corporation (ACU) |
|---|---|---|
| Revenue | 7.2B | 194.5M |
| Cost of Revenue | 4.8B | 118.1M |
| Operating Expenses | 1.99B | 62.2M |
| Gross Profit | 2.4B | 76.4M |
| EBITDA | 331M | 20.4M |
| EBIT | 20M | 14.4M |
| Interest Expense | 321M | 2.1M |
| Net Income | -285M | 10.0M |
| EPS | -0.68 | 2.71 |
| Fiscal Year | 2025 | 2024 |
Income Statement Analysis: The Bottom-Line Duel
This income statement comparison reveals the true operational efficiency and profit dynamics driving each corporate engine’s performance.
Newell Brands Inc. Analysis
Newell Brands’ revenue declined from 10.6B in 2021 to 7.2B in 2025, with net income turning negative since 2023. Gross margin remains stable near 34%, but net margin slipped to -3.96% in 2025. The latest year shows weakening EBIT and net income, signaling deteriorating profitability and operational challenges.
Acme United Corporation Analysis
Acme United’s revenue grew modestly from 164M in 2020 to 194M in 2024, while net income rose from 8.1M to 10M. Gross margin improved to 39.3%, with a healthy 5.15% net margin in 2024. Despite a recent dip in EBIT and EPS, overall growth trends reflect solid margin control and improving bottom-line efficiency.
Margin Strength vs. Scale Decline
Acme United leads with superior margins and consistent net income growth, while Newell Brands suffers from shrinking scale and negative profitability. Acme’s profile suits investors prioritizing margin resilience and steady earnings growth. Newell’s profile carries higher risk, reflecting operational strain amid declining revenues.
Financial Ratios Comparison
These vital ratios act as a diagnostic tool to expose the underlying fiscal health, valuation premiums, and capital efficiency for clear comparative insight:
| Ratios | Newell Brands Inc. (NWL) | Acme United Corporation (ACU) |
|---|---|---|
| ROE | -11.92% | 9.37% |
| ROIC | 5.09% | 8.16% |
| P/E | -5.46 | 13.78 |
| P/B | 0.65 | 1.29 |
| Current Ratio | 1.07 | 4.17 |
| Quick Ratio | 0.57 | 1.71 |
| D/E | 2.32 | 0.31 |
| Debt-to-Assets | 51.69% | 20.25% |
| Interest Coverage | 1.39 | 6.79 |
| Asset Turnover | 0.67 | 1.20 |
| Fixed Asset Turnover | 4.33 | 5.33 |
| Payout ratio | -42.11% | 22.17% |
| Dividend yield | 7.71% | 1.61% |
| Fiscal Year | 2025 | 2024 |
Efficiency & Valuation Duel: The Vital Signs
Financial ratios serve as a company’s DNA, exposing hidden risks and operational strengths often missed by headline figures.
Newell Brands Inc.
Newell shows weak profitability with a negative ROE of -11.9% and an unfavorable net margin near -4%. Its valuation appears attractive with a modest P/E and P/B under 1, suggesting the stock is undervalued. Shareholders receive a solid dividend yield of 7.7%, balancing the lack of growth reinvestment with income returns.
Acme United Corporation
Acme United delivers moderate profitability, with a positive but low ROE of 9.4% and a neutral net margin of 5.15%. The stock trades at a reasonable P/E of 13.8 and a P/B of 1.29, reflecting fair valuation. It favors reinvestment over dividends, paying a modest 1.6% yield while maintaining strong operational efficiency and financial health.
Valuation Attractiveness vs. Profitability Stability
Acme United offers a more favorable ratio profile, combining solid profitability with healthier leverage and liquidity. Newell’s higher dividend yield compensates for operational weakness but carries elevated financial risks. Conservative investors may prefer Acme’s balanced approach, while income-focused investors might lean toward Newell’s yield.
Which one offers the Superior Shareholder Reward?
I observe Newell Brands (NWL) offers a high dividend yield of 7.7% but with negative free cash flow coverage at 6.4%, signaling risk. Acme United (ACU) yields 1.6% with strong payout ratio of 22% and solid free cash flow. NWL’s buybacks are inconsistent amid heavy leverage; ACU maintains steady buybacks fueled by robust operating cash flow. I find ACU’s sustainable distribution model and healthier capital allocation more attractive for long-term total return in 2026.
Comparative Score Analysis: The Strategic Profile
The radar chart reveals the fundamental DNA and trade-offs of Newell Brands Inc. and Acme United Corporation, highlighting their core financial strengths and vulnerabilities:
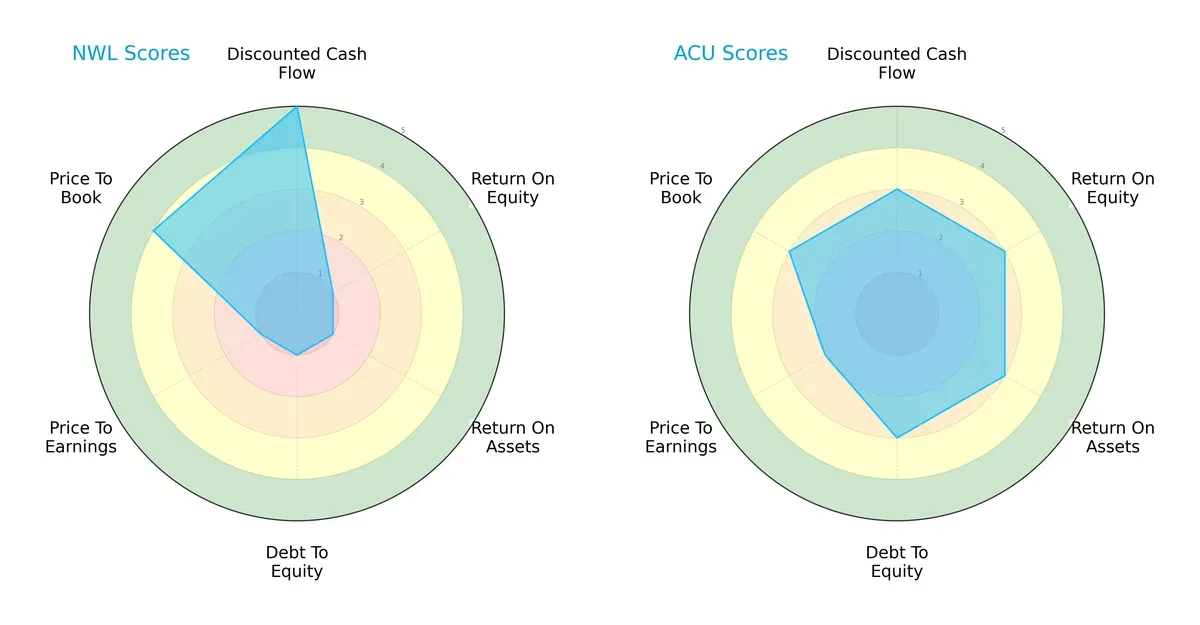
Newell Brands excels in discounted cash flow with a score of 5 but struggles significantly in profitability and leverage, scoring 1 in ROE, ROA, and Debt/Equity. Acme United shows a more balanced profile, moderate across all metrics with scores mostly at 3, though its valuation metrics are slightly weaker. Acme’s consistent moderate scores suggest steady operational efficiency, while Newell relies heavily on cash flow advantages but faces structural financial risks.
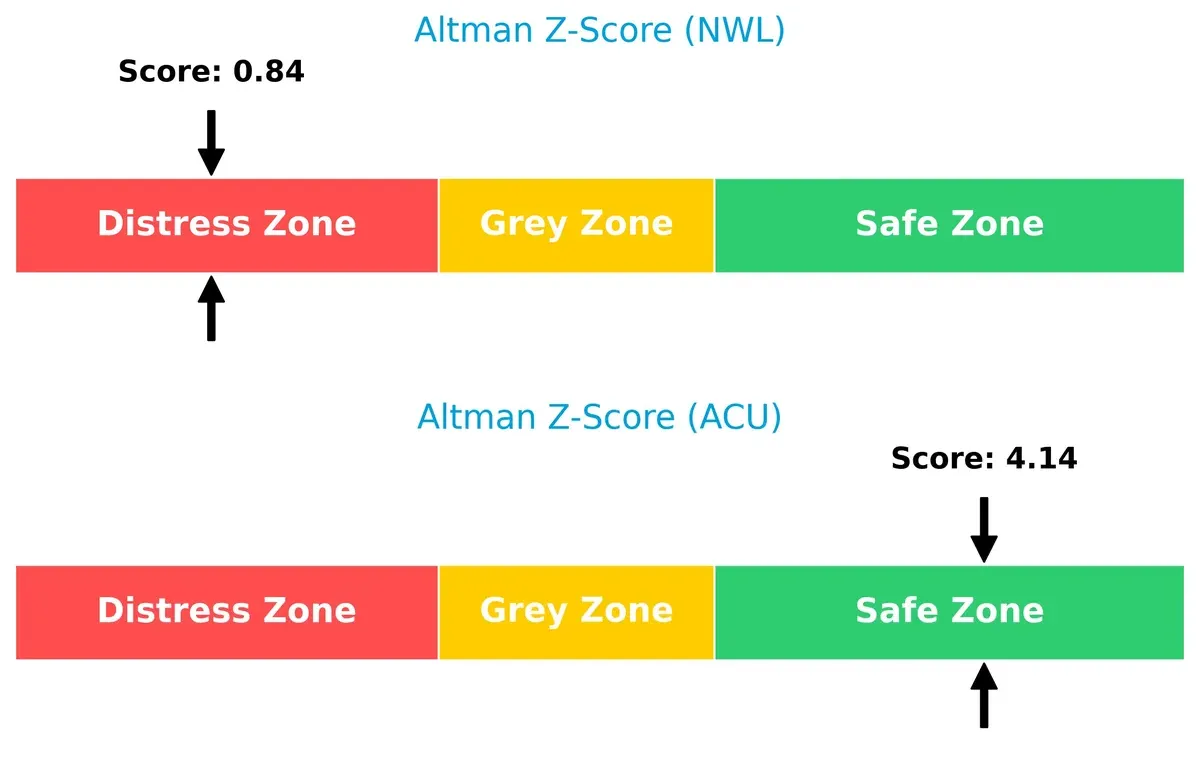
Bankruptcy Risk: Solvency Showdown
Acme United’s Altman Z-Score of 4.14 places it securely in the safe zone, indicating strong financial stability. Newell Brands’ 0.84 score signals distress and elevated bankruptcy risk in this cycle:
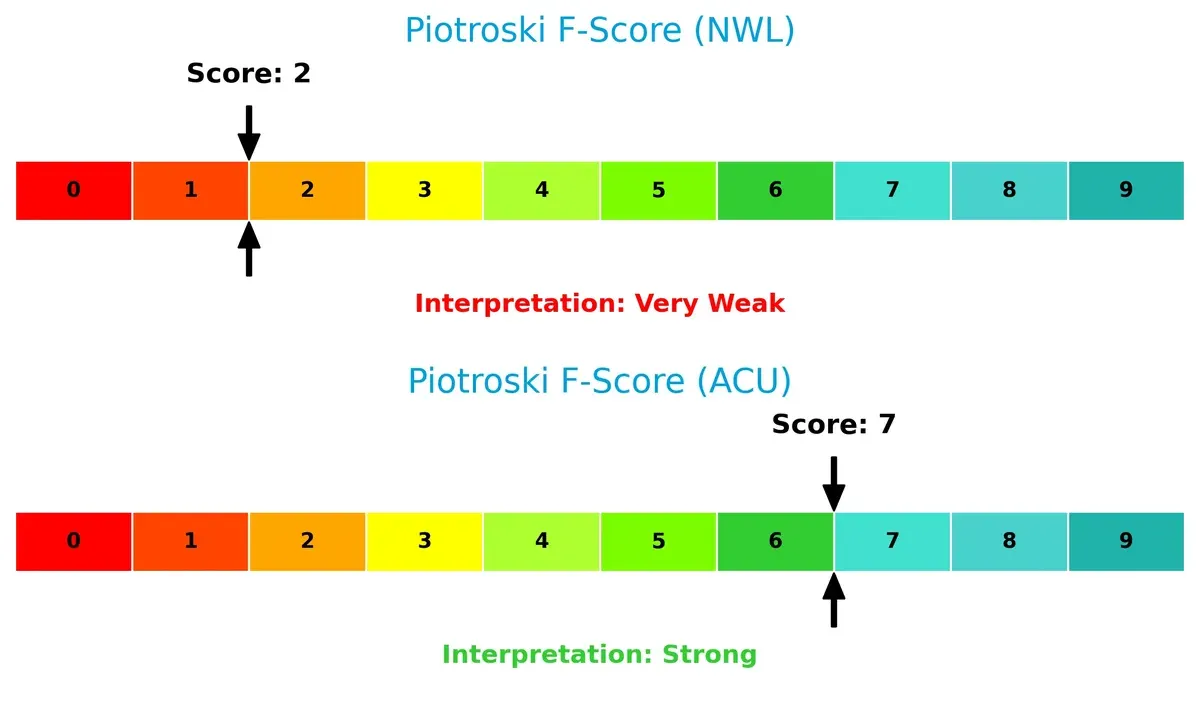
Financial Health: Quality of Operations
Acme United’s Piotroski F-Score of 7 reflects strong operational quality and financial health. Newell Brands’ score of 2 raises red flags about internal weaknesses and potential distress:
How are the two companies positioned?
This section dissects the operational DNA of NWL and ACU by comparing their revenue distribution and internal dynamics. The goal is to confront their economic moats and identify which model offers the most resilient, sustainable advantage today.
Revenue Segmentation: The Strategic Mix
This visual comparison dissects how Newell Brands Inc. and Acme United Corporation diversify income streams and reveals their primary sector bets:
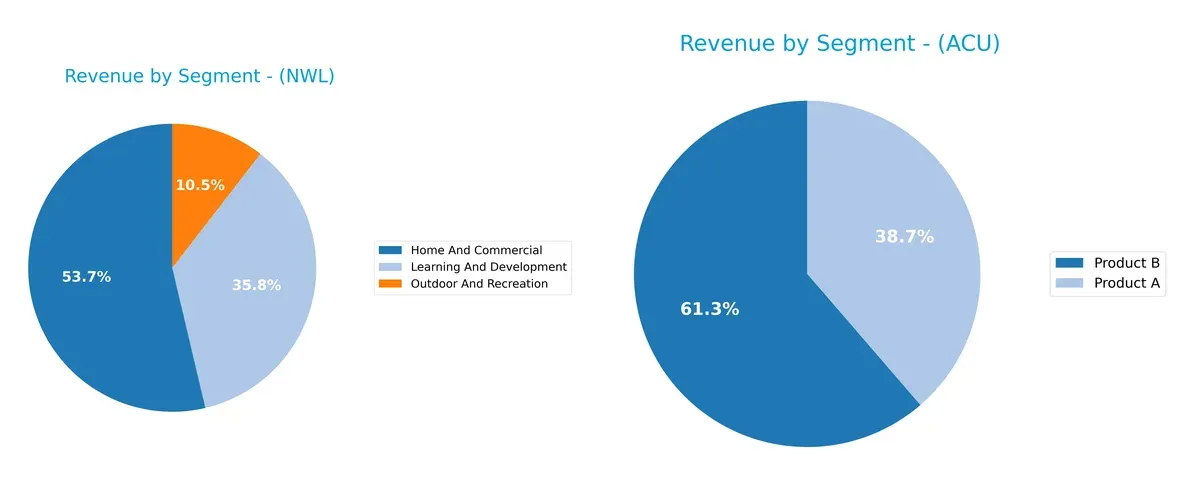
Newell Brands leans on a diversified portfolio with major segments like Home and Commercial at $4.07B and Learning and Development at $2.72B in 2024. Acme United pivots on just two product lines, with Product B anchoring at $119M versus Product A’s $75M. Newell’s broad spread reduces concentration risk, while Acme’s reliance on fewer segments heightens vulnerability but may indicate focused operational efficiency.
Strengths and Weaknesses Comparison
This table compares the Strengths and Weaknesses of Newell Brands Inc. and Acme United Corporation:
Newell Brands Inc. Strengths
- Diversified product portfolio across multiple segments
- Large North American and foreign market presence
- Favorable WACC and fixed asset turnover
Acme United Corporation Strengths
- Favorable financial ratios including PE, PB, and debt metrics
- Strong liquidity indicated by quick ratio
- High asset turnover and interest coverage
Newell Brands Inc. Weaknesses
- Negative net margin and ROE indicate profitability issues
- High debt to equity and low interest coverage suggest financial risk
- Quick ratio below 1 signals liquidity concerns
Acme United Corporation Weaknesses
- Current ratio unusually high, potentially inefficient capital use
- ROE marked unfavorable despite overall favorable ratios
Newell Brands shows broad diversification and geographical reach but struggles with profitability and financial leverage. Acme United presents stronger financial health and operational efficiency, though capital management warrants attention. These contrasts highlight differing strategic priorities and risk profiles.
The Moat Duel: Analyzing Competitive Defensibility
A structural moat is the sole shield protecting long-term profits from relentless competitive erosion. Here’s how Newell Brands and Acme United stack up:
Newell Brands Inc.: Intangible Assets and Brand Portfolio Moat
Newell’s strength lies in its diverse brand portfolio, providing margin stability despite shrinking revenues. However, declining ROIC signals the moat weakens in 2026 without innovation.
Acme United Corporation: Cost Advantage and Niche Market Focus
Acme’s moat hinges on cost efficiency and targeted product niches, maintaining favorable margins and modest growth. Yet, a slight ROIC decline tempers optimism for expanding its moat in 2026.
Intangible Assets vs. Cost Efficiency: Who Holds the Deeper Moat?
Newell’s broad brand moat faces serious decay with value destruction and falling ROIC. Acme’s cost advantage is narrower but more stable, making it better positioned to defend market share in the near term.
Which stock offers better returns?
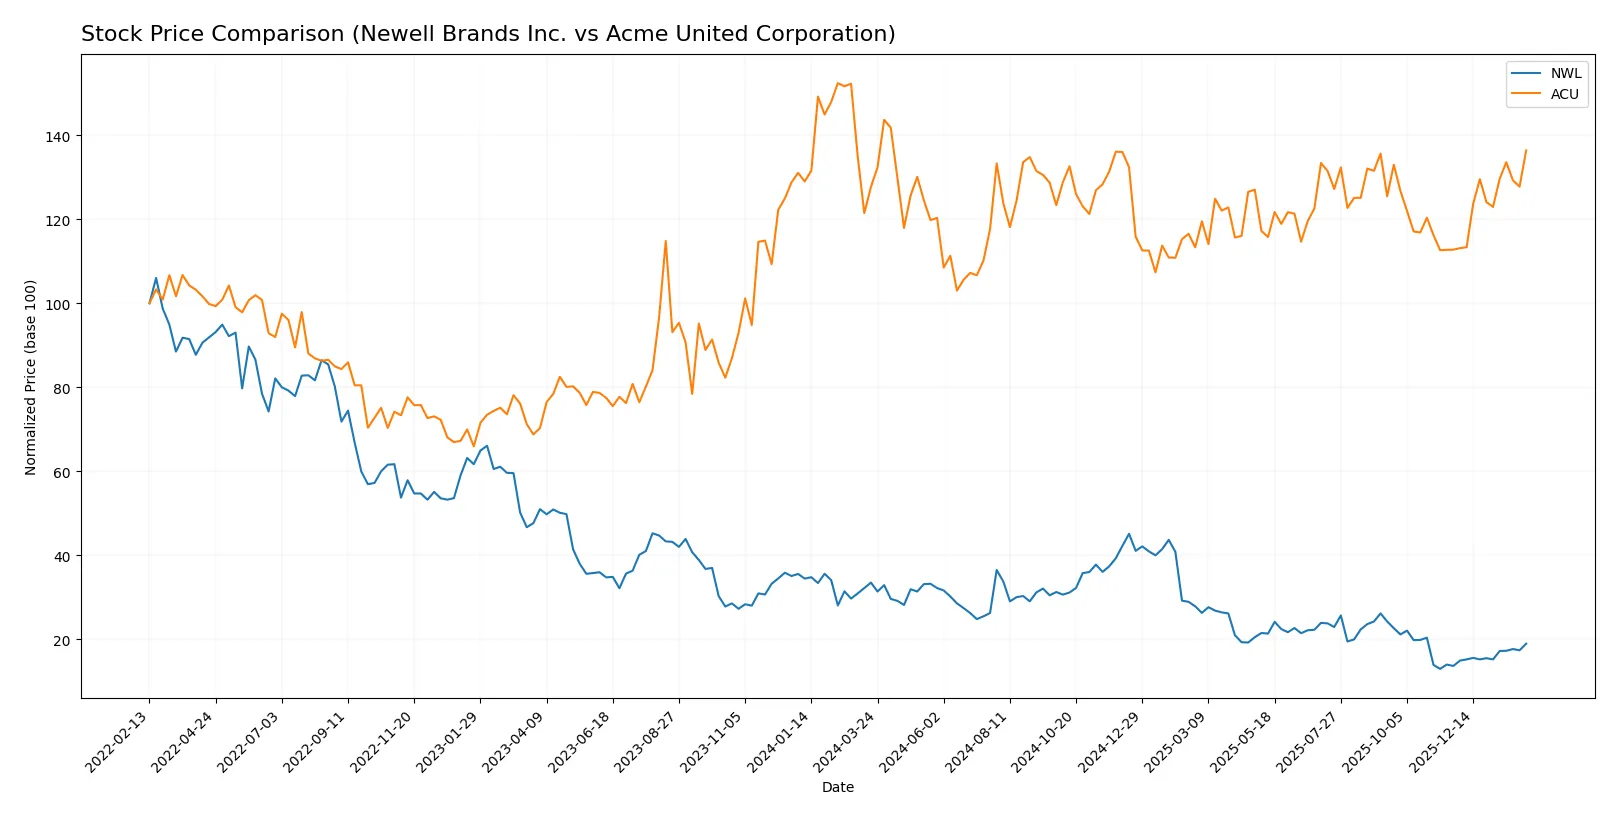
Over the past year, Newell Brands Inc. experienced a sharp decline before a recent rebound, while Acme United Corporation showed steady gains with accelerating momentum.
Trend Comparison
Newell Brands Inc. fell 43.4% over the past 12 months, marking a bearish trend with accelerating downward momentum. The recent 2.5-month rally gained 38.62%, showing tentative recovery but still below previous highs.
Acme United Corporation rose 6.82% over the same period, maintaining a bullish trend with accelerating gains. Its recent 2.5-month advance of 20.96% features strong buyer dominance and rising price slope.
Comparing both, Acme United delivered the highest market performance overall, with consistent bullish momentum versus Newell’s prolonged bearish trend and partial recent recovery.
Target Prices
Newell Brands Inc. shows a moderate target price consensus from analysts, suggesting cautious optimism.
| Company | Target Low | Target High | Consensus |
|---|---|---|---|
| Newell Brands Inc. | 4.25 | 8.00 | 5.58 |
Analysts expect Newell’s shares to rise modestly from the current 4.63 price, with upside potential reaching 8.00. Acme United Corporation lacks verified target price data.

Don’t Let Luck Decide Your Entry Point
Optimize your entry points with our advanced ProRealTime indicators. You’ll get efficient buy signals with precise price targets for maximum performance. Start outperforming now!
How do institutions grade them?
The following tables summarize the most recent grades assigned to Newell Brands Inc. and Acme United Corporation by reputable grading companies:
Newell Brands Inc. Grades
This table shows recent grade updates for Newell Brands Inc. from major financial institutions.
| Grading Company | Action | New Grade | Date |
|---|---|---|---|
| Canaccord Genuity | Maintain | Buy | 2026-01-26 |
| UBS | Maintain | Neutral | 2026-01-14 |
| Citigroup | Maintain | Neutral | 2026-01-14 |
| Citigroup | Maintain | Neutral | 2025-12-17 |
| UBS | Maintain | Neutral | 2025-12-02 |
| Canaccord Genuity | Maintain | Buy | 2025-11-03 |
| Citigroup | Maintain | Neutral | 2025-11-03 |
| JP Morgan | Maintain | Overweight | 2025-11-03 |
| RBC Capital | Maintain | Sector Perform | 2025-11-03 |
| JP Morgan | Maintain | Overweight | 2025-10-23 |
Acme United Corporation Grades
This table lists the only recent grade available for Acme United Corporation.
| Grading Company | Action | New Grade | Date |
|---|---|---|---|
| DA Davidson | Maintain | Buy | 2016-07-01 |
Which company has the best grades?
Newell Brands Inc. holds multiple recent grades, mostly “Buy,” “Neutral,” and “Overweight,” reflecting balanced institutional views. Acme United Corporation has a single, older “Buy” grade from 2016. Investors may find Newell Brands’ current and diversified grades more informative for decision-making.
Risks specific to each company
The following categories identify the critical pressure points and systemic threats facing both firms in the 2026 market environment:
1. Market & Competition
Newell Brands Inc.
- Faces fierce competition in diversified consumer products with pressure on margins due to innovation cycles and brand relevance.
Acme United Corporation
- Operates in niche cutting and safety products markets with less direct competition but slower growth potential.
2. Capital Structure & Debt
Newell Brands Inc.
- High debt-to-equity (2.32) and 52% debt-to-assets signal elevated financial risk and weak interest coverage (0.06).
Acme United Corporation
- Low leverage (de 0.31) and strong interest coverage (6.9) indicate robust financial stability and manageable debt load.
3. Stock Volatility
Newell Brands Inc.
- Beta near 0.93 suggests moderate sensitivity to market swings, with a wide trading range (3.07–7.53).
Acme United Corporation
- Lower beta at 0.74 reflects lower volatility and more stable stock performance within a tighter price range (35.31–45.25).
4. Regulatory & Legal
Newell Brands Inc.
- Exposure to global regulations across multiple consumer product segments increases compliance complexity and litigation risk.
Acme United Corporation
- Primarily US and select international markets with more straightforward regulatory environments and lower legal risk.
5. Supply Chain & Operations
Newell Brands Inc.
- Large global footprint exposes company to supply chain disruptions and rising input costs amid inflationary pressures.
Acme United Corporation
- Smaller scale and focused product lines reduce operational complexity and supply chain vulnerability.
6. ESG & Climate Transition
Newell Brands Inc.
- Increasing pressure to improve sustainability practices across diverse product segments may require significant investment.
Acme United Corporation
- ESG risks are moderate; smaller footprint eases transition but growing stakeholder expectations remain a challenge.
7. Geopolitical Exposure
Newell Brands Inc.
- Global operations subject it to geopolitical tensions, tariffs, and foreign exchange risks impacting margins.
Acme United Corporation
- More concentrated regional exposure limits geopolitical risk but constrains international growth opportunities.
Which company shows a better risk-adjusted profile?
Acme United’s low leverage, strong liquidity, and robust Altman Z-Score (4.14, safe zone) underpin a healthier risk profile. Newell Brands struggles with high debt, weak interest coverage, and financial distress signals (Altman Z-Score 0.84, distress zone). The most impactful risk for Newell is its precarious capital structure, while for Acme United, slower growth amid niche market exposure is key. Acme’s stable financial footing and lower volatility justify confidence despite a smaller market cap.
Final Verdict: Which stock to choose?
Newell Brands Inc. (NWL) stands out as a cash machine with a deep asset base and strong brand recognition. However, its declining profitability and heavy debt burden are points of vigilance. NWL might suit aggressive growth portfolios able to tolerate operational headwinds and financial restructuring.
Acme United Corporation (ACU) benefits from a strategic moat built on efficient capital use and a clean balance sheet. Its steady cash flow and lower leverage offer better financial stability than NWL. ACU fits well within GARP portfolios that seek moderate growth with reasonable risk.
If you prioritize aggressive turnaround potential and brand legacy, Newell Brands could be compelling despite its financial challenges. However, if you seek steadier growth with a healthier balance sheet, Acme United offers better stability and a more favorable risk profile for cautious investors.
Disclaimer: Investment carries a risk of loss of initial capital. The past performance is not a reliable indicator of future results. Be sure to understand risks before making an investment decision.
Go Further
I encourage you to read the complete analyses of Newell Brands Inc. and Acme United Corporation to enhance your investment decisions: