Home > Comparison > Consumer Defensive > KMB vs ACU
The strategic rivalry between Kimberly-Clark Corporation and Acme United Corporation defines the current trajectory of the Consumer Defensive sector. Kimberly-Clark operates as a capital-intensive global leader in personal care and tissue products, while Acme United focuses on niche safety and cutting tools with a leaner operational model. This analysis explores their contrasting strategies in a battle for market relevance and growth. I aim to identify which company offers the superior risk-adjusted return for a diversified portfolio.
Table of contents
Companies Overview
Kimberly-Clark and Acme United stand as key players in the Household & Personal Products sector, each with distinct market footprints and strategies.
Kimberly-Clark Corporation: Global Consumer Care Leader
Kimberly-Clark dominates the personal care and consumer tissue market worldwide. Its core revenue comes from personal care products like diapers and feminine care, alongside consumer tissue and professional hygiene segments. In 2026, the company focuses on expanding its portfolio under renowned brands such as Huggies and Kleenex, while optimizing distribution through retail and e-commerce channels.
Acme United Corporation: Specialty Cutting and Safety Products Provider
Acme United serves niche markets with first aid, cutting, and safety tools. Its revenue engine relies on branded products like Westcott scissors and First Aid Only kits, targeting schools, offices, and industrial clients. In 2026, the company concentrates on broadening its product range and strengthening sales through wholesale and e-commerce platforms, particularly in North America and Europe.
Strategic Collision: Similarities & Divergences
Both companies operate in consumer defensive goods but with contrasting approaches: Kimberly-Clark pursues a broad global consumer base through mass-market household staples, while Acme United targets specialized, technical product segments. Their primary battleground lies in brand loyalty and distribution efficiency. Investors face distinct profiles—Kimberly-Clark offers scale and stability, whereas Acme United provides focused growth potential in specialized markets.
Income Statement Comparison
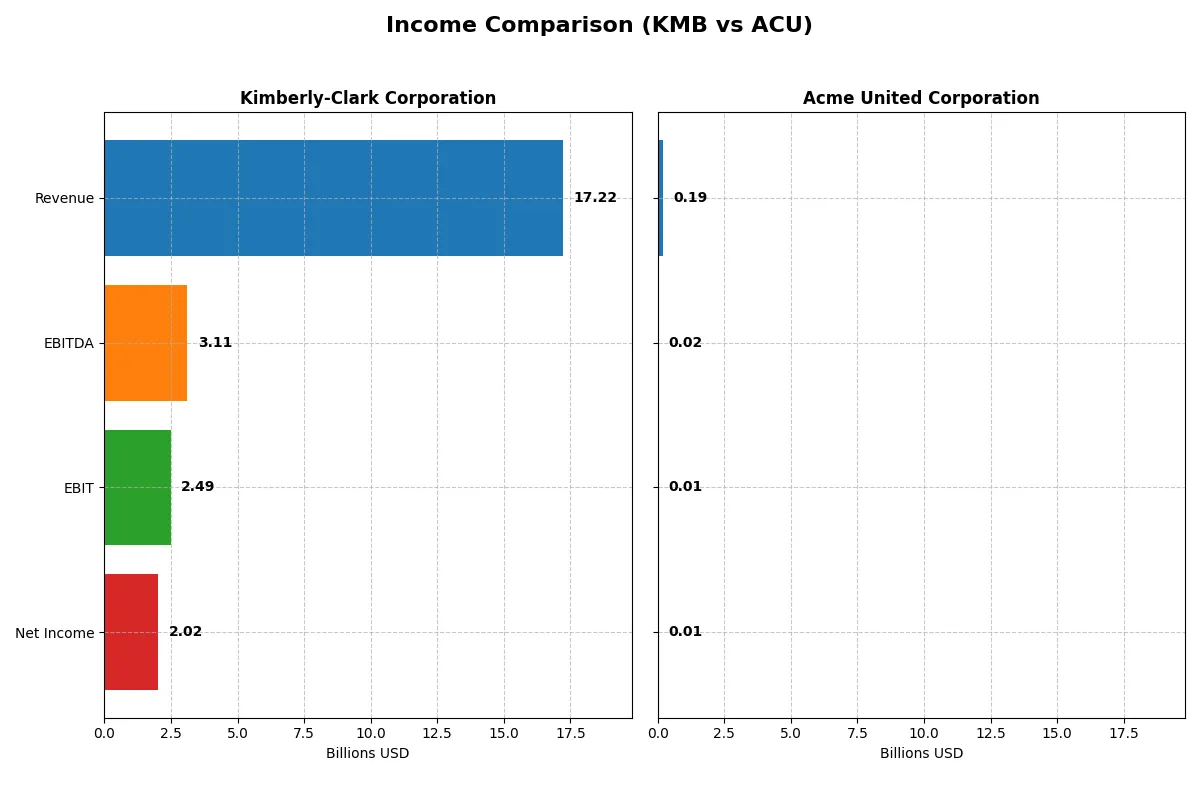
The following data dissects the core profitability and scalability of both corporate engines to reveal who dominates the bottom line:
| Metric | Kimberly-Clark Corporation (KMB) | Acme United Corporation (ACU) |
|---|---|---|
| Revenue | 17.22B | 194.49M |
| Cost of Revenue | 11.09B | 118.14M |
| Operating Expenses | 3.64B | 62.21M |
| Gross Profit | 6.13B | 76.35M |
| EBITDA | 3.11B | 20.44M |
| EBIT | 2.49B | 14.38M |
| Interest Expense | 256M | 2.08M |
| Net Income | 2.02B | 10.02M |
| EPS | 6.08 | 2.71 |
| Fiscal Year | 2025 | 2024 |
Income Statement Analysis: The Bottom-Line Duel
This income statement comparison reveals which company runs a more efficient and profitable business engine in its latest fiscal year.
Kimberly-Clark Corporation Analysis
Kimberly-Clark’s revenue slipped to $17.2B in 2025 from $20.1B in 2024, marking a 14% decline. Despite this, net income remains robust at $2.0B with an 11.7% net margin, reflecting solid margin control. However, the 1-year drop in revenue and EBIT signals pressure on top-line growth and operational momentum.
Acme United Corporation Analysis
Acme United posted a modest 1.6% revenue increase to $194M in 2024, sustaining growth over the period. Net income fell sharply by 44.5% year-on-year to $10M, compressing net margin to 5.15%. Gross margins held strong at 39.3%, but significant EBIT contraction highlights challenges in cost management or one-off hits.
Margin Strength vs. Revenue Scale
Kimberly-Clark delivers superior scale and profitability with a near 12% net margin versus Acme United’s 5%. Despite Kimberly-Clark’s recent revenue decline, its larger absolute earnings and margin resilience dominate. Investors favor profiles with stable margins and earnings power, making Kimberly-Clark’s efficiency more attractive despite top-line headwinds.
Financial Ratios Comparison
These vital ratios act as a diagnostic tool to expose the underlying fiscal health, valuation premiums, and capital efficiency of the companies analyzed:
| Ratios | Kimberly-Clark Corporation (KMB) | Acme United Corporation (ACU) |
|---|---|---|
| ROE | 3.03% (2024) | 18.18% (2023) |
| ROIC | 25.33% (2024) | 8.16% (2024) |
| P/E | 17.4x (2024) | 13.8x (2024) |
| P/B | 52.57x (2024) | 1.29x (2024) |
| Current Ratio | 0.80 (2024) | 4.17 (2024) |
| Quick Ratio | 0.54 (2024) | 1.71 (2024) |
| D/E | 9.42 (2024) | 0.31 (2024) |
| Debt-to-Assets | 47.8% (2024) | 20.3% (2024) |
| Interest Coverage | 11.9x (2024) | 6.79x (2024) |
| Asset Turnover | 1.21x (2024) | 1.20x (2024) |
| Fixed Asset Turnover | 2.67x (2024) | 5.33x (2024) |
| Payout Ratio | 64.0% (2024) | 22.2% (2024) |
| Dividend Yield | 3.69% (2024) | 1.61% (2024) |
| Fiscal Year | 2024 | 2024 |
Efficiency & Valuation Duel: The Vital Signs
Financial ratios act as a company’s DNA, unveiling hidden operational strengths and risks that surface beyond headline figures.
Kimberly-Clark Corporation
Kimberly-Clark shows a solid net margin of 11.74%, signaling operational efficiency. Its P/E of 16.63 suggests a fairly valued stock, neither cheap nor stretched. The company rewards shareholders with a strong 4.94% dividend yield. However, weak ROE and ROIC figures indicate challenges in capital returns, demanding cautious capital allocation scrutiny.
Acme United Corporation
Acme United posts a modest 5.15% net margin with a favorable P/E of 13.78, reflecting an attractively priced stock. Its ROE and ROIC, around 9.37% and 8.16%, are moderate but coupled with a strong balance sheet and efficient asset turnover. The company offers a modest 1.61% dividend yield, balancing growth and shareholder returns prudently.
Valuation Discipline vs. Operational Efficiency
Acme United’s favorable P/E and higher operational ratios suggest better efficiency and valuation balance. Kimberly-Clark delivers stronger profitability margins and dividends but shows weaker capital returns. Investors seeking steady income may prefer Kimberly-Clark, while those valuing operational efficiency and growth potential might lean toward Acme United.
Which one offers the Superior Shareholder Reward?
Kimberly-Clark (KMB) delivers a robust 4.94% dividend yield with an 82% payout ratio, supported by strong free cash flow coverage (1.67x). Its aggressive buyback program further enhances total returns. Acme United (ACU) pays a modest 1.61% yield with a low 22% payout, favoring reinvestment in growth and acquisitions, but buybacks are less intense. Historically, KMB’s mature distribution model offers more sustainable, higher immediate shareholder rewards. I conclude KMB provides superior total return potential for 2026 investors seeking income and capital appreciation.
Comparative Score Analysis: The Strategic Profile
The radar chart reveals the fundamental DNA and trade-offs of Kimberly-Clark Corporation and Acme United Corporation, highlighting their financial strengths and vulnerabilities:
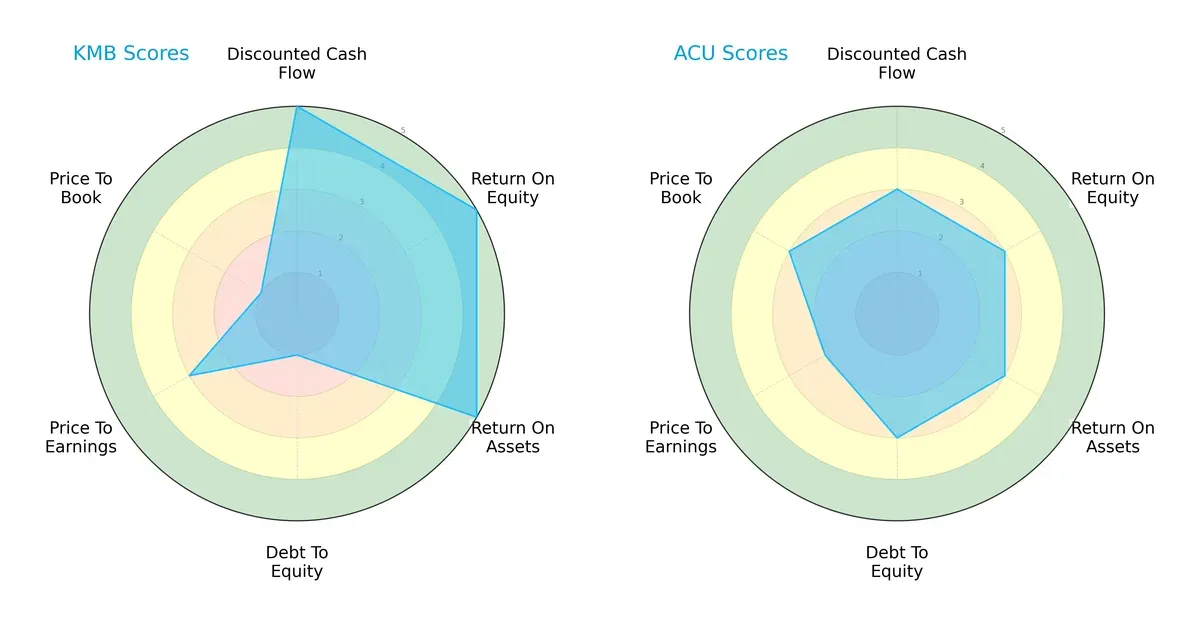
Kimberly-Clark excels in discounted cash flow, ROE, and ROA, signaling strong profitability and asset efficiency. However, it carries a heavy debt burden and unfavorable valuation metrics. Acme United presents a more balanced, though moderate, profile with less debt risk but weaker profitability and valuation scores. Kimberly-Clark relies on operational excellence but bears financial leverage risks. Acme United offers stability but lacks a clear competitive edge.
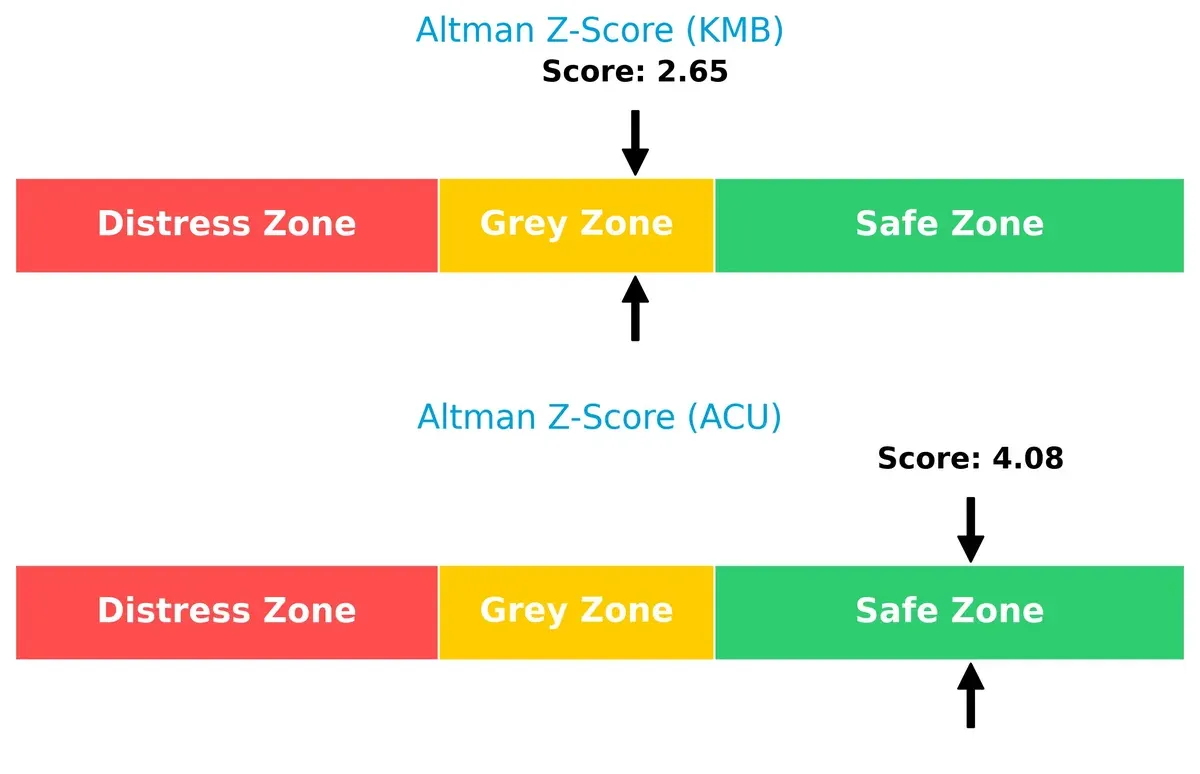
Bankruptcy Risk: Solvency Showdown
Kimberly-Clark’s Altman Z-Score sits in the grey zone at 2.65, while Acme United’s safer 4.08 score places it firmly in the safe zone, indicating stronger long-term solvency for Acme United:
Financial Health: Quality of Operations
Both firms score a solid 7 on the Piotroski F-Score, reflecting strong internal financial health with no immediate red flags in profitability, leverage, or liquidity metrics:

How are the two companies positioned?
This section dissects KMB and ACU’s operational DNA by comparing their revenue distribution and internal dynamics. The goal is to confront their economic moats and identify which model offers the most resilient competitive advantage today.
Revenue Segmentation: The Strategic Mix
This visual comparison dissects how Kimberly-Clark Corporation and Acme United Corporation diversify their income streams and reveals where their primary sector bets lie:
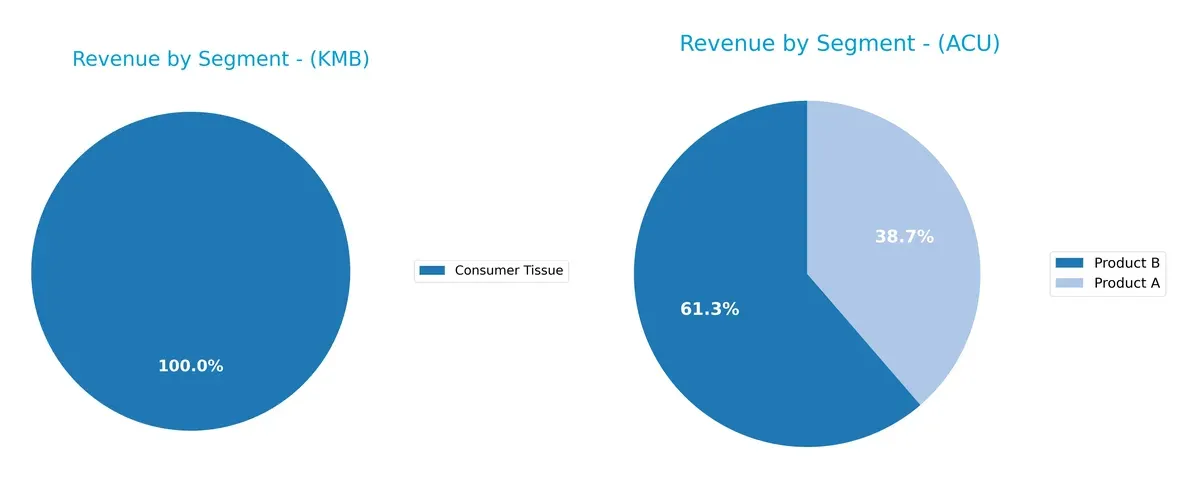
Kimberly-Clark anchors its revenue in three robust segments: Personal Care leads with $10.7B, Consumer Tissue follows with $6.3B, and K-C Professional adds $3.4B. This mix signals strong ecosystem lock-in and reduces concentration risk. Acme United, by contrast, pivots between Product B at $119M and Product A at $75M, showing a tighter focus but less diversification. Kimberly-Clark’s broader base offers more resilience versus Acme’s concentrated bets.
Strengths and Weaknesses Comparison
This table compares the Strengths and Weaknesses of Kimberly-Clark Corporation and Acme United Corporation:
Kimberly-Clark Corporation Strengths
- Strong diversification across Consumer Tissue, K-C Professional, and Personal Care segments
- Favorable net margin of 11.74% indicating solid profitability
- Low debt to assets ratio and strong interest coverage ratio
- Attractive dividend yield of 4.94%
Acme United Corporation Strengths
- Favorable WACC at 6.96% supporting efficient capital use
- Strong asset turnover and fixed asset turnover ratios indicating operational efficiency
- Favorable PE and PB ratios suggesting reasonable valuation
- Geographic diversification with significant US, Europe, and Canada revenues
Kimberly-Clark Corporation Weaknesses
- Unfavorable ROE and ROIC both at 0%, signaling weak returns on invested capital
- Unavailable WACC data limits cost of capital insights
- Poor liquidity ratios including current and quick ratios
- Unfavorable asset and fixed asset turnover ratios
Acme United Corporation Weaknesses
- Unfavorable ROE at 9.37% below optimal levels
- High current ratio flagged as unfavorable indicating potential working capital inefficiency
- Net margin neutral at 5.15%, lower than KMB’s profitability
- Dividend yield neutral at 1.61%
Kimberly-Clark’s strengths lie in its diversified product portfolio and strong profitability metrics, though liquidity and returns on capital are concerns. Acme United shows operational efficiency and solid valuation metrics but faces challenges with profitability and working capital management. Both companies exhibit distinct profiles that shape their strategic focus.
The Moat Duel: Analyzing Competitive Defensibility
A structural moat is the only thing protecting long-term profits from the erosion of competition. Let’s dissect how these companies defend their turf:
Kimberly-Clark Corporation: Intangible Assets Powerhouse
Kimberly-Clark leverages strong brand recognition and customer loyalty, reflected in stable gross margins near 36%. Yet, declining revenue growth signals emerging challenges in 2026.
Acme United Corporation: Niche Cost Advantage Specialist
Acme United’s moat derives from efficient cost management in specialized safety and cutting products. Despite slight margin pressure, it sustains positive revenue growth and expanding market reach.
Brand Prestige vs. Cost Efficiency: The Moat Face-Off
Kimberly-Clark commands a deeper moat through entrenched brand equity and product portfolio breadth. Acme United’s cost advantage is narrower, making Kimberly-Clark better positioned to defend its market share amid intensifying competition.
Which stock offers better returns?
Over the past year, Kimberly-Clark Corporation’s stock fell sharply, while Acme United Corporation’s shares showed steady growth and accelerating gains in recent months.
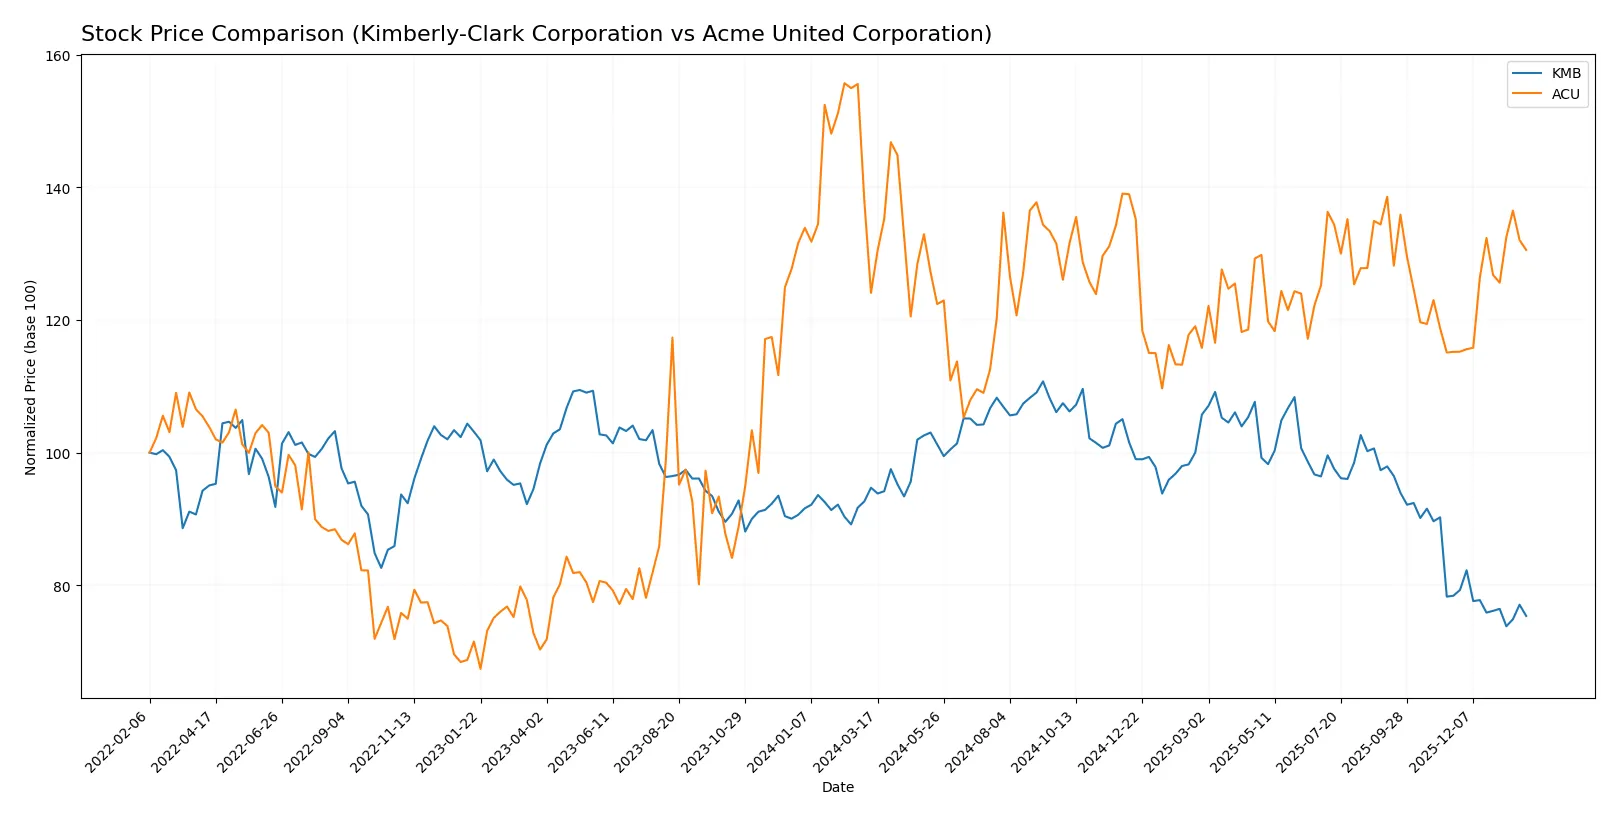
Trend Comparison
Kimberly-Clark’s stock declined 20.42% over the past 12 months, indicating a clear bearish trend with decelerating losses and a high volatility of 12.48%. The stock peaked at 146.91 and troughed at 97.92.
Acme United’s shares gained 5.21% over the same period, reflecting a bullish trend with accelerating momentum and lower volatility at 2.76%. The price ranged from 33.7 to a high of 46.99.
Comparing both, Acme United delivered superior market performance, posting positive returns against Kimberly-Clark’s significant decline throughout the analyzed year.
Target Prices
Analysts set a moderate target consensus for Kimberly-Clark Corporation, suggesting upside potential from current levels.
| Company | Target Low | Target High | Consensus |
|---|---|---|---|
| Kimberly-Clark Corporation | 102 | 162 | 122.38 |
The target consensus of $122.38 sits 22% above Kimberly-Clark’s current price near $100, indicating cautious optimism. No verified target price data is available for Acme United Corporation.

Don’t Let Luck Decide Your Entry Point
Optimize your entry points with our advanced ProRealTime indicators. You’ll get efficient buy signals with precise price targets for maximum performance. Start outperforming now!
How do institutions grade them?
The following section compares the latest institutional grades assigned to Kimberly-Clark Corporation and Acme United Corporation:
Kimberly-Clark Corporation Grades
Below is a summary of recent grades from reputable grading companies for Kimberly-Clark Corporation.
| Grading Company | Action | New Grade | Date |
|---|---|---|---|
| UBS | Maintain | Neutral | 2026-01-28 |
| UBS | Maintain | Neutral | 2026-01-14 |
| Citigroup | Maintain | Sell | 2026-01-14 |
| TD Cowen | Maintain | Hold | 2026-01-08 |
| Wells Fargo | Maintain | Equal Weight | 2026-01-05 |
| Citigroup | Maintain | Sell | 2025-12-17 |
| BNP Paribas Exane | Maintain | Neutral | 2025-12-01 |
| Argus Research | Upgrade | Buy | 2025-11-13 |
| Evercore ISI Group | Downgrade | In Line | 2025-11-04 |
| TD Cowen | Maintain | Hold | 2025-11-04 |
Acme United Corporation Grades
Below is the only available institutional grade for Acme United Corporation.
| Grading Company | Action | New Grade | Date |
|---|---|---|---|
| DA Davidson | Maintain | Buy | 2016-07-01 |
Which company has the best grades?
Kimberly-Clark’s grades are mostly neutral to hold with some sell ratings, reflecting cautious sentiment. Acme United’s single, older buy rating suggests limited recent institutional coverage. Investors may view Kimberly-Clark’s diverse grades as more informative, though mixed opinions signal uncertainty.
Risks specific to each company
The following categories identify the critical pressure points and systemic threats facing both firms in the 2026 market environment:
1. Market & Competition
Kimberly-Clark Corporation
- Dominates consumer tissue and personal care with strong brands but faces intense competition in mature markets.
Acme United Corporation
- Operates niche first aid and cutting tools markets with less scale but diversified end markets.
2. Capital Structure & Debt
Kimberly-Clark Corporation
- Low debt-to-equity ratio signals conservative leverage but debt rating scores conflict, raising caution.
Acme United Corporation
- Moderate leverage with solid interest coverage and favorable debt-to-assets ratio supports financial flexibility.
3. Stock Volatility
Kimberly-Clark Corporation
- Very low beta (0.28) reflects defensive stock behavior, appealing in volatile markets.
Acme United Corporation
- Higher beta (0.74) implies greater sensitivity to market swings, increasing risk for risk-averse investors.
4. Regulatory & Legal
Kimberly-Clark Corporation
- Faces regulatory scrutiny on product safety and environmental compliance globally.
Acme United Corporation
- Smaller scale reduces regulatory complexity but niche products may face specific compliance challenges.
5. Supply Chain & Operations
Kimberly-Clark Corporation
- Large, global supply chains vulnerable to disruptions and rising raw material costs.
Acme United Corporation
- Supply chain more localized but dependent on specialized components, risking operational bottlenecks.
6. ESG & Climate Transition
Kimberly-Clark Corporation
- ESG efforts significant but lag in some sustainability metrics could attract activist investor pressure.
Acme United Corporation
- ESG initiatives less publicized; smaller footprint but risks from potential regulatory shifts remain.
7. Geopolitical Exposure
Kimberly-Clark Corporation
- Global presence exposes it to trade tensions and currency fluctuations.
Acme United Corporation
- Primarily North American focus limits geopolitical risk but less diversification downside.
Which company shows a better risk-adjusted profile?
Kimberly-Clark’s most impactful risk lies in its complex global supply chain vulnerable to disruptions and rising costs. Acme’s key risk is its higher stock volatility and moderate leverage despite good coverage ratios. Acme’s strong Altman Z-Score (4.08) signals lower bankruptcy risk versus Kimberly-Clark’s grey zone (2.65). Overall, Acme United offers a better risk-adjusted profile, supported by favorable financial ratios and a safer bankruptcy outlook, despite its smaller scale and higher market sensitivity.
Final Verdict: Which stock to choose?
Kimberly-Clark Corporation’s superpower lies in its resilient cash generation and dependable dividend yield. However, its declining ROIC trend and weak liquidity ratios are points of vigilance. It suits portfolios focused on steady income with moderate growth tolerance.
Acme United Corporation commands a strategic moat through operational efficiency and solid asset turnover, coupled with a strong balance sheet. Its valuation metrics and improving stock momentum offer a safer profile compared to Kimberly-Clark. It fits well within GARP (Growth at a Reasonable Price) portfolios.
If you prioritize dependable income and a historically stable cash flow, Kimberly-Clark is the compelling choice despite recent softness in growth metrics. However, if you seek capital appreciation with better financial stability and valuation appeal, Acme United offers superior risk-adjusted potential. Both require cautious monitoring of their respective operational challenges.
Disclaimer: Investment carries a risk of loss of initial capital. The past performance is not a reliable indicator of future results. Be sure to understand risks before making an investment decision.
Go Further
I encourage you to read the complete analyses of Kimberly-Clark Corporation and Acme United Corporation to enhance your investment decisions: