Home > Comparison > Consumer Defensive > KVUE vs ACU
The strategic rivalry between Kenvue Inc. and Acme United Corporation shapes the landscape of the household and personal products industry. Kenvue operates as a large-scale consumer health conglomerate with diversified segments, while Acme United focuses on niche safety and cutting tools with a leaner operational model. This analysis pits broad-based scale against specialized agility to determine which offers the superior risk-adjusted return for a diversified portfolio.
Table of contents
Companies Overview
Kenvue Inc. and Acme United Corporation shape critical niches within the global household and personal products market.
Kenvue Inc.: Global Consumer Health Powerhouse
Kenvue Inc. operates as a consumer health giant, generating revenue primarily through its three core segments: Self Care, Skin Health and Beauty, and Essential Health. It monetizes trusted brands like Tylenol, Neutrogena, and Band-Aid. In 2026, the company sharpens its focus on expanding its portfolio in essential health while leveraging brand legacy and global reach.
Acme United Corporation: Specialty Tools and Safety Supplier
Acme United Corporation is a specialized supplier of first aid, cutting, and measuring products across multiple markets including school, office, and industrial sectors. The company drives revenue through diversified brands like Westcott and Clauss. Its 2026 strategy centers on strengthening distribution channels and broadening product innovation in safety and cutting tools.
Strategic Collision: Similarities & Divergences
Both companies operate in the consumer defensive sector but pursue distinct business philosophies. Kenvue emphasizes a broad, branded portfolio with a global footprint, while Acme United focuses on niche product specialization and diversified market segments. Their main competition lies in consumer trust and product innovation. Investors face contrasting profiles: Kenvue offers scale and brand power; Acme United delivers agility and targeted market penetration.
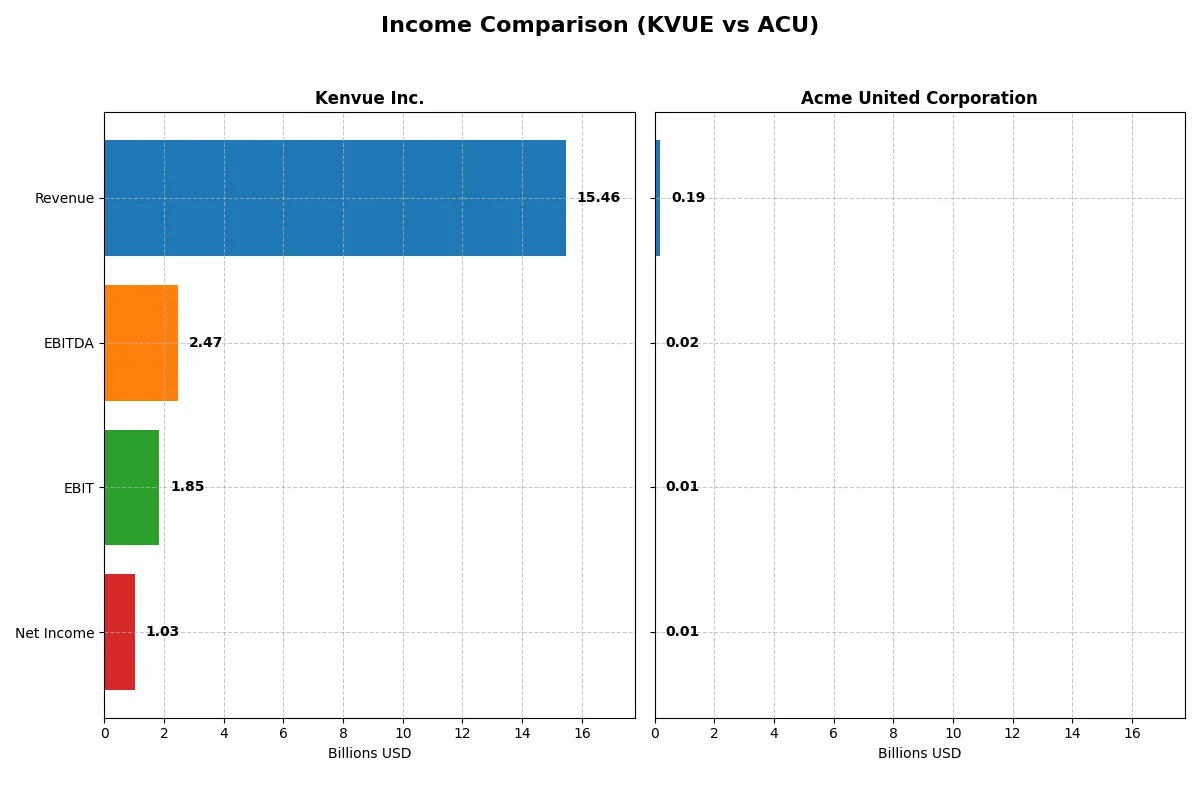
Income Statement Comparison
This data dissects the core profitability and scalability of both corporate engines to reveal who dominates the bottom line:
| Metric | Kenvue Inc. (KVUE) | Acme United Corporation (ACU) |
|---|---|---|
| Revenue | 15.5B | 194.5M |
| Cost of Revenue | 6.5B | 118.1M |
| Operating Expenses | 7.1B | 62.2M |
| Gross Profit | 8.9B | 76.4M |
| EBITDA | 2.5B | 20.4M |
| EBIT | 1.8B | 14.4M |
| Interest Expense | 431M | 2.1M |
| Net Income | 1.0B | 10.0M |
| EPS | 0.54 | 2.71 |
| Fiscal Year | 2024 | 2024 |
Income Statement Analysis: The Bottom-Line Duel
This income statement comparison reveals which company runs a more efficient and profitable corporate engine through recent financial performance.
Kenvue Inc. Analysis
Kenvue’s revenue held steady around 15.45B in 2024, showing minimal growth. Net income declined sharply to 1.03B, down from 1.66B in 2023. Despite a robust gross margin near 58%, net margin compressed to 6.7%, reflecting rising operating expenses and a 27.5% EBIT drop. The 2024 results signal weakening momentum after years of solid profitability.
Acme United Corporation Analysis
Acme’s revenue grew modestly to 194M in 2024, continuing an 18.6% rise over five years. Net income retreated to 10M from 18M in 2023, with net margin falling to 5.15%. Gross margin stayed healthy at 39%, while EBIT shrank 44%. Though EPS dropped sharply, the company maintains steady revenue gains and moderate margin resilience amid cost pressures.
Verdict: Margin Power vs. Revenue Scale
Kenvue commands superior margins and scale with a 15B+ revenue base and nearly 12% EBIT margin, dwarfing Acme’s sub-200M top line. However, Kenvue’s recent margin erosion and net income decline contrast with Acme’s steadier revenue growth and consistent, though smaller, profitability. For investors, Kenvue offers scale-driven margin power, while Acme presents a leaner profile with steady growth potential.
Financial Ratios Comparison
These vital ratios act as a diagnostic tool to expose the underlying fiscal health, valuation premiums, and capital efficiency of the companies compared below:
| Ratios | Kenvue Inc. (KVUE) | Acme United Corporation (ACU) |
|---|---|---|
| ROE | 10.7% | 9.4% |
| ROIC | 6.2% | 8.2% |
| P/E | 39.4 | 13.8 |
| P/B | 4.20 | 1.29 |
| Current Ratio | 0.96 | 4.17 |
| Quick Ratio | 0.69 | 1.71 |
| D/E | 0.90 | 0.31 |
| Debt-to-Assets | 34.1% | 20.3% |
| Interest Coverage | 4.27 | 6.79 |
| Asset Turnover | 0.60 | 1.20 |
| Fixed Asset Turnover | 8.36 | 5.33 |
| Payout Ratio | 151% | 22% |
| Dividend Yield | 3.83% | 1.61% |
| Fiscal Year | 2024 | 2024 |
Efficiency & Valuation Duel: The Vital Signs
Financial ratios act as the company’s DNA, uncovering hidden risks and operational strengths beyond headline numbers.
Kenvue Inc.
Kenvue posts a neutral 10.65% ROE and a 6.66% net margin, signaling moderate profitability. The stock trades at a stretched 39.38 P/E and a rich 4.2 P/B, reflecting high valuation. A 3.83% dividend yield rewards shareholders, balancing reinvestment with steady returns amid a slightly unfavorable overall ratio profile.
Acme United Corporation
Acme United shows a modest 9.37% ROE and a 5.15% net margin, slightly lagging in profitability. Valuation metrics appear attractive with a 13.78 P/E and 1.29 P/B, indicating undervaluation. The company maintains a small 1.61% dividend yield while demonstrating strong operational efficiency and a favorable ratio profile overall.
Valuation Stretch vs. Operational Efficiency
Kenvue’s premium valuation contrasts with Acme United’s attractive multiples and stronger operational ratios. Acme balances risk and reward better through efficient asset use and conservative leverage. Investors seeking value and operational discipline may find Acme’s profile more aligned with their goals.
Which one offers the Superior Shareholder Reward?
I contrast Kenvue Inc. (KVUE) and Acme United Corporation (ACU) on distribution philosophies and shareholder returns in 2026. KVUE yields 3.8% with a payout ratio over 150%, risking cash flow strain. ACU offers a modest 1.6% yield with a conservative 22% payout, preserving free cash flow for steady buybacks. KVUE’s buyback program is less intense, while ACU deploys strong buybacks alongside dividends, enhancing total returns sustainably. I see ACU’s balanced distribution and capital allocation as superior for long-term shareholder value in 2026.
Comparative Score Analysis: The Strategic Profile
The radar chart reveals the fundamental DNA and trade-offs of Kenvue Inc. and Acme United Corporation, highlighting their financial strengths and vulnerabilities:
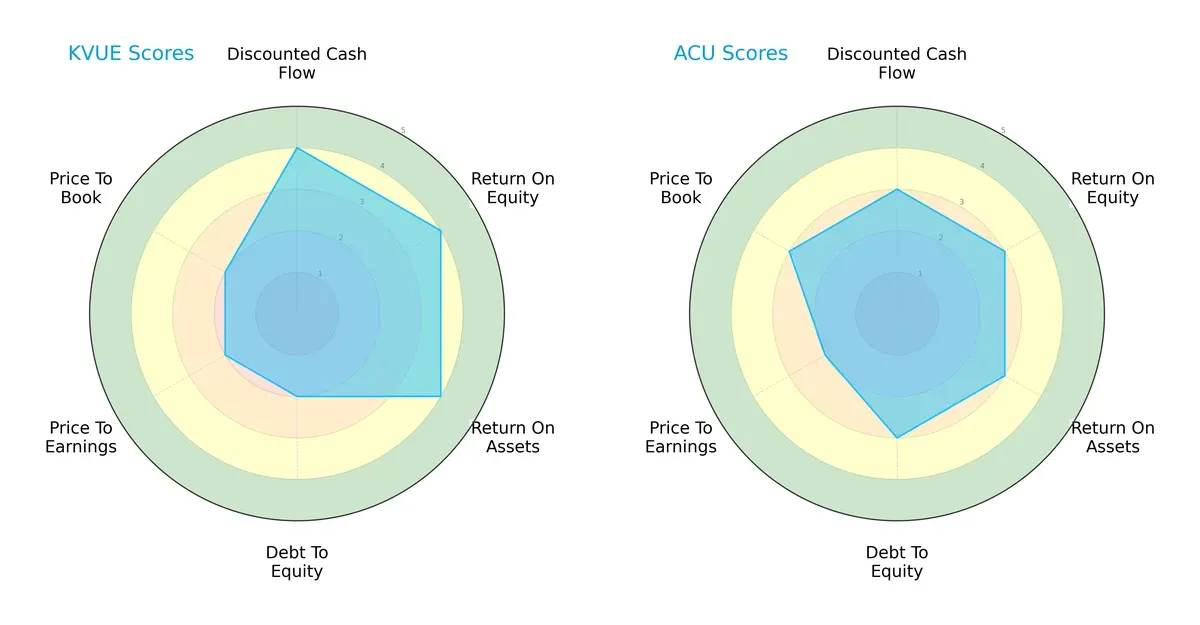
Kenvue excels in profitability metrics with superior DCF, ROE, and ROA scores, reflecting efficient capital utilization. However, its higher debt-to-equity and weaker valuation scores suggest greater financial risk and possible overvaluation. Acme United offers a more balanced profile with moderate scores across the board, relying on steadier leverage management and a slightly better price-to-book valuation.
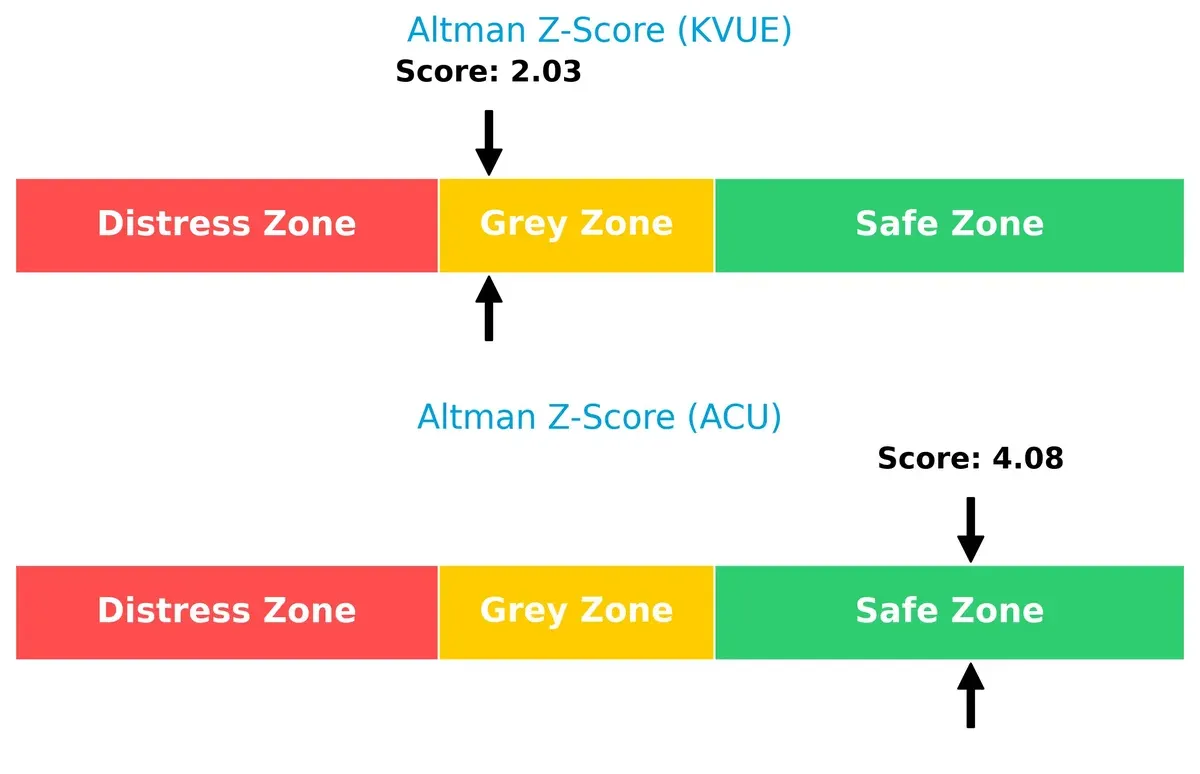
Bankruptcy Risk: Solvency Showdown
Kenvue’s Altman Z-Score of 2.03 places it in the grey zone, signaling moderate bankruptcy risk. Acme United’s 4.08 score firmly situates it in the safe zone, implying stronger long-term survival prospects in this cycle:
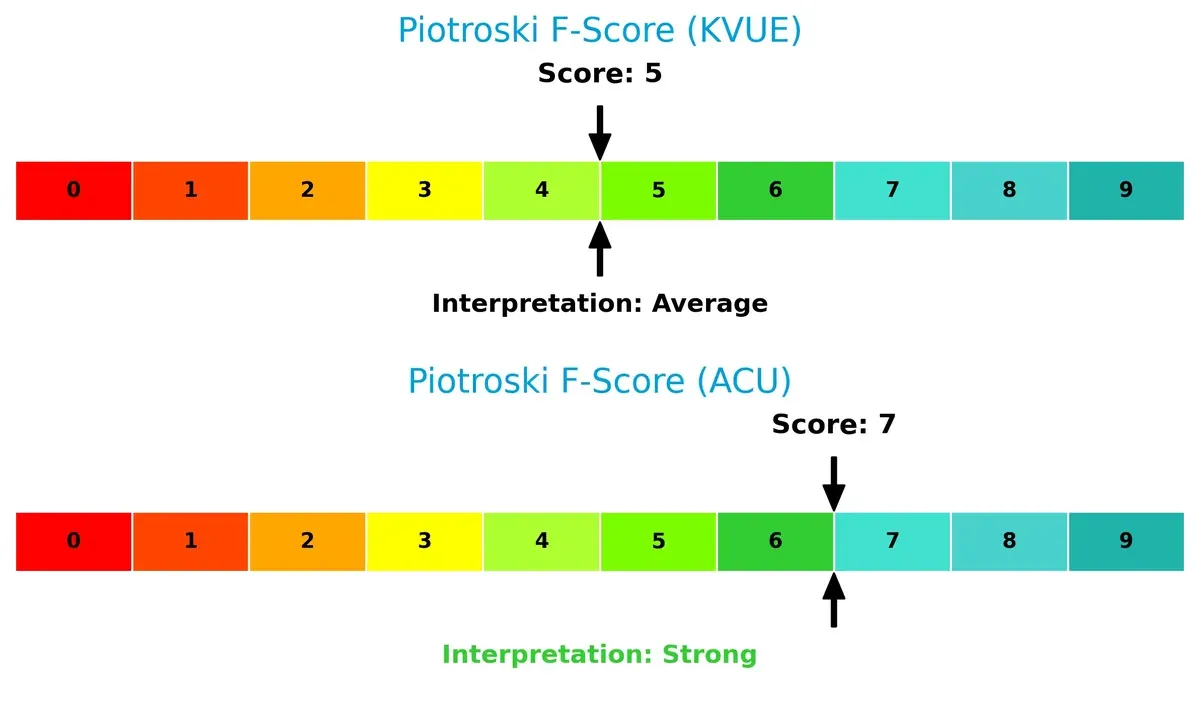
Financial Health: Quality of Operations
Acme United’s Piotroski F-Score of 7 indicates robust financial health and operational quality. Kenvue’s score of 5 is average and flags potential concerns in internal metrics compared to Acme’s stronger fundamentals:
How are the two companies positioned?
This section dissects the operational DNA of KVUE and ACU by comparing their revenue distribution and internal dynamics. The goal is to confront their economic moats and identify which model offers the most resilient, sustainable advantage today.
Revenue Segmentation: The Strategic Mix
This comparison dissects how Kenvue Inc. and Acme United Corporation diversify their income streams and where their primary sector bets lie:
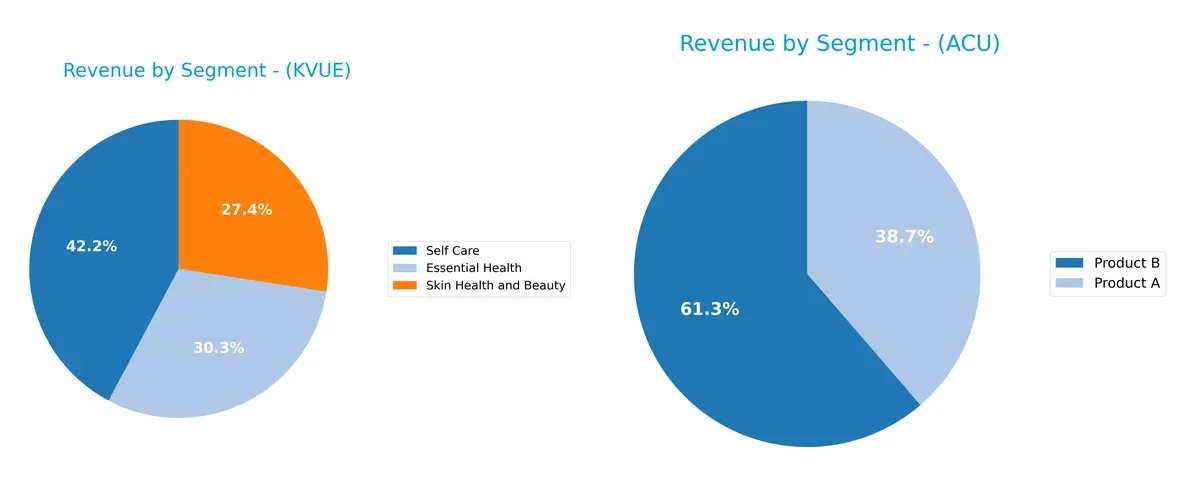
Kenvue Inc. anchors its revenue in three robust segments: Self Care leads with $6.5B, followed by Essential Health at $4.7B, and Skin Health and Beauty at $4.2B. This balanced mix mitigates concentration risk and fosters ecosystem lock-in. Acme United leans heavily on two segments, Product B dwarfs Product A with $119M versus $75M. Acme’s narrower focus exposes it to higher volatility but allows sharper strategic pivots.
Strengths and Weaknesses Comparison
This table compares the strengths and weaknesses of Kenvue Inc. and Acme United Corporation:
Kenvue Inc. Strengths
- Broad product diversification across Essential Health, Self Care, and Skin Health segments
- Strong global presence with significant North America and EMEA revenues
- Favorable fixed asset turnover and dividend yield ratios
Acme United Corporation Strengths
- Favorable valuation metrics with low PE and PB ratios
- Strong liquidity with high current and quick ratios
- Low leverage and solid interest coverage ratios
- Higher asset turnover indicating efficient asset use
Kenvue Inc. Weaknesses
- Unfavorable valuation multiples with high PE and PB ratios
- Weak liquidity ratios below 1
- Slightly unfavorable overall financial ratios
Acme United Corporation Weaknesses
- Lower profitability metrics including ROE below benchmark
- High current ratio may indicate inefficient working capital use
Kenvue’s strengths lie in its diversified revenue base and global reach, but it faces valuation and liquidity challenges. Acme United benefits from strong financial health and efficient asset use, yet its profitability and working capital management warrant caution. These contrasts shape each company’s strategic focus on balancing growth and financial stability.
The Moat Duel: Analyzing Competitive Defensibility
A structural moat is the only thing protecting long-term profits from relentless competition erosion. Here’s how these two firms stack up:
Kenvue Inc.: Intangible Assets and Brand Legacy Moat
Kenvue leverages powerful brands like Tylenol and Neutrogena, sustaining high gross margins near 58%. Its growing ROIC signals expanding profitability, though recent revenue growth stalls. New health segments may deepen its moat in 2026.
Acme United Corporation: Cost Advantage and Niche Market Moat
Acme United relies on cost efficiency and specialized products in first aid and cutting tools. Its lower gross margin at 39% and declining ROIC reveal margin pressure. Expansion into safety and OTC markets could offset these headwinds.
Verdict: Brand Equity vs. Cost Discipline in Defensive Consumer Goods
Kenvue’s intangible asset moat is wider, supported by strong margin stability and improving ROIC trends. Acme’s cost advantage is narrower and weakened by shrinking returns. Kenvue stands better poised to defend market share long term.
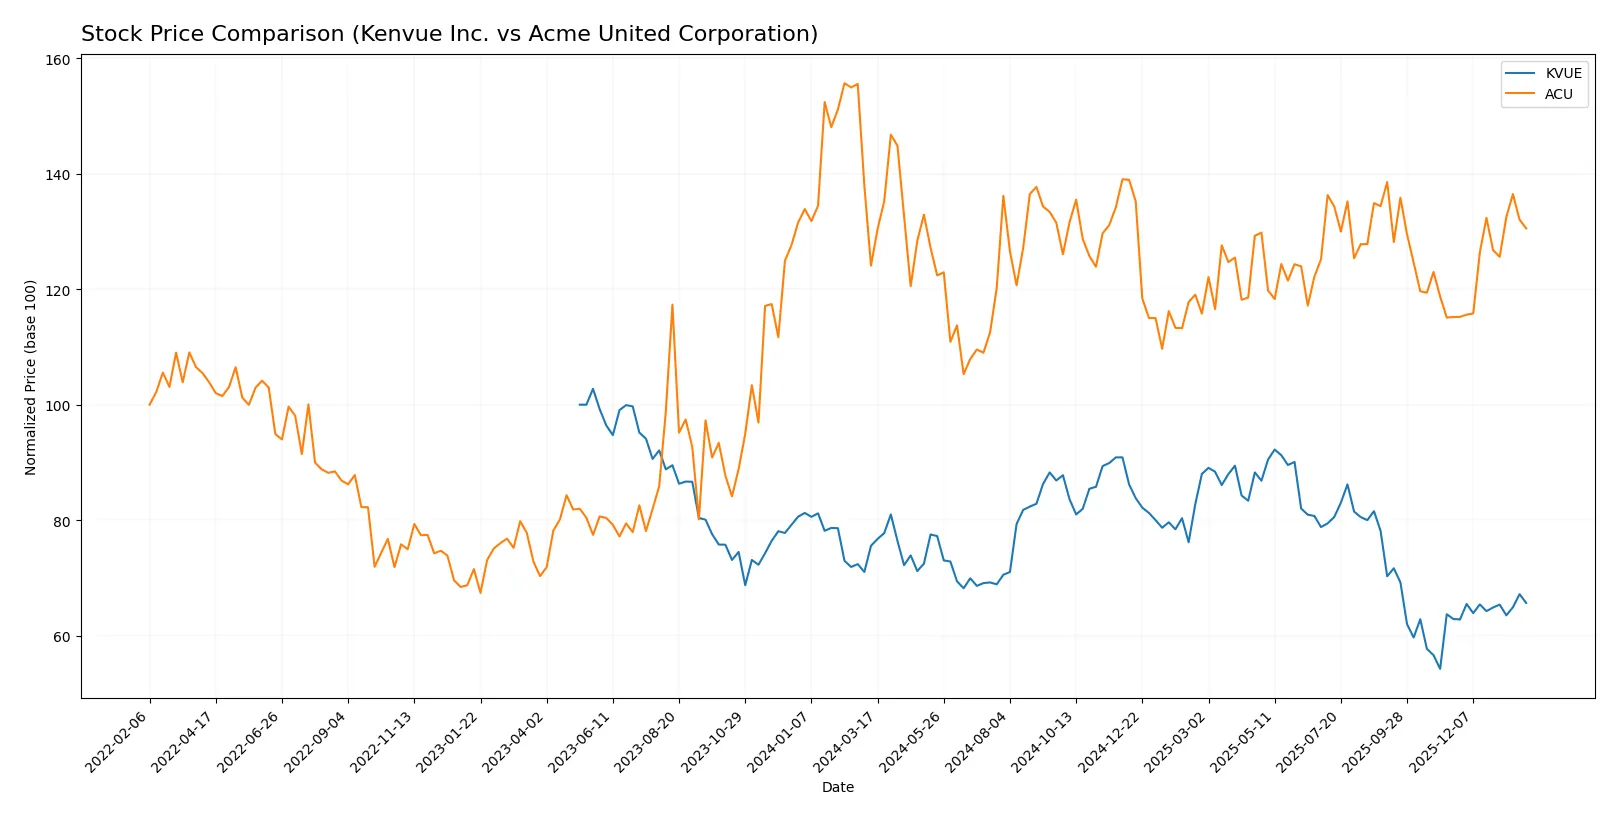
Which stock offers better returns?
Over the past year, Kenvue Inc. experienced a declining price trend with some recent recovery, while Acme United Corporation showed steady gains and accelerating momentum in the same period.
Trend Comparison
Kenvue Inc. declined 13.09% over the past year, marking a bearish trend with accelerating downward momentum. The stock ranged between 24.44 and 14.37, showing increased volatility with 2.49 std deviation.
Acme United Corporation advanced 5.21% over the past year, reflecting a bullish trend with accelerating gains. The share price fluctuated between 33.7 and 46.99, accompanied by a 2.76 std deviation indicating moderate volatility.
Comparing both, Acme United outperformed Kenvue with positive overall returns and stronger recent momentum, delivering the highest market performance over the analyzed period.
Target Prices
Kenvue Inc. shows a clear target price consensus from reliable analysts.
| Company | Target Low | Target High | Consensus |
|---|---|---|---|
| Kenvue Inc. | 15 | 22 | 17.86 |
Analysts expect Kenvue’s shares to trade between $15 and $22, with a consensus near $17.86, close to the current price of $17.4. No verified target price data is available for Acme United Corporation.

Don’t Let Luck Decide Your Entry Point
Optimize your entry points with our advanced ProRealTime indicators. You’ll get efficient buy signals with precise price targets for maximum performance. Start outperforming now!
How do institutions grade them?
Institutional grades vary between Kenvue Inc. and Acme United Corporation as follows:
Kenvue Inc. Grades
The following table summarizes recent grades assigned to Kenvue Inc. by major financial institutions:
| Grading Company | Action | New Grade | Date |
|---|---|---|---|
| Barclays | Maintain | Equal Weight | 2025-11-10 |
| Canaccord Genuity | Downgrade | Hold | 2025-10-29 |
| Jefferies | Maintain | Buy | 2025-10-27 |
| JP Morgan | Maintain | Overweight | 2025-10-10 |
| Citigroup | Maintain | Neutral | 2025-10-09 |
| UBS | Maintain | Neutral | 2025-10-08 |
| B of A Securities | Maintain | Buy | 2025-10-08 |
| Goldman Sachs | Maintain | Neutral | 2025-10-02 |
| Barclays | Maintain | Equal Weight | 2025-10-01 |
| Rothschild & Co | Upgrade | Buy | 2025-09-26 |
Acme United Corporation Grades
Only one institutional grade is available for Acme United Corporation, dating back to 2016:
| Grading Company | Action | New Grade | Date |
|---|---|---|---|
| DA Davidson | Maintain | Buy | 2016-07-01 |
Which company has the best grades?
Kenvue Inc. shows a broad spectrum of recent grades from neutral to buy, reflecting mixed but generally positive sentiment. Acme United has a single, older buy rating that limits current comparability. Investors may find Kenvue’s more recent and diverse evaluations more informative, though the downgrade signals caution.
Risks specific to each company
The following categories identify the critical pressure points and systemic threats facing both firms in the 2026 market environment:
1. Market & Competition
Kenvue Inc.
- Faces intense competition in consumer health with strong brand portfolios but high valuation risks.
Acme United Corporation
- Operates in niche safety and cutting products with stable demand but limited scale and market reach.
2. Capital Structure & Debt
Kenvue Inc.
- Moderate leverage (D/E 0.9) with neutral debt metrics but weak liquidity ratios (current ratio 0.96).
Acme United Corporation
- Low leverage (D/E 0.31) and strong liquidity (current ratio 4.17) suggest solid financial stability.
3. Stock Volatility
Kenvue Inc.
- Beta 0.55 indicates lower volatility and less sensitivity to market swings.
Acme United Corporation
- Beta 0.74 suggests moderate volatility, reflecting smaller market cap and liquidity.
4. Regulatory & Legal
Kenvue Inc.
- Operates in highly regulated healthcare sector with potential product liability risks.
Acme United Corporation
- Faces fewer regulatory burdens, primarily in consumer safety and industrial product compliance.
5. Supply Chain & Operations
Kenvue Inc.
- Global supply chain complexity increases exposure to disruptions and cost inflation.
Acme United Corporation
- Smaller, more localized operations reduce supply chain risk but limit scale advantages.
6. ESG & Climate Transition
Kenvue Inc.
- Larger footprint demands aggressive ESG compliance and transition strategies, increasing operational costs.
Acme United Corporation
- Less exposed to climate risks but may face pressure to improve sustainability metrics over time.
7. Geopolitical Exposure
Kenvue Inc.
- Global presence makes it vulnerable to geopolitical tensions, trade restrictions, and currency fluctuations.
Acme United Corporation
- Primarily North American operations limit geopolitical risk but reduce diversification benefits.
Which company shows a better risk-adjusted profile?
Acme United faces lower financial leverage and stronger liquidity, reducing bankruptcy risk. Kenvue’s weaker current ratio and higher valuation multiples raise caution. Acme’s Altman Z-score (4.08, safe zone) and Piotroski score (7, strong) outperform Kenvue’s (2.03 and 5 respectively), signaling a more robust financial position. Kenvue’s intense regulatory environment and supply chain complexity remain key risks. Acme’s smaller scale and market niche limit upside but enhance risk control. Overall, Acme United presents a superior risk-adjusted profile in 2026.
Final Verdict: Which stock to choose?
Kenvue Inc. (KVUE) impresses with its rising profitability and strong capital efficiency, signaling improving operational strength. Its key vulnerability lies in a tight liquidity position, which demands close monitoring. KVUE suits investors seeking aggressive growth with a tolerance for near-term financial pressures.
Acme United Corporation (ACU) offers a solid strategic moat through disciplined capital structure and better balance sheet safety. Its lower valuation multiples and healthier liquidity profile provide a cushion against volatility. ACU fits well into a GARP (Growth at a Reasonable Price) portfolio seeking stability with growth potential.
If you prioritize dynamic growth backed by operational momentum, KVUE is the compelling choice due to its accelerating profitability despite liquidity risks. However, if you seek better financial stability and valuation support, ACU offers superior balance sheet strength and a more conservative risk profile. Both stocks present distinct analytical scenarios aligned with differing investor risk tolerances.
Disclaimer: Investment carries a risk of loss of initial capital. The past performance is not a reliable indicator of future results. Be sure to understand risks before making an investment decision.
Go Further
I encourage you to read the complete analyses of Kenvue Inc. and Acme United Corporation to enhance your investment decisions: