Home > Comparison > Consumer Defensive > HELE vs ACU
The strategic rivalry between Helen of Troy Limited and Acme United Corporation shapes the competitive landscape of the household and personal products sector. Helen of Troy operates as a diversified consumer products powerhouse spanning wellness, beauty, and home segments. In contrast, Acme United focuses on specialized cutting, safety, and first aid products with niche market penetration. This analysis aims to identify which business model delivers superior risk-adjusted returns for a balanced portfolio.
Table of contents
Companies Overview
Helen of Troy Limited and Acme United Corporation hold significant roles in the household and personal products market, each commanding unique niches.
Helen of Troy Limited: Diverse Consumer Products Powerhouse
Helen of Troy Limited stands as a global consumer products leader with diverse segments in Home & Outdoor, Health & Wellness, and Beauty. It generates revenue through an extensive portfolio including hydration gear, health monitors, and beauty tools. In 2026, the company focuses on expanding product innovation and broadening international distribution to strengthen its market footprint.
Acme United Corporation: Specialty Cutting and Safety Tools Expert
Acme United Corporation excels as a specialized supplier of cutting, safety, and first aid products across multiple markets including school, office, and industrial sectors. It drives revenue by selling branded tools and safety kits directly and through distributors. Strategic efforts in 2026 prioritize enhancing product lines and deepening penetration in niche markets such as tactical and fishing tools.
Strategic Collision: Similarities & Divergences
Both companies operate within the consumer defensive sector but diverge in business focus: Helen of Troy pursues broad product diversification, while Acme United emphasizes specialized tool and safety solutions. Their competitive battleground centers on brand recognition and distribution channels. Helen’s scale contrasts with Acme’s niche expertise, creating distinct investment profiles shaped by diversification versus focused market penetration.
Income Statement Comparison
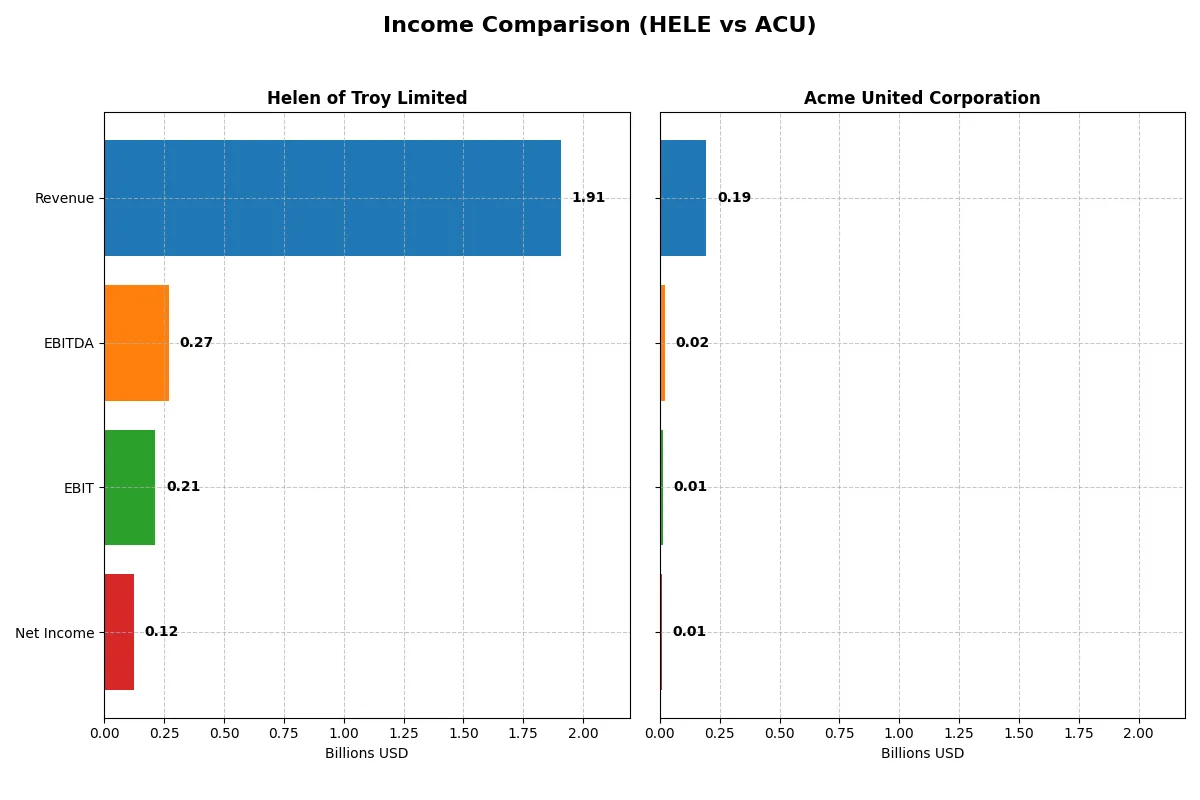
This data dissects the core profitability and scalability of both corporate engines to reveal who dominates the bottom line:
| Metric | Helen of Troy Limited (HELE) | Acme United Corporation (ACU) |
|---|---|---|
| Revenue | 1.91B | 194.5M |
| Cost of Revenue | 993.3M | 118.1M |
| Operating Expenses | 772M | 62.2M |
| Gross Profit | 914.4M | 76.4M |
| EBITDA | 269M | 20.4M |
| EBIT | 214M | 14.4M |
| Interest Expense | 51.9M | 2.1M |
| Net Income | 124M | 10M |
| EPS | 5.38 | 2.71 |
| Fiscal Year | 2025 | 2024 |
Income Statement Analysis: The Bottom-Line Duel
The income statement comparison reveals which company runs a more efficient, profitable business engine amid shifting revenue and margin dynamics.
Helen of Troy Limited Analysis
Helen of Troy’s revenue declined from 2.22B in 2022 to 1.91B in 2025, with net income falling sharply from 224M to 124M. Gross margin remains healthy near 48%, but net margin dropped to 6.5%, signaling margin compression and weakening profitability. The latest fiscal year shows deteriorating momentum with a 4.9% revenue drop and a 23.6% EPS decline.
Acme United Corporation Analysis
Acme United’s revenue grew modestly from 164M in 2020 to 194M in 2024, while net income rose from 8.1M to 10M despite a recent dip. Gross margin stands at 39%, lower than Helen’s, but net margin remains solid at 5.15%. The company faces a 44% EBIT and net margin contraction year-over-year but shows positive overall growth trends across the past five years.
Verdict: Margin Resilience vs. Growth Stability
Helen of Troy dominates in margin quality but suffers from steady declines in revenue and net income, highlighting margin erosion risks. Acme United offers slower margin expansion but posts consistent revenue and net income growth over five years. For investors prioritizing stable growth and improving earnings, Acme’s profile appears more attractive despite its lower margin base.
Financial Ratios Comparison
These vital ratios act as a diagnostic tool to expose the underlying fiscal health, valuation premiums, and capital efficiency of the companies compared below:
| Ratios | Helen of Troy Limited (HELE) | Acme United Corporation (ACU) |
|---|---|---|
| ROE | 7.35% | 9.37% |
| ROIC | 5.34% | 8.16% |
| P/E | 10.25 | 13.78 |
| P/B | 0.75 | 1.29 |
| Current Ratio | 2.00 | 4.17 |
| Quick Ratio | 1.03 | 1.71 |
| D/E | 0.57 | 0.31 |
| Debt-to-Assets | 30.5% | 20.3% |
| Interest Coverage | 2.75 | 6.79 |
| Asset Turnover | 0.61 | 1.20 |
| Fixed Asset Turnover | 5.23 | 5.33 |
| Payout ratio | 0% | 22.2% |
| Dividend yield | 0% | 1.61% |
| Fiscal Year | 2025 | 2024 |
Efficiency & Valuation Duel: The Vital Signs
Ratios act as the company’s DNA, exposing hidden risks and operational excellence critical for assessing investment quality.
Helen of Troy Limited
Helen of Troy shows moderate profitability with a 7.35% ROE, slightly below ideal levels, and net margin at 6.49%. Its valuation remains attractive, with a P/E of 10.25 and P/B at 0.75, signaling an efficient price. The company returns no dividend, indicating a reinvestment focus on growth and R&D.
Acme United Corporation
Acme United reports a higher ROE at 9.37% but with a slightly stretched P/E of 13.78 and P/B at 1.29. Its net margin is moderate at 5.15%. The firm pays a modest 1.61% dividend yield, balancing shareholder returns with operational efficiency and prudent capital allocation.
Valuation Efficiency vs. Capital Return Balance
Helen of Troy offers a more favorable valuation and operational efficiency, while Acme United delivers better returns through dividends and stronger asset turnover. Investors seeking valuation leverage may prefer Helen; those valuing steady income and efficiency might lean toward Acme.
Which one offers the Superior Shareholder Reward?
Helen of Troy (HELE) pays no dividends, focusing on reinvestment and maintaining a steady free cash flow of ~3.6/share in 2025. It lacks buybacks, signaling a growth-first approach. Acme United (ACU) delivers a 1.6% dividend yield with a modest 22% payout ratio and actively repurchases shares, boosting total shareholder return. ACU’s buybacks and consistent dividends suggest a balanced distribution strategy. HELE’s reinvestment could fuel growth but risks shareholder impatience. For 2026, I favor ACU’s more sustainable, shareholder-friendly model that blends income and capital return, outperforming HELE’s zero-yield stance.
Comparative Score Analysis: The Strategic Profile
The radar chart reveals the fundamental DNA and trade-offs of Helen of Troy Limited and Acme United Corporation:
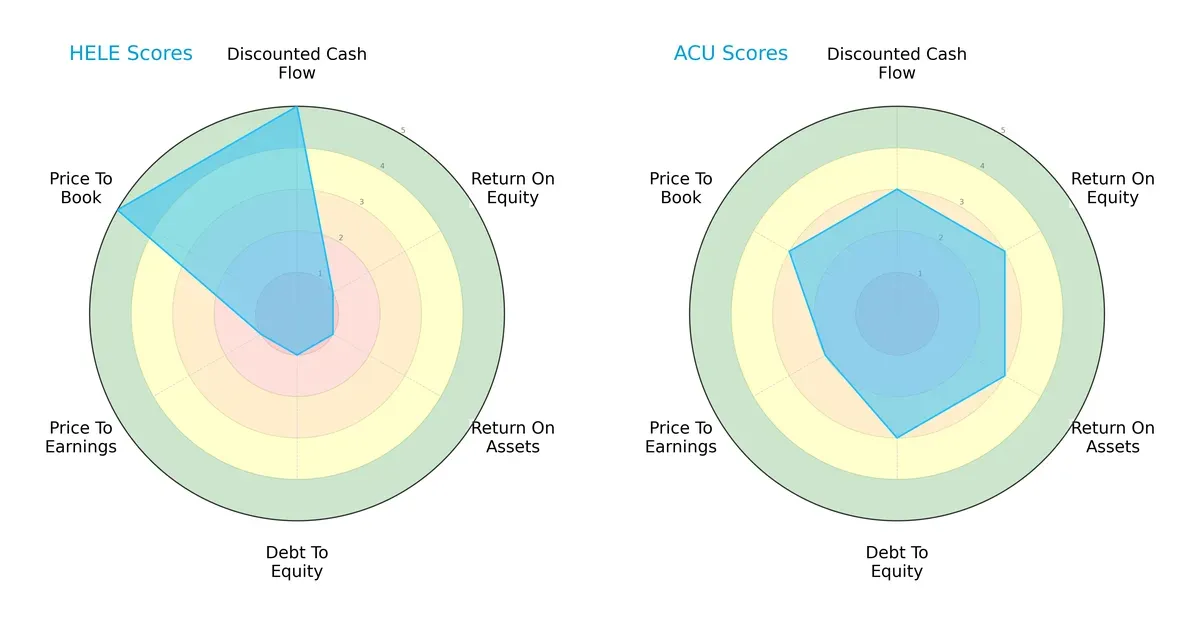
Helen of Troy excels in discounted cash flow and price-to-book valuation, highlighting strong cash generation and asset value. Acme United offers a more balanced profile, with moderate scores across ROE, ROA, debt-to-equity, and valuation metrics. Helen of Troy relies heavily on valuation edges but suffers from weak profitability and leverage scores. Acme United’s steady performance suggests more sustainable financial health.
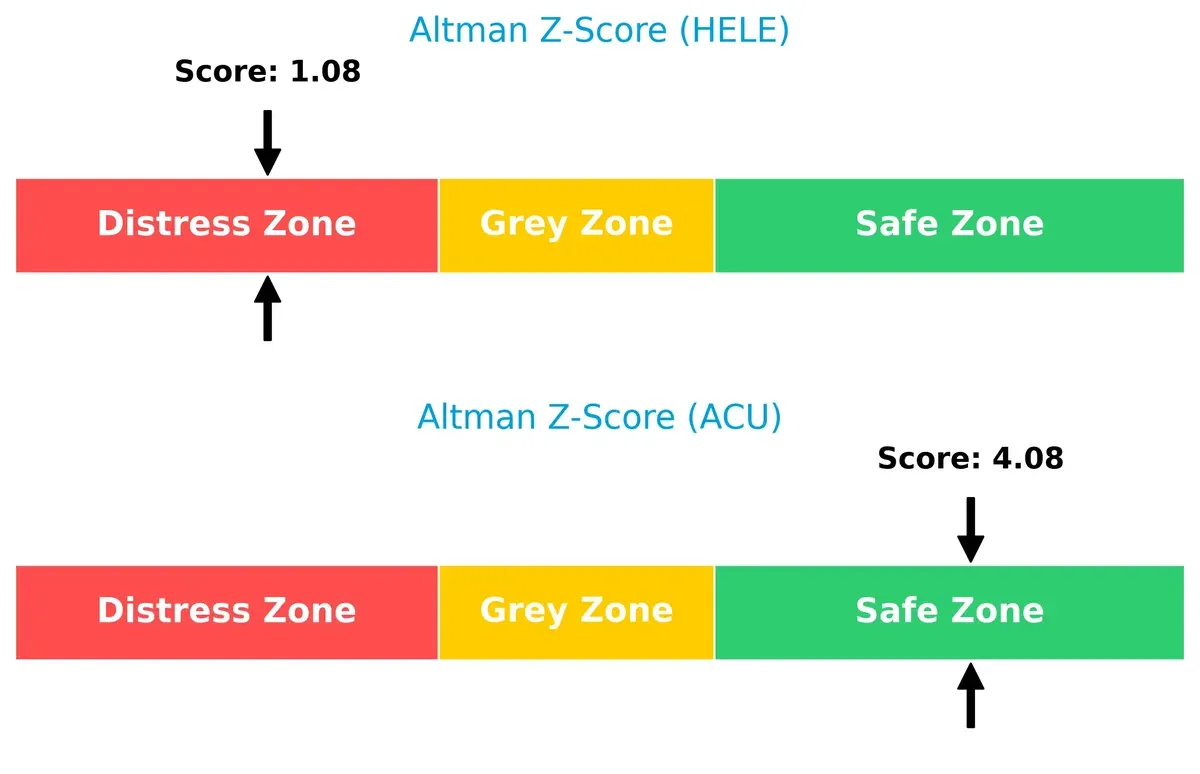
Bankruptcy Risk: Solvency Showdown
Acme United’s Altman Z-Score of 4.08 places it firmly in the safe zone, indicating strong long-term survival prospects. Helen of Troy’s 1.08 score flags distress risk, signaling potential solvency challenges in this market cycle:
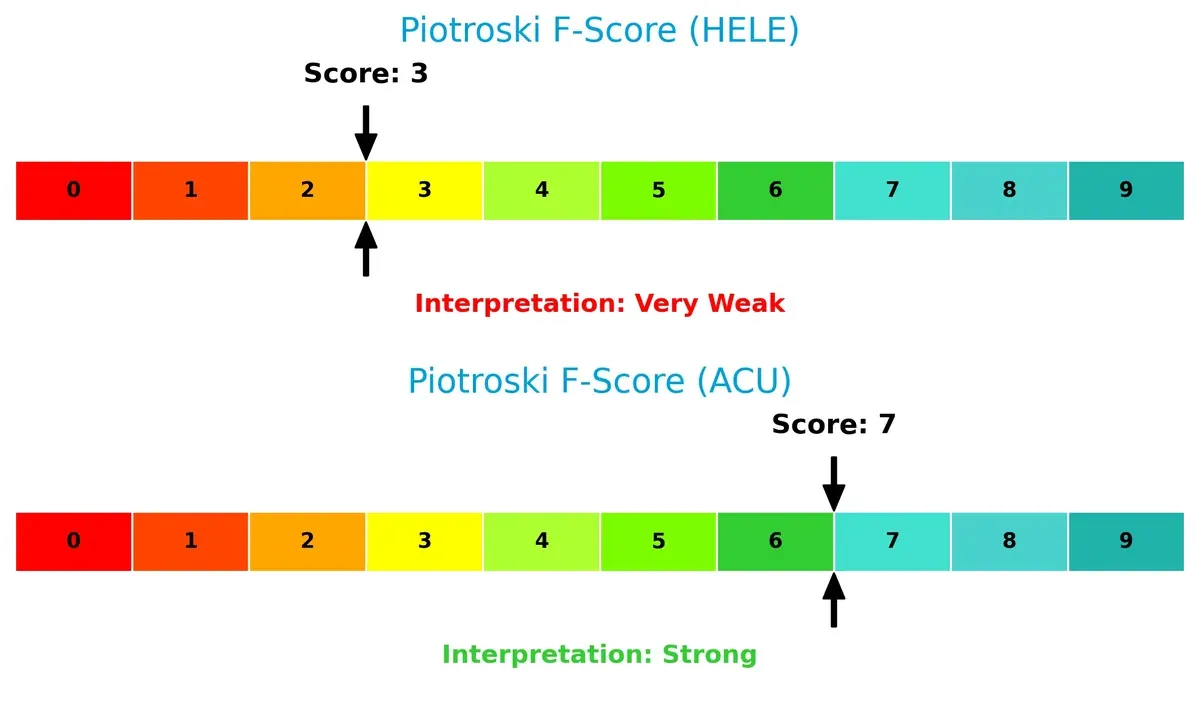
Financial Health: Quality of Operations
Acme United’s Piotroski F-Score of 7 signals robust operational quality and financial strength. Helen of Troy’s score of 3 raises red flags on internal metrics, indicating weaker financial health and operational concerns:
How are the two companies positioned?
This section dissects Helen of Troy and Acme United’s operational DNA by comparing revenue distribution and internal dynamics. The goal is to confront their economic moats and identify which model delivers the most resilient competitive advantage today.
Revenue Segmentation: The Strategic Mix
This visual comparison dissects how Helen of Troy Limited and Acme United Corporation diversify income streams and reveals their primary sector bets:
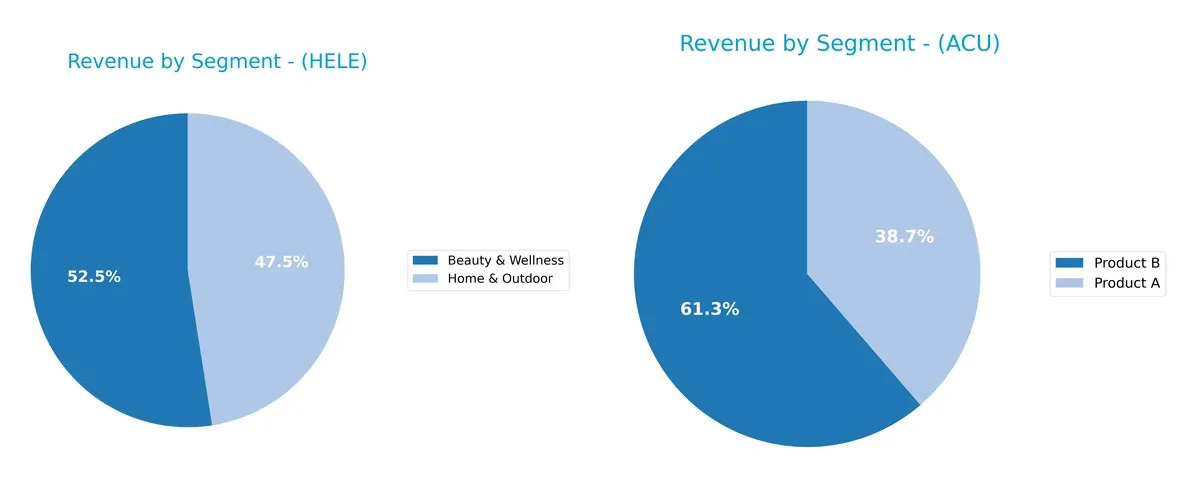
Helen of Troy generates $1.0B from Beauty & Wellness and $906M from Home & Outdoor, showing a balanced two-segment focus. Acme United pivots primarily on Product B with $119M, dwarfing Product A’s $75M, indicating a less diversified revenue base. Helen’s dual-segment mix reduces concentration risk, while Acme’s dependency on one product elevates vulnerability but may reflect strong niche dominance.
Strengths and Weaknesses Comparison
This table compares the Strengths and Weaknesses of Helen of Troy Limited and Acme United Corporation:
Helen of Troy Limited Strengths
- Diversified product lines in Beauty & Wellness and Home & Outdoor
- Strong U.S. market presence with 1.36B revenue
- Favorable fixed asset turnover at 5.23
- Solid liquidity ratios: current ratio 2.0 and quick ratio 1.03
Acme United Corporation Strengths
- Favorable debt-to-equity at 0.31 and interest coverage of 6.9
- Higher asset turnover at 1.2 supports efficiency
- Favorable PE and PB ratios indicate market confidence
- Geographic diversification across U.S., Canada, and Europe
Helen of Troy Limited Weaknesses
- ROE at 7.35% rated unfavorable
- No dividend yield limits income for investors
- Moderate leverage with debt-to-assets at 30.55%
- Net margin and ROIC only neutral, indicating modest profitability
Acme United Corporation Weaknesses
- Current ratio at 4.17 considered unfavorable, may indicate excess liquidity
- ROE also unfavorable at 9.37%
- Less product line diversification, mainly two products
- Smaller scale revenues compared to Helen of Troy
Helen of Troy shows strength in product and geographic diversification with solid liquidity but faces challenges in profitability metrics. Acme United excels in asset efficiency and leverage management but has less diversification and liquidity concerns. These factors shape each company’s strategic focus in balancing growth and financial health.
The Moat Duel: Analyzing Competitive Defensibility
A structural moat is the sole shield protecting long-term profits from relentless competition and market pressures:
Helen of Troy Limited: Diverse Brand Portfolio with Intangible Asset Moat
Helen of Troy leverages strong brand recognition and diversified consumer products. Its moat shows in stable gross margins near 48%, despite recent earnings declines. Expansion into health and outdoor markets could deepen its intangible asset moat in 2026, but shrinking ROIC warns of strategic challenges.
Acme United Corporation: Niche Product Cost Advantage
Acme United benefits from a focused product line in cutting and safety tools, supporting a lean cost advantage. Its 39% gross margin and positive revenue growth reflect efficient capital use. While ROIC trends slightly down, ongoing innovation in first aid and industrial markets offers growth potential.
Intangible Brand Strength vs. Cost Efficiency: Who Defends Better?
Helen of Troy’s wider product portfolio offers broader market coverage but suffers from declining profitability and value destruction. Acme United’s narrower moat is more cost-driven but maintains value creation and growth. I view Acme United as better positioned to defend market share amid evolving consumer demands.
Which stock offers better returns?
The past year shows starkly contrasting price movements and trading dynamics between Helen of Troy Limited and Acme United Corporation.
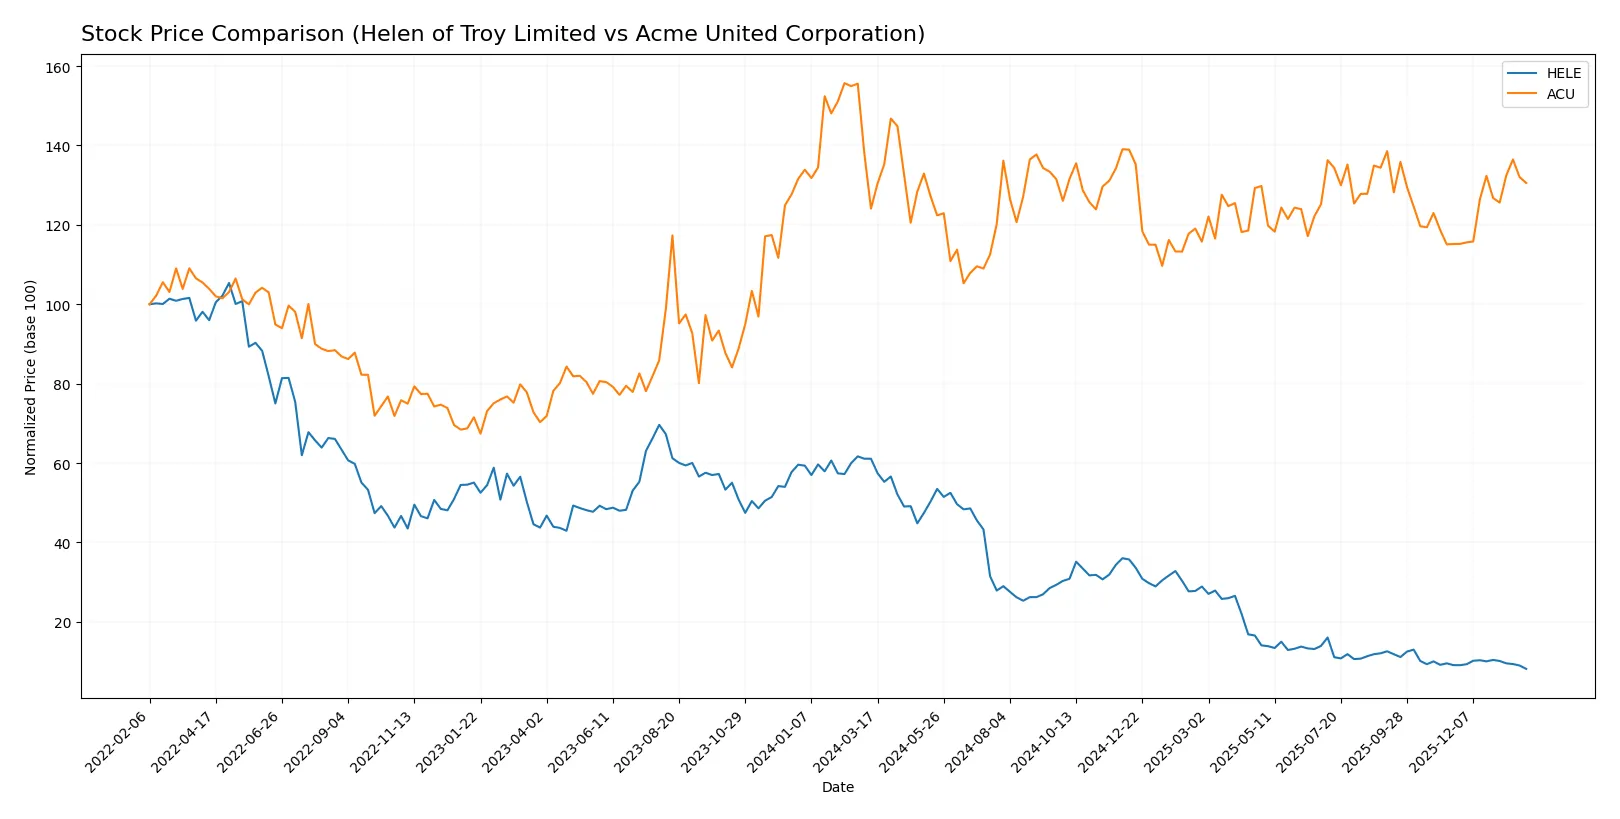
Trend Comparison
Helen of Troy Limited’s stock has declined sharply by 86.68% over the past year, marking a bearish trend with accelerating losses and a wide price range between $16.56 and $124.36.
Acme United Corporation’s stock gained 5.21% over the same period, reflecting a bullish and accelerating trend supported by a moderate price range from $33.7 to $46.99.
Comparing the two, Acme United outperformed Helen of Troy significantly, delivering the highest market performance with steady gains amid contrasting volume trends.
Target Prices
Helen of Troy Limited shows a clear target consensus from analysts.
| Company | Target Low | Target High | Consensus |
|---|---|---|---|
| Helen of Troy Limited | 22 | 22 | 22 |
Helen of Troy’s consensus target of 22 suggests a 33% upside from the current 16.56 price, signaling moderate analyst optimism. No verified target price data is available for Acme United Corporation.

Don’t Let Luck Decide Your Entry Point
Optimize your entry points with our advanced ProRealTime indicators. You’ll get efficient buy signals with precise price targets for maximum performance. Start outperforming now!
How do institutions grade them?
The following presents the latest institutional grade data for Helen of Troy Limited and Acme United Corporation:
Helen of Troy Limited Grades
This table summarizes recent grades issued by reputable financial institutions for Helen of Troy Limited.
| Grading Company | Action | New Grade | Date |
|---|---|---|---|
| Canaccord Genuity | Maintain | Hold | 2026-01-09 |
| UBS | Maintain | Neutral | 2026-01-09 |
| Canaccord Genuity | Maintain | Hold | 2026-01-06 |
| Canaccord Genuity | Maintain | Hold | 2025-10-10 |
| UBS | Maintain | Neutral | 2025-10-10 |
| UBS | Maintain | Neutral | 2025-10-02 |
| UBS | Maintain | Neutral | 2025-07-11 |
| Canaccord Genuity | Downgrade | Hold | 2025-07-11 |
| Canaccord Genuity | Maintain | Buy | 2025-07-07 |
| Canaccord Genuity | Maintain | Buy | 2025-04-25 |
Acme United Corporation Grades
This table shows the only available institutional grade for Acme United Corporation.
| Grading Company | Action | New Grade | Date |
|---|---|---|---|
| DA Davidson | Maintain | Buy | 2016-07-01 |
Which company has the best grades?
Helen of Troy Limited holds consistent Hold/Neutral grades from recent top-tier firms, while Acme United’s sole grade from 2016 is a Buy. Helen of Troy’s fresh, cautious stance may reflect current market realities, whereas Acme’s outdated Buy rating offers limited insight for investors.
Risks specific to each company
The following categories identify the critical pressure points and systemic threats facing both firms in the 2026 market environment:
1. Market & Competition
Helen of Troy Limited
- Faces intense competition in consumer products across multiple segments and geographies, risking margin pressure.
Acme United Corporation
- Operates in niche markets with strong brand loyalty but limited scale compared to larger peers.
2. Capital Structure & Debt
Helen of Troy Limited
- Moderate leverage with debt-to-assets at 30.55%, interest coverage neutral at 4.11x; manageable but watchful.
Acme United Corporation
- Lower leverage at 20.25%, strong interest coverage at 6.9x; financially conservative with ample buffer.
3. Stock Volatility
Helen of Troy Limited
- Beta of 0.78 indicates moderate volatility, with a wide historical price range suggesting episodic swings.
Acme United Corporation
- Slightly lower beta at 0.74, showing marginally less volatility and more stable price movements.
4. Regulatory & Legal
Helen of Troy Limited
- Exposure to regulatory scrutiny in multiple regions, especially in health and wellness product segments.
Acme United Corporation
- Regulatory risk is moderate, mostly related to safety standards and product compliance in diverse markets.
5. Supply Chain & Operations
Helen of Troy Limited
- Complex global supply chains across many product lines create vulnerability to disruptions and cost inflation.
Acme United Corporation
- More focused product range with simpler supply chains, reducing operational risk from disruptions.
6. ESG & Climate Transition
Helen of Troy Limited
- Increasing pressure to improve sustainability in manufacturing and packaging; ESG compliance costs rising.
Acme United Corporation
- Faces ESG challenges mainly in sourcing and waste management but benefits from smaller operational footprint.
7. Geopolitical Exposure
Helen of Troy Limited
- Significant international footprint exposes it to currency fluctuations and geopolitical tensions.
Acme United Corporation
- Limited global exposure reduces risk from geopolitical instability and foreign exchange volatility.
Which company shows a better risk-adjusted profile?
Helen of Troy’s most critical risk is its complex global supply chain and geopolitical exposure, which could impact margins and operations. Acme United faces its largest challenge in market competition and regulatory compliance but maintains a more conservative capital structure and stronger financial scores. Acme United’s Altman Z-Score in the safe zone and stronger Piotroski Score indicate superior financial resilience. Meanwhile, Helen of Troy’s distress-zone Z-Score and weak Piotroski Score signal elevated bankruptcy risk. Acme United’s lower leverage, stable stock volatility, and focused operations create a better risk-adjusted profile overall, supported by its recent consistent dividend payouts and higher interest coverage ratio.
Final Verdict: Which stock to choose?
Helen of Troy Limited shines with its operational efficiency and strong asset turnover, demonstrating a cash machine quality in a tough market. However, its declining profitability and value destruction call for vigilance. It could suit investors with an appetite for aggressive growth despite recent setbacks.
Acme United Corporation offers a more resilient profile, anchored by a strategic moat in asset efficiency and better financial stability. Its moderate growth and safer balance sheet make it a fit for investors favoring growth at a reasonable price, balancing risk and reward with more confidence.
If you prioritize aggressive growth and can tolerate value erosion risks, Helen of Troy might be the compelling choice due to its operational leverage. However, if you seek steadier growth with superior financial stability, Acme United outshines as the safer investment option with a more favorable risk-return profile.
Disclaimer: Investment carries a risk of loss of initial capital. The past performance is not a reliable indicator of future results. Be sure to understand risks before making an investment decision.
Go Further
I encourage you to read the complete analyses of Helen of Troy Limited and Acme United Corporation to enhance your investment decisions: