Home > Comparison > Consumer Defensive > ELF vs ACU
The strategic rivalry between e.l.f. Beauty, Inc. and Acme United Corporation shapes the consumer defensive sector’s competitive landscape. e.l.f. Beauty operates as a fast-growing cosmetics and skincare brand focused on direct-to-consumer channels. In contrast, Acme United delivers a diversified portfolio of first aid and cutting products through wholesale and retail distributors. This analysis will determine which operational model presents a superior risk-adjusted return for a diversified investment portfolio.
Table of contents
Companies Overview
The battle for dominance in household and personal products features e.l.f. Beauty and Acme United as key players shaping the sector’s future.
e.l.f. Beauty, Inc.: Innovative Cosmetics Specialist
e.l.f. Beauty leads as a cosmetics and skincare provider with a global footprint. Its core revenue comes from selling branded products like e.l.f. Cosmetics and Keys Soulcare through retailers and direct e-commerce. In 2026, the company focuses sharply on expanding its digital sales channels and international distribution to capture growing consumer demand.
Acme United Corporation: Diverse Safety and Cutting Tools Provider
Acme United stands out as a supplier of first aid, cutting, and safety products, serving diverse markets including school and industrial sectors. Its revenue engine is a broad portfolio of brands like Westcott and Camillus sold through wholesale and retail channels. In 2026, Acme prioritizes product innovation and expanding its presence in e-commerce and international markets.
Strategic Collision: Similarities & Divergences
Both firms operate in consumer defensive staples but diverge in focus; e.l.f. invests in a branded beauty ecosystem while Acme United leverages a multi-brand industrial and safety portfolio. They compete primarily in expanding direct-to-consumer sales and international reach. Their distinct market approaches create different risk and growth profiles for investors evaluating exposure in household and personal products.
Income Statement Comparison
This data dissects the core profitability and scalability of both corporate engines to reveal who dominates the bottom line:
| Metric | e.l.f. Beauty, Inc. (ELF) | Acme United Corporation (ACU) |
|---|---|---|
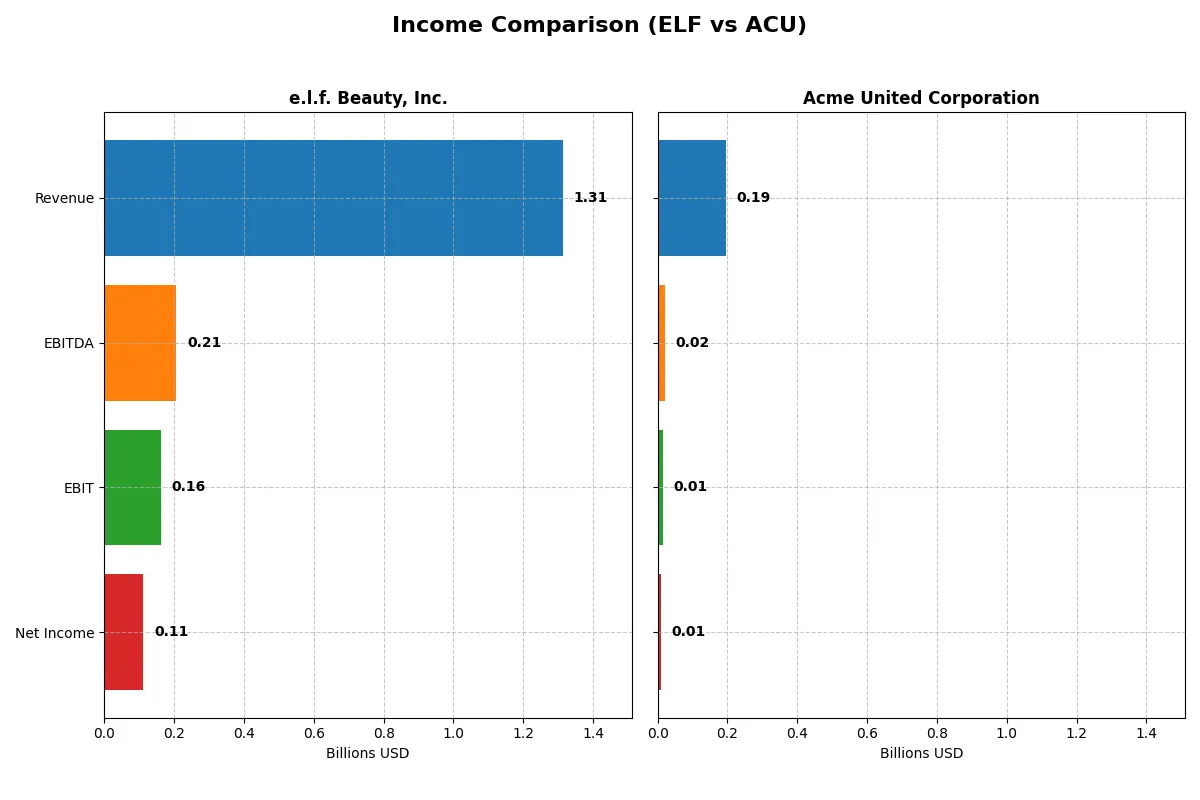
| Revenue | 1.31B | 194.5M |
| Cost of Revenue | 378M | 118.1M |
| Operating Expenses | 778M | 62.2M |
| Gross Profit | 936M | 76.4M |
| EBITDA | 206M | 20.4M |
| EBIT | 162M | 14.4M |
| Interest Expense | 17.2M | 2.1M |
| Net Income | 112M | 10.0M |
| EPS | 1.99 | 2.71 |
| Fiscal Year | 2025 | 2024 |
Income Statement Analysis: The Bottom-Line Duel
This income statement comparison exposes the true operational efficiency behind each company’s financial engine over recent years.
e.l.f. Beauty, Inc. Analysis
e.l.f. Beauty’s revenue surged from $318M in 2021 to $1.31B in 2025, reflecting a robust 313% growth. Net income exploded by nearly 1700%, reaching $112M in 2025. The company sustains strong margins, with a 71.2% gross margin and 8.5% net margin in 2025, though net margin dipped year-over-year. Efficiency gains slowed, but momentum remains solid.
Acme United Corporation Analysis
Acme’s revenue grew modestly from $164M in 2020 to $194M in 2024, an 18.6% increase. Net income rose 24%, reaching $10M in 2024. Gross margin at 39.3% is healthy but far below e.l.f.’s, and EBIT margin is neutral at 7.4%. Recent results show a sharp decline in EBIT and net margin, signaling operational pressure despite steady top-line growth.
Margin Strength vs. Growth Dynamism
e.l.f. Beauty dominates with explosive revenue and net income growth, supported by superior margins and scale. Acme United offers stability but shows weaker profitability and declining margins recently. Investors seeking growth and margin expansion find e.l.f.’s profile more compelling, while Acme suits those favoring steadier but slower progress.
Financial Ratios Comparison
These vital ratios act as a diagnostic tool to expose underlying fiscal health, valuation premiums, and capital efficiency for e.l.f. Beauty, Inc. and Acme United Corporation:
| Ratios | e.l.f. Beauty, Inc. (ELF) | Acme United Corporation (ACU) |
|---|---|---|
| ROE | 14.7% | 9.4% |
| ROIC | 11.2% | 8.2% |
| P/E | 31.5 | 13.8 |
| P/B | 4.64 | 1.29 |
| Current Ratio | 3.05 | 4.17 |
| Quick Ratio | 2.00 | 1.71 |
| D/E | 0.41 | 0.31 |
| Debt-to-Assets | 25.1% | 20.3% |
| Interest Coverage | 9.2 | 6.8 |
| Asset Turnover | 1.05 | 1.20 |
| Fixed Asset Turnover | 45.6 | 5.33 |
| Payout Ratio | 0% | 22.2% |
| Dividend Yield | 0% | 1.61% |
| Fiscal Year | 2025 | 2024 |
Efficiency & Valuation Duel: The Vital Signs
Ratios act as a company’s DNA, exposing hidden risks and operational excellence crucial for investors’ decision-making.
e.l.f. Beauty, Inc.
e.l.f. shows a moderate 14.7% ROE and an 8.5% net margin, indicating decent profitability. However, its P/E of 31.5 and P/B of 4.64 mark the stock as stretched. The company pays no dividend, focusing instead on reinvestment, but its unfavorable ROIC versus WACC raises caution about capital efficiency.
Acme United Corporation
Acme United posts a lower 9.4% ROE and 5.15% net margin but trades at a more attractive P/E of 13.8 and P/B of 1.29, signaling reasonable valuation. It offers a 1.6% dividend yield, balancing shareholder returns with stable profitability. Its ROIC sits comfortably above WACC, reflecting efficient capital allocation.
Balanced Growth vs. Value Discipline
Acme United offers a healthier risk-reward profile with reasonable valuation and efficient capital use. e.l.f. demands premium pricing despite weaker capital returns, fitting growth-focused investors. Value-oriented investors may prefer Acme’s combination of dividends and operational discipline.
Which one offers the Superior Shareholder Reward?
e.l.f. Beauty (ELF) pays no dividends but reinvests heavily in growth and innovation, evident from its high free cash flow per share (~$2.05) and zero payout ratio. Acme United (ACU) offers a modest 1.6% dividend yield with a payout ratio around 22%, combined with a steady buyback program. ELF’s aggressive reinvestment fuels scalable margins (EBIT margin 12.3%), but trades at a lofty P/E of ~31.5 versus ACU’s more reasonable 13.8. ACU’s distribution is more balanced, with dividends and buybacks sustained by solid free cash flow (~$1.3B) and conservative leverage. I find ACU’s shareholder reward more sustainable and attractive for 2026, blending income and capital return without overpaying growth premium.
Comparative Score Analysis: The Strategic Profile
The radar chart reveals the fundamental DNA and trade-offs of e.l.f. Beauty, Inc. and Acme United Corporation, highlighting their financial strengths and valuation discipline:
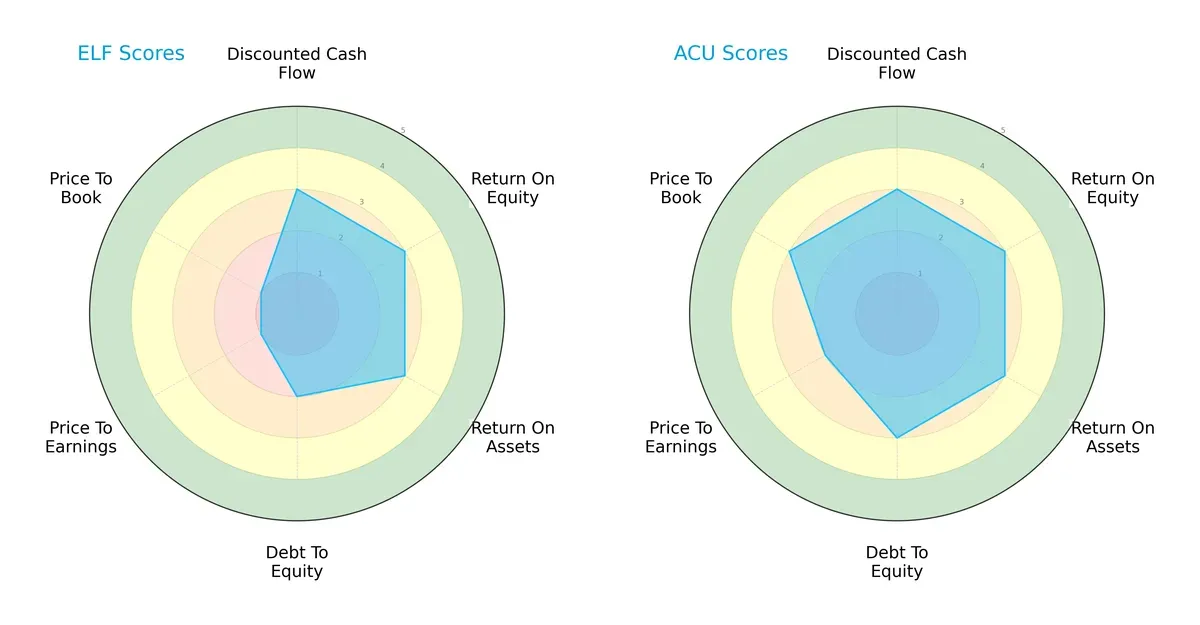
Both companies show parity in Discounted Cash Flow, Return on Equity, and Return on Assets scores, indicating similar operational efficiency and cash flow expectations. Acme United holds an edge with a stronger Debt/Equity profile and more attractive valuation metrics (PE and PB scores). e.l.f. Beauty leans heavily on operational returns but suffers from stretched valuation multiples, suggesting Acme United has a more balanced financial profile.
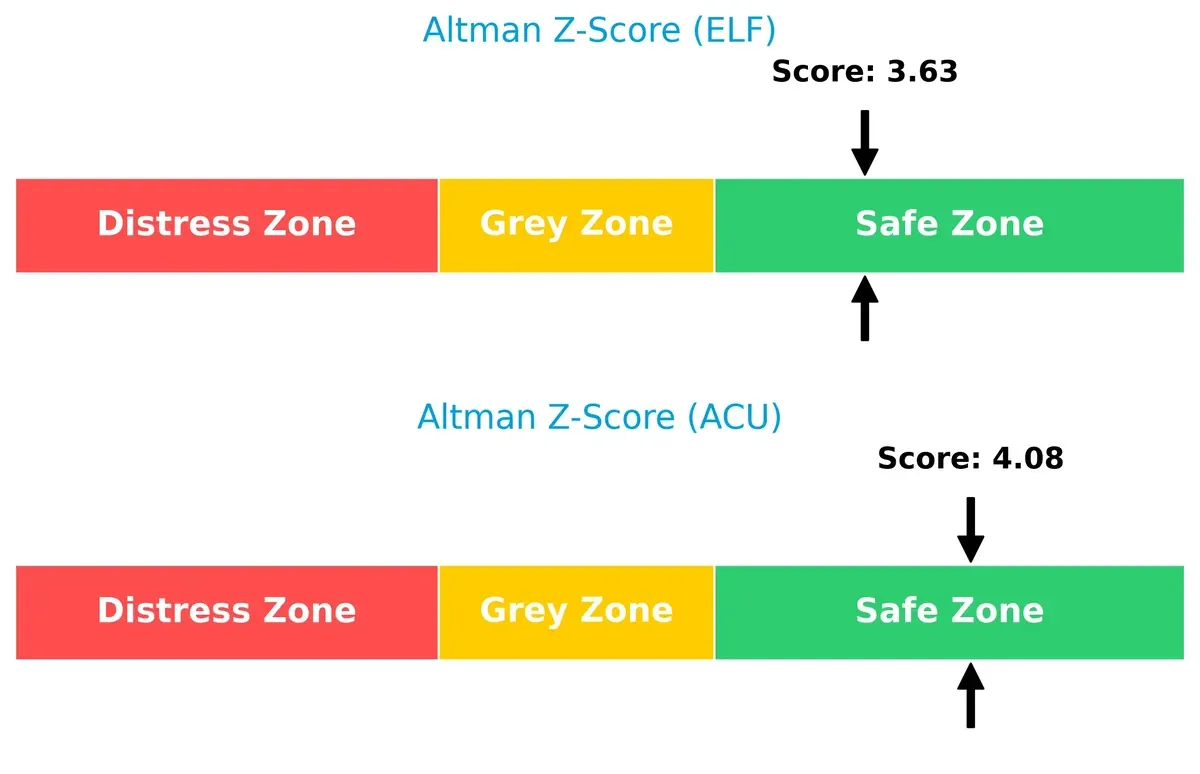
Bankruptcy Risk: Solvency Showdown
The Altman Z-Score gap suggests Acme United maintains a safer solvency position than e.l.f. Beauty, signaling a stronger buffer against financial distress in this cycle:
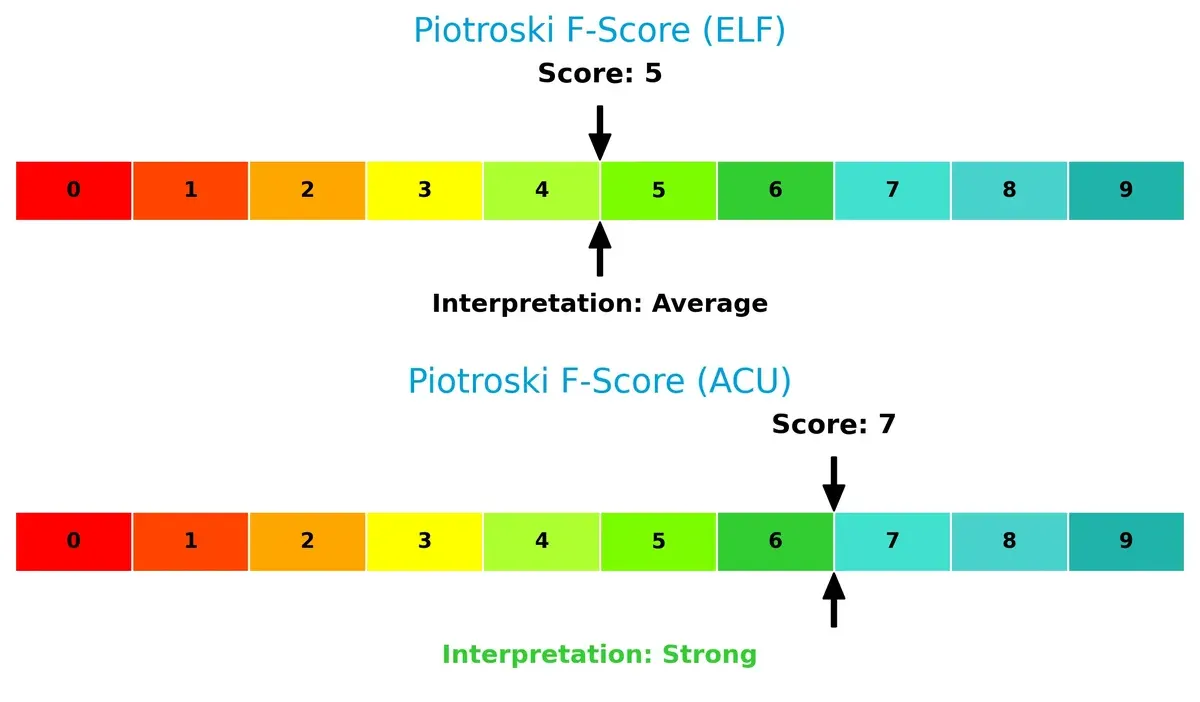
Financial Health: Quality of Operations
Acme United’s Piotroski F-Score of 7 versus e.l.f. Beauty’s 5 signals superior financial health and operational robustness. e.l.f. displays some red flags in internal metrics compared to Acme United’s stronger quality signals:
How are the two companies positioned?
This section dissects ELF and ACU’s operational DNA by comparing revenue distribution and internal dynamics—strengths and weaknesses. The final objective confronts their economic moats to reveal which model offers the most resilient, sustainable advantage today.
Revenue Segmentation: The Strategic Mix
This comparison dissects how e.l.f. Beauty and Acme United diversify their income streams and where their primary sector bets lie:
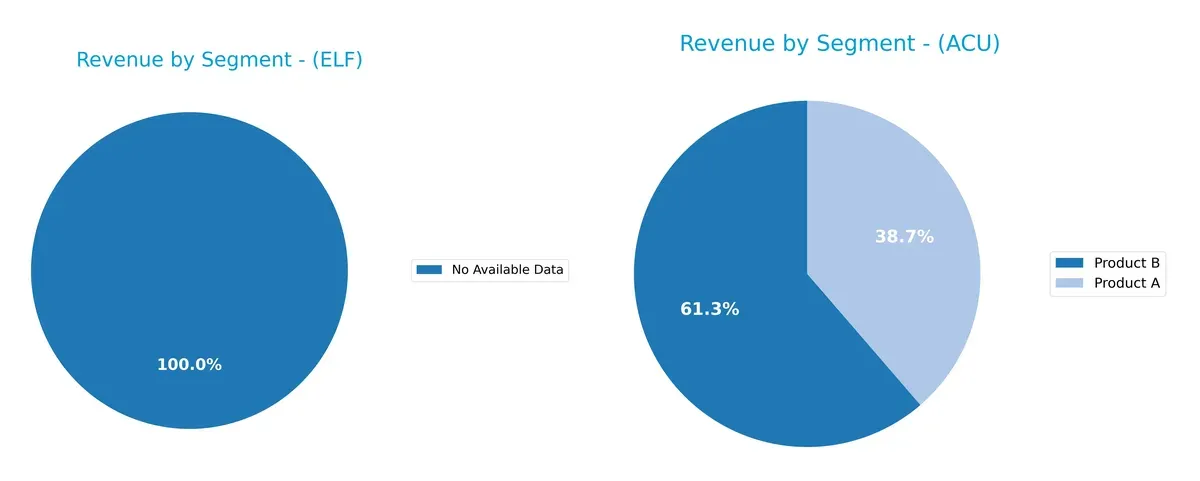
Acme United displays a clear product-based revenue split, with Product B anchoring $119M in 2024, nearly doubling Product A’s $75M. This mix signals a moderate diversification across product categories. e.l.f. Beauty lacks segment data, preventing a direct comparison. Acme’s reliance on two main products suggests focused innovation but poses concentration risk if demand shifts. The dual-product strategy, however, supports resilience against market volatility within its niche.
Strengths and Weaknesses Comparison
This table compares the Strengths and Weaknesses of e.l.f. Beauty, Inc. and Acme United Corporation:
e.l.f. Beauty Strengths
- Strong U.S. and growing non-U.S. revenue base
- Favorable quick ratio and low debt-to-assets ratio
- High fixed asset turnover signals operational efficiency
Acme United Strengths
- Diversified revenue streams across multiple products and regions
- Favorable WACC and valuation multiples
- Solid asset turnover and manageable debt levels
e.l.f. Beauty Weaknesses
- Unfavorable ROIC below WACC suggests weak capital returns
- High P/E and P/B ratios could indicate overvaluation
- Zero dividend yield may deter income investors
Acme United Weaknesses
- Lower profitability ratios including ROE and net margin
- Elevated current ratio may signal inefficient asset use
- Neutral dividend yield offers limited income appeal
Both companies show operational strengths but differ in capital efficiency and valuation metrics. e.l.f. Beauty’s high turnover contrasts with Acme United’s broader product and geographic diversification. Each faces specific financial risks that should influence their strategic priorities.
The Moat Duel: Analyzing Competitive Defensibility
A structural moat is the sole shield defending long-term profits from relentless competition erosion. Let’s dissect the moats of e.l.f. Beauty and Acme United:
e.l.f. Beauty, Inc.: Intangible Asset Powerhouse
e.l.f. leverages strong brand recognition and product innovation to maintain high gross margins (~71%) and stable EBIT margins (~12%). Despite currently shedding value (ROIC < WACC), its rapidly growing profitability signals moat strengthening through new market penetration and product launches in 2026.
Acme United Corporation: Cost Advantage with Niche Reach
Acme United relies on cost efficiency and diversified product lines across multiple geographies. Its moderate gross margin (~39%) and stable net margin (~5%) showcase steady operational control. However, declining ROIC and shrinking profitability warn of a weakening moat, with limited upside in expanding traditional markets.
Brand Equity vs. Cost Efficiency: The Moat Showdown
e.l.f. Beauty’s intangible assets create a deeper economic moat, fueled by innovation and margin expansion. Acme United’s cost advantage is narrower and under pressure. I see e.l.f. better equipped to defend and grow its market share in 2026.
Which stock offers better returns?
The past year shows divergent price movements: e.l.f. Beauty, Inc. experienced a sharp overall decline with recent recovery, while Acme United Corporation posted steady gains with moderate acceleration.
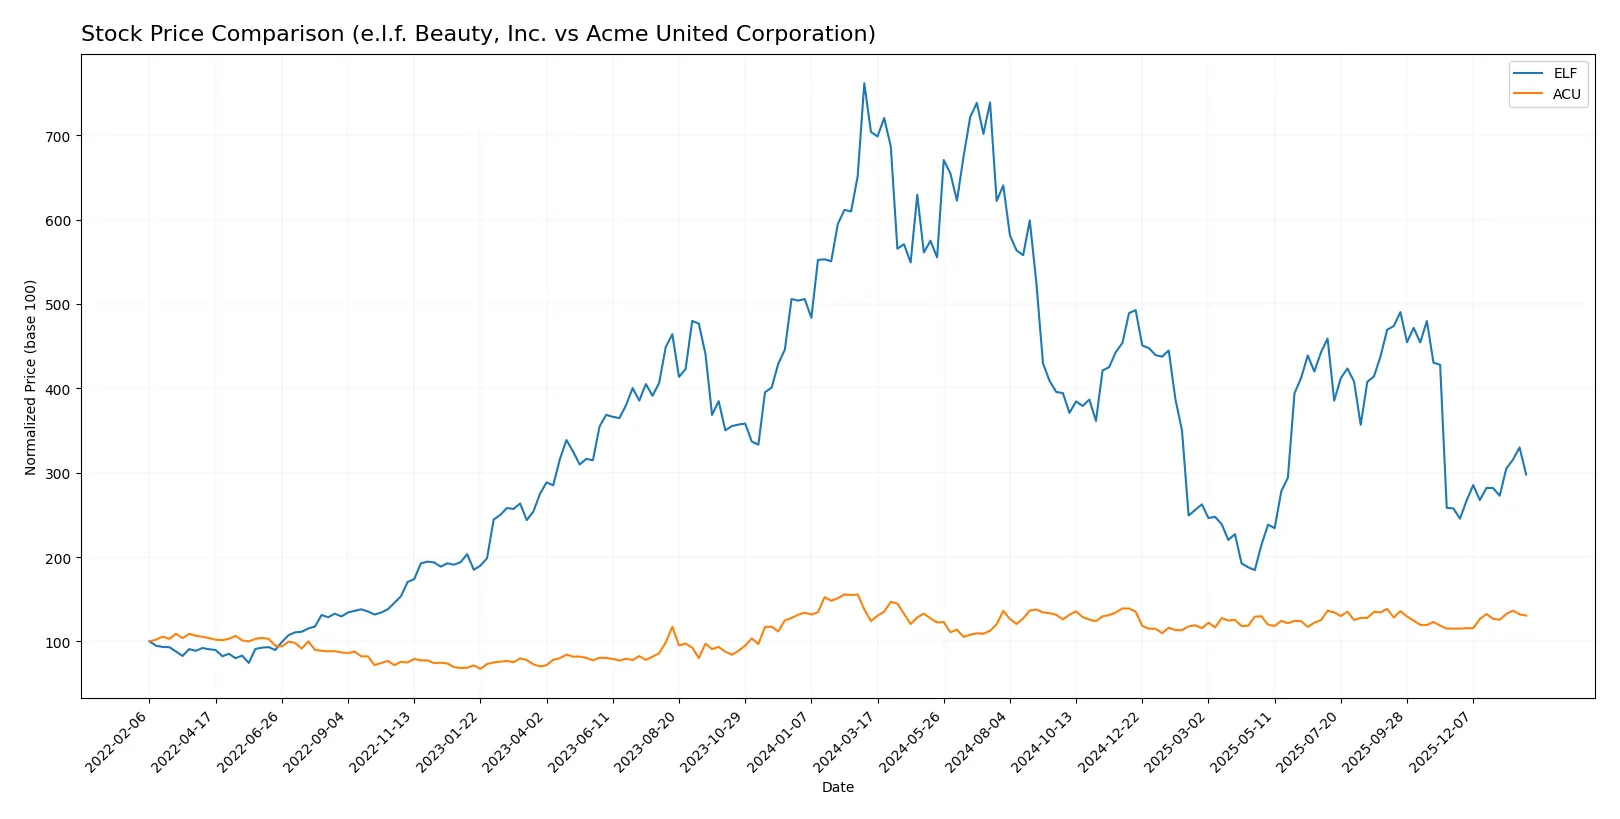
Trend Comparison
e.l.f. Beauty, Inc. stock declined 57.7% over the past 12 months, marking a bearish trend with accelerating losses and high volatility, hitting a high of 210.9 and low of 52.65.
Acme United Corporation stock gained 5.21% over the same period, reflecting a bullish trend with accelerating momentum and low volatility, ranging between 33.7 and 46.99.
Comparing both, Acme United delivered the highest market performance with a positive return and controlled volatility versus e.l.f. Beauty’s significant bearish trend.
Target Prices
Analysts present a moderate upside potential for e.l.f. Beauty, Inc. with a cautious consensus.
| Company | Target Low | Target High | Consensus |
|---|---|---|---|
| e.l.f. Beauty, Inc. | 85 | 165 | 111.83 |
The consensus target of $111.83 implies about a 31.5% upside from the current $84.99 price, reflecting confidence in e.l.f.’s growth prospects. No verified target price data is available for Acme United Corporation.

Don’t Let Luck Decide Your Entry Point
Optimize your entry points with our advanced ProRealTime indicators. You’ll get efficient buy signals with precise price targets for maximum performance. Start outperforming now!
How do institutions grade them?
Institutional grades for e.l.f. Beauty, Inc. and Acme United Corporation show recent analyst views:
e.l.f. Beauty, Inc. Grades
The latest grades from major financial institutions for e.l.f. Beauty, Inc. are:
| Grading Company | Action | New Grade | Date |
|---|---|---|---|
| TD Cowen | Maintain | Buy | 2026-01-21 |
| UBS | Maintain | Neutral | 2026-01-14 |
| Piper Sandler | Maintain | Neutral | 2025-12-22 |
| JP Morgan | Maintain | Overweight | 2025-12-18 |
| Goldman Sachs | Maintain | Buy | 2025-11-07 |
| Canaccord Genuity | Maintain | Buy | 2025-11-06 |
| Piper Sandler | Downgrade | Neutral | 2025-11-06 |
| Jefferies | Maintain | Buy | 2025-11-06 |
| JP Morgan | Maintain | Overweight | 2025-11-06 |
| UBS | Maintain | Neutral | 2025-11-06 |
Acme United Corporation Grades
The available grade for Acme United Corporation is limited:
| Grading Company | Action | New Grade | Date |
|---|---|---|---|
| DA Davidson | Maintain | Buy | 2016-07-01 |
Which company has the best grades?
e.l.f. Beauty, Inc. holds a broader range of recent grades, mostly Buy or Overweight, indicating stronger institutional confidence. Acme United’s single, older Buy rating offers less current insight, potentially increasing investor uncertainty about its near-term outlook.
Risks specific to each company
The following categories identify critical pressure points and systemic threats facing e.l.f. Beauty, Inc. and Acme United Corporation in the 2026 market environment:
1. Market & Competition
e.l.f. Beauty, Inc.
- Faces intense competition in cosmetics with pressure on pricing and innovation to maintain brand relevance.
Acme United Corporation
- Competes in a niche market for cutting and safety products with less direct pressure but limited growth prospects.
2. Capital Structure & Debt
e.l.f. Beauty, Inc.
- Maintains moderate leverage (D/E 0.41), manageable interest coverage at 9.44x, but high WACC at 11.5% signals costly capital.
Acme United Corporation
- Lower leverage (D/E 0.31) with solid interest coverage of 6.9x and a favorable WACC of 6.96%, reflecting cheaper capital costs.
3. Stock Volatility
e.l.f. Beauty, Inc.
- High beta at 1.72 indicates significant stock price volatility, increasing investment risk.
Acme United Corporation
- Low beta of 0.74 suggests relative stability and lower market risk for shareholders.
4. Regulatory & Legal
e.l.f. Beauty, Inc.
- Subject to stringent cosmetic safety and environmental regulations, with risks of product recalls or compliance costs.
Acme United Corporation
- Regulated in manufacturing and chemical safety, but less exposed to volatile regulatory shifts compared to cosmetics.
5. Supply Chain & Operations
e.l.f. Beauty, Inc.
- Global supply chain exposed to disruptions impacting raw materials and distribution in both retail and e-commerce channels.
Acme United Corporation
- Smaller scale supply chain, focused on industrial and retail clients, with moderate operational risk.
6. ESG & Climate Transition
e.l.f. Beauty, Inc.
- Faces growing investor and consumer pressure to improve sustainability and reduce carbon footprint.
Acme United Corporation
- ESG initiatives less pronounced but emerging focus on safer, environmentally friendly products and practices.
7. Geopolitical Exposure
e.l.f. Beauty, Inc.
- Significant international sales expose it to currency fluctuations and geopolitical tensions affecting global trade.
Acme United Corporation
- Primarily North American market focus limits geopolitical risks but still susceptible to trade policy changes.
Which company shows a better risk-adjusted profile?
Acme United faces less market volatility and benefits from a stronger capital structure with lower WACC. e.l.f. Beauty wrestles with higher leverage costs and competitive intensity. Acme’s safer beta and favorable financial ratios suggest a more balanced risk-adjusted profile. Notably, e.l.f.’s beta of 1.72 signals elevated stock price swings, increasing risk in uncertain markets.
Final Verdict: Which stock to choose?
e.l.f. Beauty, Inc. wields a potent growth engine fueled by strong revenue expansion and improving profitability. Its core strength lies in operational efficiency and brand momentum. A point of vigilance is its stretched valuation and mixed capital returns, which may pressure future gains. It suits investors targeting aggressive growth with tolerance for volatility.
Acme United Corporation stands out with a solid value moat anchored in steady cash flow and conservative capital structure. Its lower valuation multiples and robust liquidity offer a safer harbor in turbulent markets compared to e.l.f. This stock fits portfolios seeking GARP—growth balanced with reasonable price and financial stability.
If you prioritize rapid expansion and can withstand valuation swings, e.l.f. Beauty offers compelling upside through its operational momentum. However, if you seek steadier returns with less risk, Acme United provides better stability and attractive valuation metrics. Each represents a distinct investor profile navigating growth versus value trade-offs.
Disclaimer: Investment carries a risk of loss of initial capital. The past performance is not a reliable indicator of future results. Be sure to understand risks before making an investment decision.
Go Further
I encourage you to read the complete analyses of e.l.f. Beauty, Inc. and Acme United Corporation to enhance your investment decisions: