Home > Comparison > Consumer Defensive > COTY vs ACU
The strategic rivalry between Coty Inc. and Acme United Corporation shapes the competitive landscape of the Household & Personal Products sector. Coty operates as a global beauty products giant with an extensive brand portfolio and capital-intensive distribution. Acme United, by contrast, is a niche supplier focused on first aid and cutting tools with a leaner operational model. This analysis will assess which company’s trajectory presents a superior risk-adjusted return for a diversified portfolio.
Table of contents
Companies Overview
Coty Inc. and Acme United Corporation hold significant positions in the Household & Personal Products sector.
Coty Inc.: Global Beauty Powerhouse
Coty Inc. dominates the prestige and mass beauty products market worldwide. It generates revenue by marketing fragrances, skin care, and color cosmetics under iconic brands like Gucci, Calvin Klein, and CoverGirl. In 2026, Coty sharpens its focus on expanding direct-to-consumer channels and optimizing global distribution to strengthen its competitive edge.
Acme United Corporation: Specialty Tools and Safety Leader
Acme United Corporation excels in specialized cutting, safety, and first aid products across North America and Europe. It drives sales through established brands such as Westcott and Clauss, targeting school, office, and industrial markets. The company’s 2026 strategy centers on innovation in safety solutions and expanding its presence in e-commerce and wholesale channels.
Strategic Collision: Similarities & Divergences
Both companies operate within household essentials but diverge sharply in focus—Coty pursues a consumer beauty ecosystem, while Acme emphasizes niche industrial and safety tools. Their primary battleground is brand recognition and distribution reach in competitive retail environments. Coty presents a high-profile, brand-driven investment profile, whereas Acme offers stability through specialized product lines and steady niche demand.
Income Statement Comparison
This data dissects the core profitability and scalability of both corporate engines to reveal who dominates the bottom line:
| Metric | Coty Inc. (COTY) | Acme United Corporation (ACU) |
|---|---|---|
| Revenue | 5.89B | 194.49M |
| Cost of Revenue | 2.07B | 118.14M |
| Operating Expenses | 3.58B | 62.21M |
| Gross Profit | 3.82B | 76.35M |
| EBITDA | 949.9M | 20.44M |
| EBIT | 529.9M | 14.38M |
| Interest Expense | 227.0M | 2.08M |
| Net Income | -368.0M | 10.02M |
| EPS | -0.44 | 2.71 |
| Fiscal Year | 2025 | 2024 |
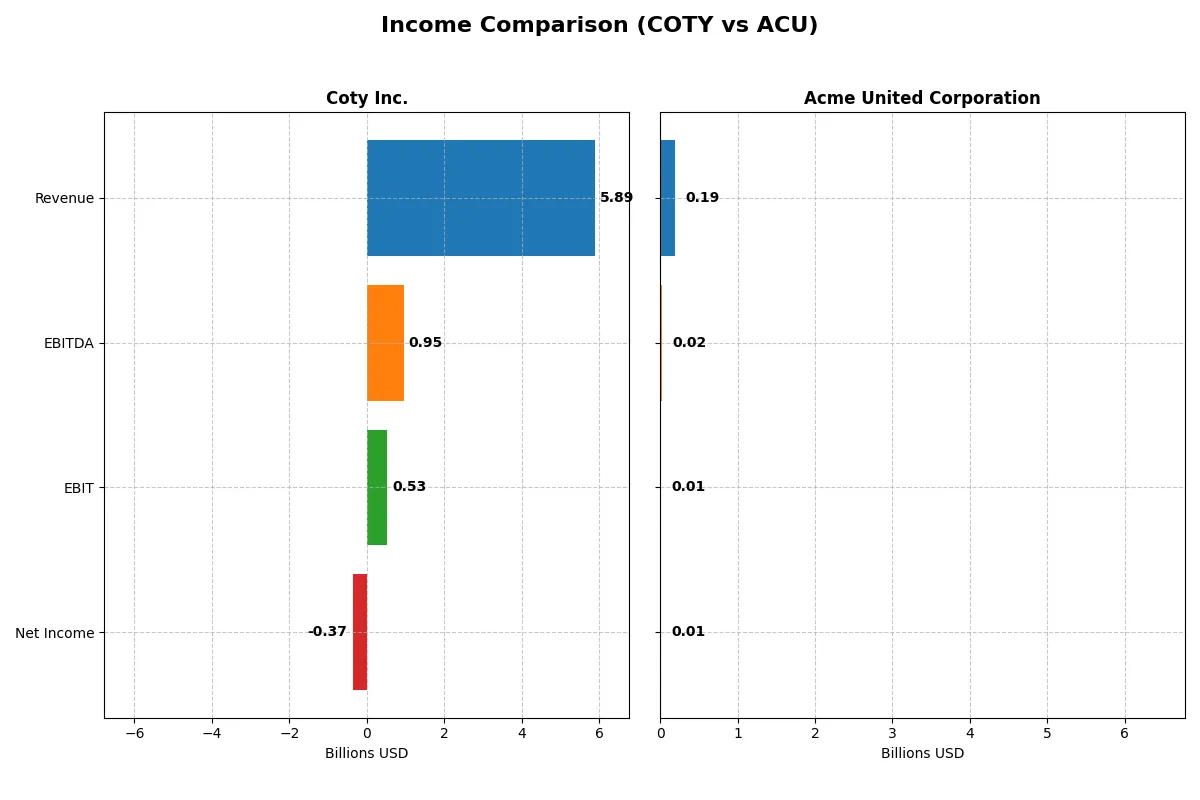
Income Statement Analysis: The Bottom-Line Duel
This income statement comparison reveals which company runs a more efficient and profitable corporate engine over recent years.
Coty Inc. Analysis
Coty’s revenue grew 27% from 2021 to 2025 but declined 3.7% in the last year to $5.9B. Gross margin remains strong at 64.8%, showing solid cost control. However, the net income turned negative in 2025 with a -6.2% net margin, reflecting deteriorating profitability and operational challenges undermining efficiency.
Acme United Corporation Analysis
Acme United posted steady revenue growth of 18.6% over five years, reaching $194M in 2024. Its gross margin stands at 39.3%, lower than Coty but consistent. Net income improved 24% overall, with a positive net margin of 5.1%. Recent earnings faced headwinds—EBIT and net margin slipped sharply—but the company maintains a favorable profitability trajectory.
Margin Durability vs. Consistent Profit Growth
Coty dominates in scale and gross margin but struggles with net income losses and margin erosion, signaling risk in operational efficiency. Acme United delivers smaller but stable profits, with healthier net margin trends despite lower scale. For investors, Acme’s resilient bottom line offers a more reliable profit profile than Coty’s volatile income statement.
Financial Ratios Comparison
These vital ratios act as a diagnostic tool to expose the underlying fiscal health, valuation premiums, and capital efficiency of the companies compared below:
| Ratios | Coty Inc. (COTY) | Acme United Corporation (ACU) |
|---|---|---|
| ROE | -9.98% (2025) | 9.37% (2024) |
| ROIC | 2.55% (2025) | 8.16% (2024) |
| P/E | -11.0 (2025) | 13.8 (2024) |
| P/B | 1.10 (2025) | 1.29 (2024) |
| Current Ratio | 0.77 (2025) | 4.17 (2024) |
| Quick Ratio | 0.46 (2025) | 1.71 (2024) |
| D/E | 1.15 (2025) | 0.31 (2024) |
| Debt-to-Assets | 35.7% (2025) | 20.3% (2024) |
| Interest Coverage | 1.06 (2025) | 6.79 (2024) |
| Asset Turnover | 0.49 (2025) | 1.20 (2024) |
| Fixed Asset Turnover | 6.04 (2025) | 5.33 (2024) |
| Payout Ratio | -3.6% (2025) | 22.2% (2024) |
| Dividend Yield | 0.33% (2025) | 1.61% (2024) |
| Fiscal Year | 2025 | 2024 |
Efficiency & Valuation Duel: The Vital Signs
Financial ratios act as a company’s DNA, uncovering hidden risks and revealing operational strengths through clear, comparable metrics.
Coty Inc.
Coty shows weak profitability with a negative ROE of -10% and net margin at -6.24%, signaling operational challenges. Its valuation appears attractive with a favorable P/E and P/B around 1.1, yet its current ratio below 1 flags liquidity risks. Coty returns modest dividends but leans on reinvestment amid persistent financial headwinds.
Acme United Corporation
Acme United posts moderate profitability with a 9.37% ROE and a neutral net margin near 5.15%. The P/E of 13.78 and P/B of 1.29 suggest fair valuation, supported by strong liquidity (current ratio 4.17) and low leverage (D/E 0.31). It offers a 1.61% dividend yield while maintaining healthy cash flow and operational efficiency.
Balanced Strength vs. Financial Fragility
Acme United delivers a sturdier balance of profitability, liquidity, and valuation metrics compared to Coty’s stretched operational profile and liquidity concerns. Investors prioritizing financial resilience and moderate income may find Acme’s profile more suitable, while Coty’s valuation appeal comes with elevated risk.
Which one offers the Superior Shareholder Reward?
I observe that Acme United Corporation (ACU) offers superior shareholder reward compared to Coty Inc. (COTY). ACU delivers a higher dividend yield at 1.6% versus COTY’s 0.33%, with a prudent payout ratio around 22%. ACU’s dividend is well-covered by free cash flow, signaling sustainability. Meanwhile, Coty’s yield is minimal and payout ratios are volatile, reflecting weaker profitability and cash generation. Both companies engage in buybacks, but Coty’s negative net income and high leverage raise red flags for distribution sustainability. ACU’s conservative debt metrics and strong cash flow underpin a more reliable total return profile for 2026 investors.
Comparative Score Analysis: The Strategic Profile
The radar chart reveals the core financial DNA and trade-offs between Coty Inc. and Acme United Corporation:
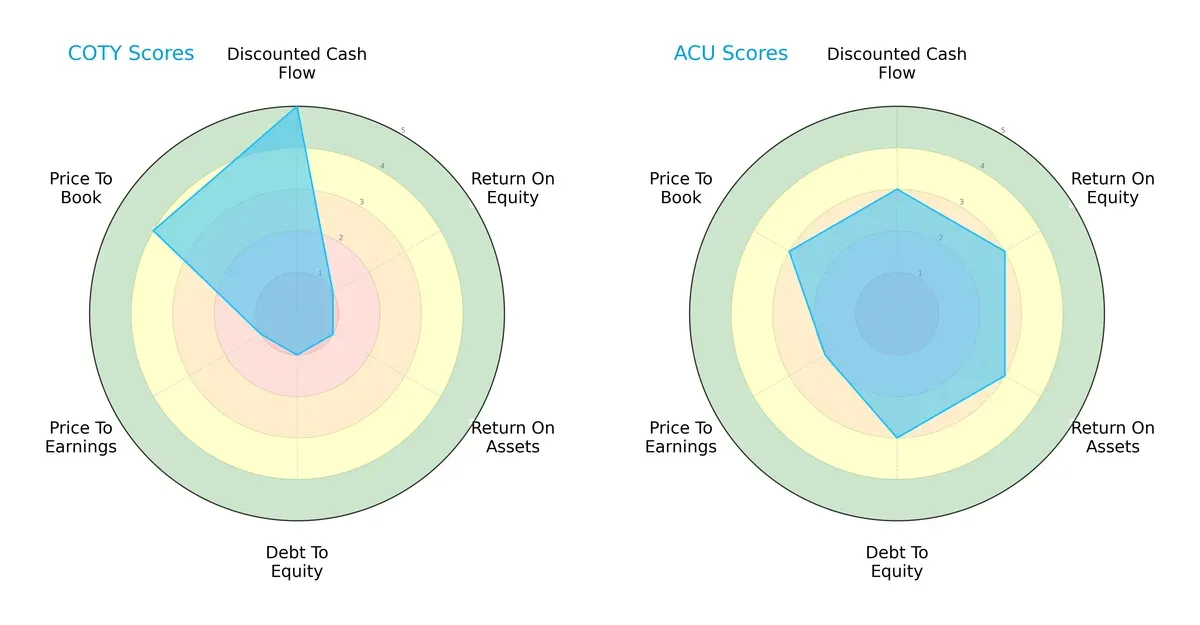
Coty excels in discounted cash flow with a very favorable score of 5, but struggles with profitability and leverage, scoring 1 on ROE, ROA, and Debt/Equity. Acme United shows a more balanced profile with moderate scores (around 3) across all categories, including valuation metrics. Coty relies heavily on discounted cash flow strength while Acme demonstrates steadier operational efficiency and financial stability.
Bankruptcy Risk: Solvency Showdown
The Altman Z-Score gap signals a stark contrast in financial survival prospects for Coty and Acme United in this cycle:
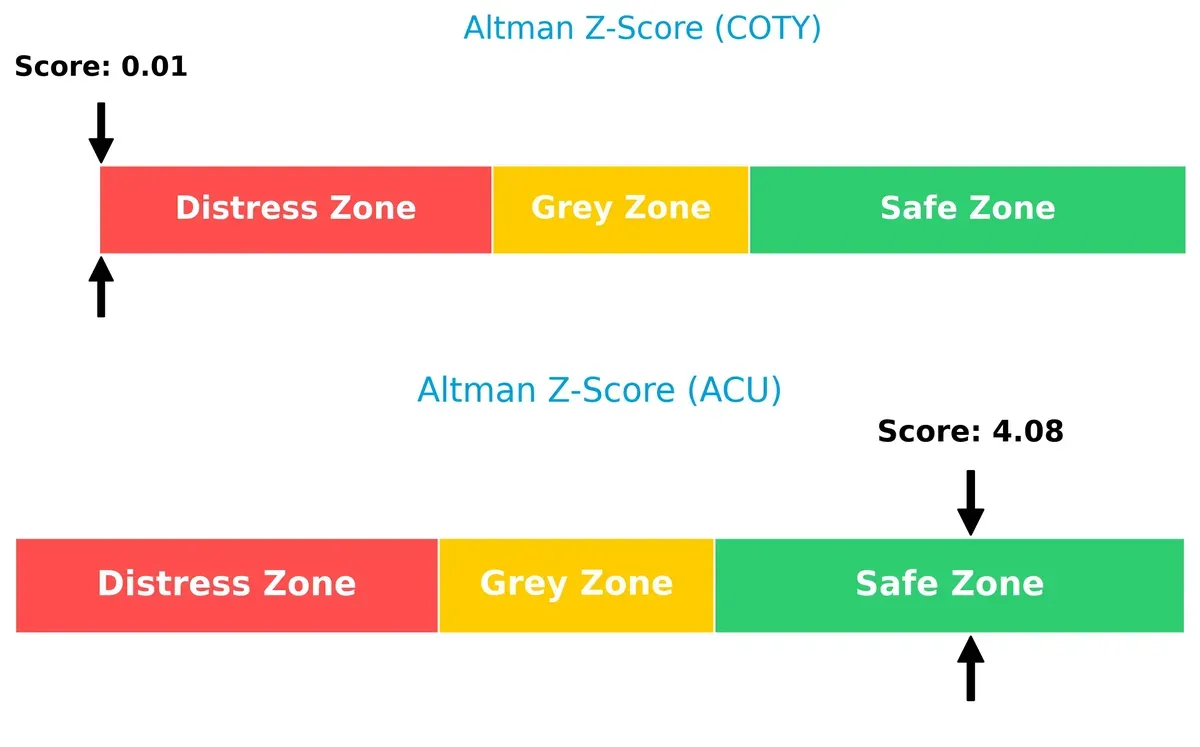
Coty’s distress zone score near zero indicates a high bankruptcy risk, while Acme United’s safe zone score above 4 suggests strong solvency and resilience against economic downturns.
Financial Health: Quality of Operations
Piotroski F-Scores highlight the operational quality and risk signals between the two companies:
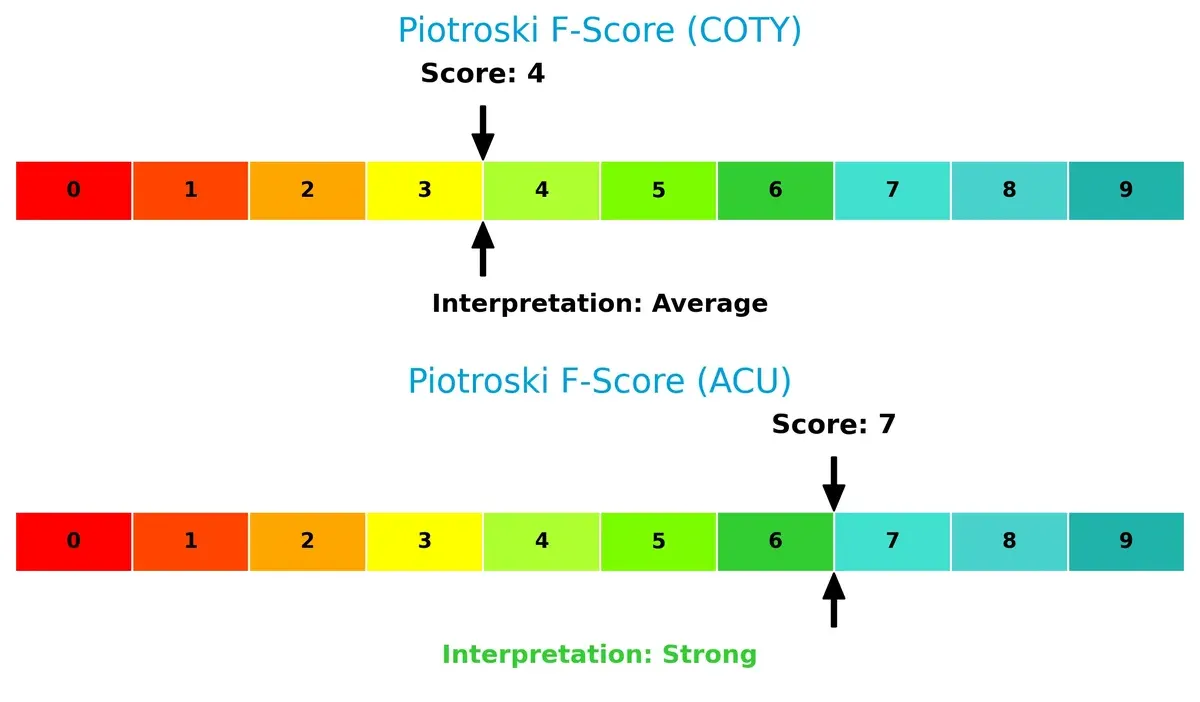
Acme United scores a strong 7, reflecting robust financial health with effective profitability and leverage controls. Coty’s average score of 4 flags internal weaknesses and potential red flags in operational metrics compared to Acme’s solid profile.
How are the two companies positioned?
This section dissects the operational DNA of Coty and Acme United by comparing their revenue distribution and internal dynamics. The goal is to confront their economic moats to reveal which business model delivers the most resilient competitive advantage today.
Revenue Segmentation: The Strategic Mix
This visual comparison dissects how Coty Inc. and Acme United Corporation diversify their income streams and highlights where their primary sector bets lie:
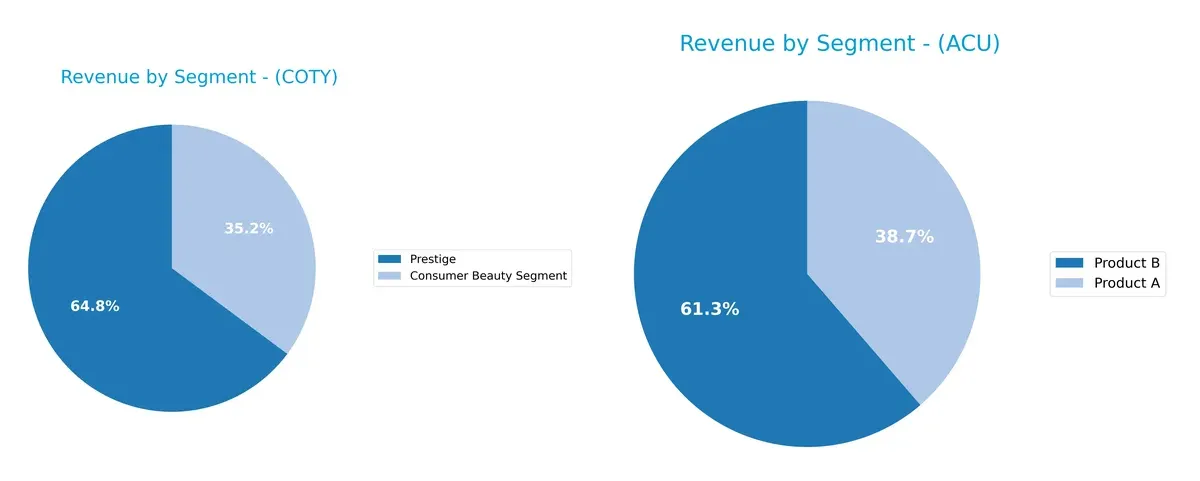
Coty anchors its revenue in two dominant segments: Prestige at $3.82B and Consumer Beauty at $2.07B in 2025, showing moderate concentration risk. In contrast, Acme United balances between Product B at $119M and Product A at $75M, reflecting a more diversified mix. Coty’s focus on prestige products signals strong brand leverage, while Acme’s dual-product reliance suggests resilience but limited scale. Investors should weigh Coty’s ecosystem lock-in against Acme’s broader product spread.
Strengths and Weaknesses Comparison
This table compares the Strengths and Weaknesses of Coty Inc. and Acme United Corporation:
Coty Inc. Strengths
- Diverse beauty segments including Consumer and Prestige
- Favorable fixed asset turnover at 6.04
- Price-to-book ratio at 1.1 indicates reasonable valuation
Acme United Corporation Strengths
- Favorable net margin at 5.15%
- Low debt-to-equity ratio at 0.31
- Strong liquidity with quick ratio of 1.71
- Favorable asset turnover at 1.2
Coty Inc. Weaknesses
- Negative net margin at -6.24% and ROE at -9.98%
- Low current and quick ratios indicate liquidity risk
- Higher debt-to-equity ratio at 1.15
Acme United Corporation Weaknesses
- ROE at 9.37% flagged as unfavorable
- Current ratio very high at 4.17, possibly inefficient capital use
Coty’s strengths lie in its product diversification and asset efficiency despite profitability challenges. Acme United shows strong financial health and operational efficiency but faces modest profitability and capital structure concerns. Both companies must balance these factors in their strategic planning.
The Moat Duel: Analyzing Competitive Defensibility
A structural moat is the only shield protecting long-term profits from relentless competitive erosion. Let’s dissect the defensive walls of Coty Inc. and Acme United Corporation:
Coty Inc.: Brand Power with Margin Resilience
Coty’s moat centers on intangible assets and brand prestige, reflected in a robust 64.8% gross margin. Despite a negative net margin and recent revenue declines, its growing ROIC signals improving operational efficiency. New luxury product launches could deepen Coty’s market grip in 2026.
Acme United Corporation: Niche Product Focus and Operational Efficiency
Acme United’s moat relies on specialized product lines and cost control, with a solid 39.3% gross margin and positive net margin. Unlike Coty, its ROIC trends downwards, signaling margin pressure. Expansion into new safety and first-aid markets may reignite growth in 2026.
Moat Strength Showdown: Brand Prestige vs. Product Niche
Coty’s intangible asset moat is wider, backed by improving ROIC and global brand presence. Acme’s niche focus is narrower, challenged by declining profitability. Coty stands better equipped to defend and extend its market share.
Which stock offers better returns?
Over the past 12 months, Coty Inc. and Acme United Corporation exhibited contrasting stock price trajectories, reflecting divergent market sentiments and trading volumes.
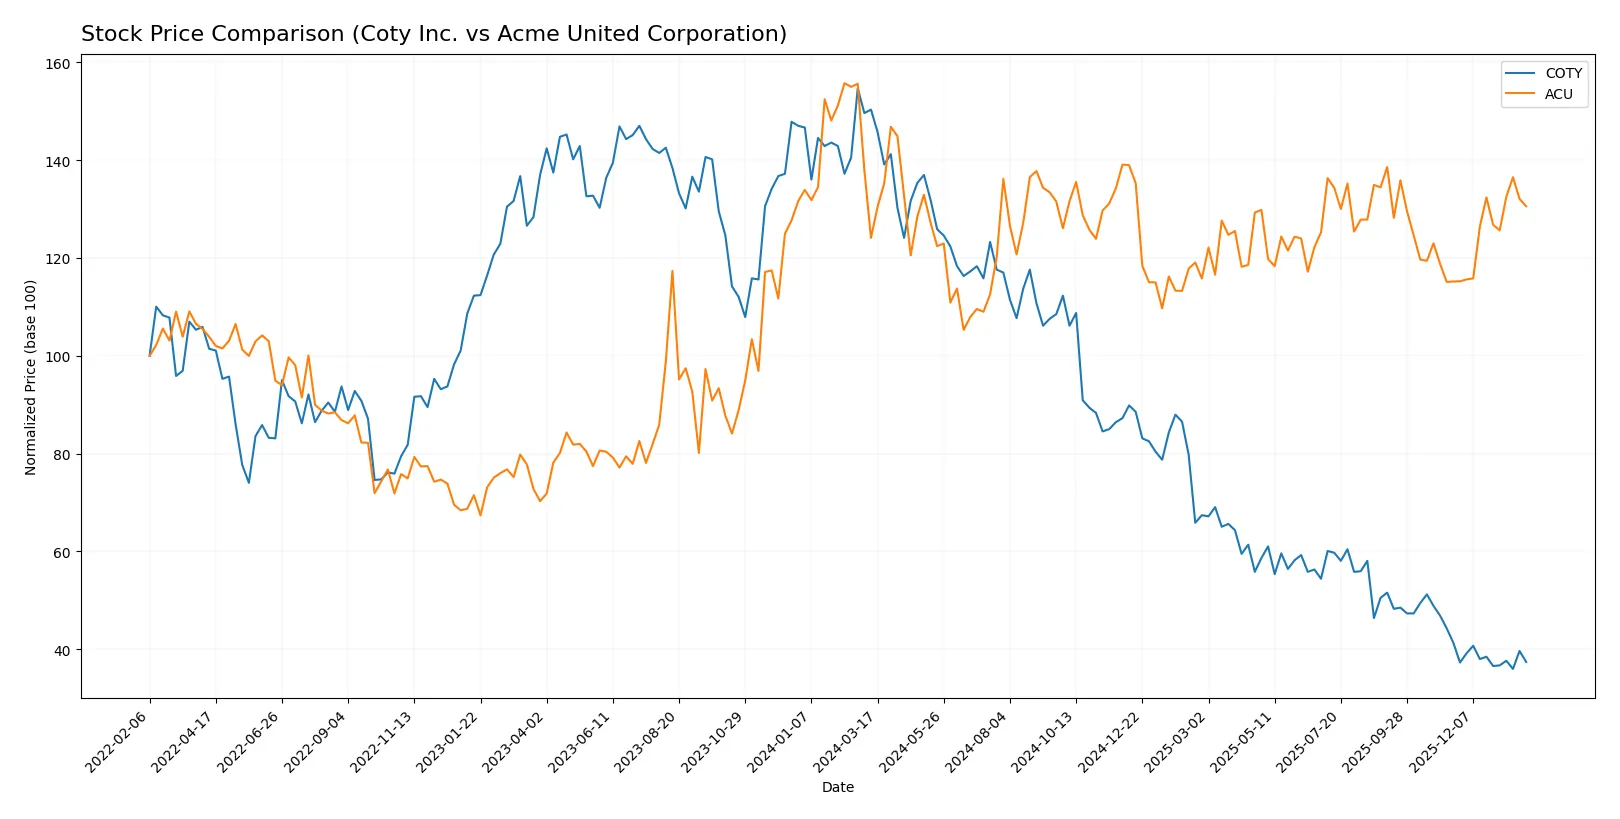
Trend Comparison
Coty Inc.’s stock declined sharply by 75.1% over the past year, showing a bearish trend with accelerating downward momentum and a high volatility level of 2.74. The stock hit a low of 3.05, signaling sustained weakness.
Acme United Corporation’s stock rose 5.21% over the same period, indicating a bullish trend with accelerating gains and comparable volatility at 2.76. The price peaked near 47.0, reflecting consistent upward momentum.
Comparing these trends, Acme United delivered the highest market performance, outperforming Coty’s significant loss despite lower overall trading volumes.
Target Prices
Analysts show a mixed but cautiously optimistic target consensus for Coty Inc.
| Company | Target Low | Target High | Consensus |
|---|---|---|---|
| Coty Inc. | 3.00 | 10.00 | 4.83 |
Coty’s consensus target sits 52% above its current 3.17 price, indicating moderate upside potential. No verified target price data is available for Acme United Corporation.

Don’t Let Luck Decide Your Entry Point
Optimize your entry points with our advanced ProRealTime indicators. You’ll get efficient buy signals with precise price targets for maximum performance. Start outperforming now!
How do institutions grade them?
Here is a comparison of recent institutional grades for Coty Inc. and Acme United Corporation:
Coty Inc. Grades
The table below summarizes recent Coty Inc. grades from recognized financial institutions.
| Grading Company | Action | New Grade | Date |
|---|---|---|---|
| TD Cowen | Maintain | Hold | 2026-01-21 |
| Evercore ISI Group | Downgrade | In Line | 2025-12-23 |
| Citigroup | Maintain | Neutral | 2025-12-17 |
| TD Cowen | Maintain | Hold | 2025-12-12 |
| Berenberg | Downgrade | Hold | 2025-09-10 |
| Morgan Stanley | Maintain | Equal Weight | 2025-08-25 |
| Goldman Sachs | Maintain | Neutral | 2025-08-22 |
| Canaccord Genuity | Maintain | Hold | 2025-08-22 |
| Barclays | Maintain | Underweight | 2025-08-22 |
| Wells Fargo | Maintain | Equal Weight | 2025-08-22 |
Acme United Corporation Grades
Below is the available institutional grade for Acme United Corporation.
| Grading Company | Action | New Grade | Date |
|---|---|---|---|
| DA Davidson | Maintain | Buy | 2016-07-01 |
Which company has the best grades?
Coty Inc. mostly receives Hold or Neutral grades with some downgrades, reflecting cautious institutional sentiment. Acme United Corporation has a single Buy grade from 2016, without recent updates. Investors may find Coty’s current ratings more reflective of present market views.
Risks specific to each company
The following categories identify the critical pressure points and systemic threats facing both firms in the 2026 market environment:
1. Market & Competition
Coty Inc.
- Faces intense competition in beauty products, with pressure on margins and brand differentiation.
Acme United Corporation
- Competes in niche first aid and safety products, benefiting from less direct rivalry and stable demand.
2. Capital Structure & Debt
Coty Inc.
- High debt-to-equity ratio (1.15) signals financial leverage risks and interest burden.
Acme United Corporation
- Low debt-to-equity ratio (0.31) provides financial flexibility and lower default risk.
3. Stock Volatility
Coty Inc.
- Beta near 1 (0.958) suggests stock moves closely with the market, moderate volatility.
Acme United Corporation
- Lower beta (0.74) indicates less volatility and defensiveness in turbulent markets.
4. Regulatory & Legal
Coty Inc.
- Subject to stringent regulations on cosmetics ingredients and marketing claims globally.
Acme United Corporation
- Faces fewer regulatory complexities, mainly product safety standards in first aid and cutting tools.
5. Supply Chain & Operations
Coty Inc.
- Global supply chain exposes it to disruptions, rising costs, and inventory management challenges.
Acme United Corporation
- Smaller scale and diversified product lines reduce supply chain risks.
6. ESG & Climate Transition
Coty Inc.
- Increasing pressure to adopt sustainable sourcing and reduce carbon footprint in beauty segment.
Acme United Corporation
- Faces moderate ESG risks; product safety and waste management are focal points.
7. Geopolitical Exposure
Coty Inc.
- Operates in 150 countries; vulnerable to trade tensions and currency volatility.
Acme United Corporation
- Primarily North American exposure limits geopolitical risks but less global growth opportunity.
Which company shows a better risk-adjusted profile?
Coty’s highest risk lies in its burdensome debt and weak profitability, placing it in financial distress. Acme’s main risk is its relatively high current ratio, signaling working capital inefficiency yet it maintains strong financial health. Acme shows a superior risk-adjusted profile supported by a safe Altman Z-score (4.08) versus Coty’s distress zone (0.01). This gap reflects Acme’s prudent capital structure and operational resilience, underscored by its moderate stock volatility and strong Piotroski score.
Final Verdict: Which stock to choose?
Coty Inc. stands out with its ability to steadily improve profitability despite currently shedding value. Its real strength lies in operational resilience and intangible asset leverage. However, its weak liquidity and negative returns on equity pose a point of vigilance. Coty fits an aggressive growth portfolio willing to absorb volatility for potential turnaround gains.
Acme United Corporation commands a strategic moat through disciplined capital allocation and solid asset turnover. It offers a favorable financial stability profile compared to Coty, with healthier liquidity and lower leverage. Acme suits a GARP (Growth at a Reasonable Price) portfolio focused on measured growth and financial prudence.
If you prioritize turnaround potential and can tolerate elevated risk, Coty offers an intriguing scenario due to its improving profitability and operational leverage. However, if you seek better stability and consistent capital efficiency, Acme outshines with stronger financial health and less downside risk. Both present distinct investment narratives aligned with different risk appetites.
Disclaimer: Investment carries a risk of loss of initial capital. The past performance is not a reliable indicator of future results. Be sure to understand risks before making an investment decision.
Go Further
I encourage you to read the complete analyses of Coty Inc. and Acme United Corporation to enhance your investment decisions: