Home > Comparison > Consumer Defensive > CHD vs ACU
The strategic rivalry between Church & Dwight Co., Inc. and Acme United Corporation shapes the landscape of the consumer defensive sector. Church & Dwight operates as a diversified household products powerhouse with global reach. Acme United focuses on specialized first aid and cutting tools, targeting niche markets. This analysis pits broad scale versus targeted expertise to uncover which trajectory delivers superior risk-adjusted returns for diversified portfolios.
Table of contents
Companies Overview
Church & Dwight and Acme United command distinct niches within the household and personal products market.
Church & Dwight: Diversified Consumer Staples Leader
Church & Dwight dominates as a household and personal care products manufacturer. Its revenue flows from three segments: Consumer Domestic, Consumer International, and Specialty Products. In 2026, the firm sharpens its focus on expanding its specialty product lines and leveraging iconic brands like ARM & HAMMER and TROJAN to maintain broad retail presence and innovation.
Acme United: Specialized Cutting and Safety Tools Provider
Acme United specializes in first aid, safety, and cutting tools for varied markets including school, home, and industrial sectors. Its revenue hinges on branded products such as Westcott scissors and PhysiciansCare first aid solutions. The company’s 2026 strategy centers on penetrating international markets and enhancing direct and e-commerce sales channels to build niche leadership.
Strategic Collision: Similarities & Divergences
Both companies serve the consumer defensive sector but diverge sharply in scope and scale. Church & Dwight pursues a wide product portfolio with strong brand equity, while Acme United focuses on specialized tools and safety with narrower market reach. They primarily compete for shelf space in mass retail and e-commerce. Their distinct investment profiles reflect Church & Dwight’s scale-driven stability versus Acme United’s focused growth potential.
Income Statement Comparison
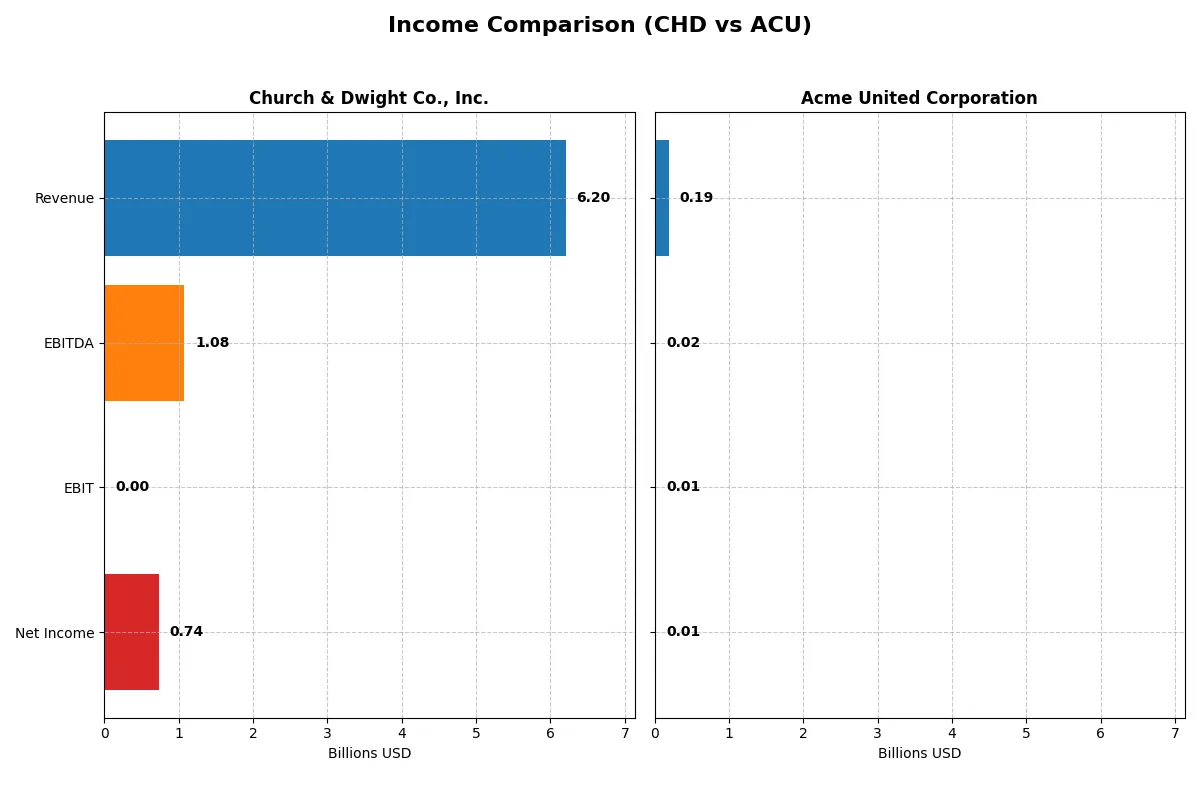
This data dissects the core profitability and scalability of both corporate engines to reveal who dominates the bottom line:
| Metric | Church & Dwight Co., Inc. (CHD) | Acme United Corporation (ACU) |
|---|---|---|
| Revenue | 6.20B | 194.5M |
| Cost of Revenue | 3.43B | 118.1M |
| Operating Expenses | 988.3M | 62.2M |
| Gross Profit | 2.77B | 76.4M |
| EBITDA | 1.08B | 20.4M |
| EBIT | 1.08B | 14.4M |
| Interest Expense | 0 | 2.08M |
| Net Income | 737.0M | 10.0M |
| EPS | 3.04 | 2.71 |
| Fiscal Year | 2025 | 2024 |
Income Statement Analysis: The Bottom-Line Duel
This income statement comparison exposes how effectively each company converts sales into profit, revealing their operational efficiency and momentum.
Church & Dwight Co., Inc. Analysis
Church & Dwight’s revenue rose steadily from 5.19B in 2021 to 6.20B in 2025, reflecting a 19.5% growth over five years. Net income, however, declined overall, hitting 737M in 2025 despite a strong net margin near 12%. Gross margins remain robust at 44.7%, but EBIT margin collapsed to zero in 2025, signaling pressure on core operating profits. The latest year shows modest revenue growth but deteriorating profitability efficiency.
Acme United Corporation Analysis
Acme United grew revenue from 164M in 2020 to 194M in 2024, an 18.6% increase, showing consistent top-line expansion. Net income advanced 23.7% over the period, reaching 10M in 2024. Gross margin stands healthy at 39.3%, slightly lower than Church & Dwight, with EBIT margin at 7.4%. Despite a sharp net margin and EPS drop in 2024, the company’s overall income statement trajectory remains favorable, though recent momentum weakens.
Steady Scale vs. Favorable Growth
Church & Dwight commands scale with superior gross margin and higher absolute profits, but its EBIT collapse raises efficiency concerns. Acme United delivers smaller but healthier margin improvements and net income growth. For investors, Church & Dwight offers size and margin power, while Acme United presents a more favorable growth profile with risks in recent earnings momentum.
Financial Ratios Comparison
These vital ratios act as a diagnostic tool to expose the underlying fiscal health, valuation premiums, and capital efficiency of each company:
| Ratios | Church & Dwight Co., Inc. (CHD) | Acme United Corporation (ACU) |
|---|---|---|
| ROE | 13.42% (2024) | 9.37% (2024) |
| ROIC | 8.22% (2024) | 8.16% (2024) |
| P/E | 44.17 (2024) | 13.78 (2024) |
| P/B | 5.93 (2024) | 1.29 (2024) |
| Current Ratio | 1.70 (2024) | 4.17 (2024) |
| Quick Ratio | 1.24 (2024) | 1.71 (2024) |
| D/E | 0.55 (2024) | 0.31 (2024) |
| Debt-to-Assets | 27.08% (2024) | 20.25% (2024) |
| Interest Coverage | 8.50 (2024) | 6.79 (2024) |
| Asset Turnover | 0.69 (2024) | 1.20 (2024) |
| Fixed Asset Turnover | 6.55 (2024) | 5.33 (2024) |
| Payout Ratio | 47.33% (2024) | 22.17% (2024) |
| Dividend Yield | 1.07% (2024) | 1.61% (2024) |
| Fiscal Year | 2024 | 2024 |
Efficiency & Valuation Duel: The Vital Signs
Financial ratios act as a company’s DNA, uncovering hidden risks and revealing operational excellence critical for investment decisions.
Church & Dwight Co., Inc.
Church & Dwight posts a strong net margin of 11.88%, signaling robust profitability. However, its P/E ratio of 27.62 marks the stock as expensive relative to earnings. Shareholder returns include a modest 1.41% dividend yield, while reinvestment appears limited, reflecting a cautious capital allocation approach.
Acme United Corporation
Acme United exhibits moderate profitability with a 5.15% net margin and a more reasonable P/E of 13.78, suggesting valuation efficiency. The company supports shareholders with a 1.61% dividend yield and demonstrates favorable capital structure metrics, indicating balanced growth and shareholder return strategies.
Valuation Efficiency vs. Profitability Strength
Acme United offers a more balanced risk-reward profile with favorable valuation and capital metrics. Church & Dwight’s higher profitability comes at a stretched valuation and weaker ratio breadth. Acme suits investors prioritizing valuation discipline, while Church & Dwight appeals to those focused on margin strength.
Which one offers the Superior Shareholder Reward?
Church & Dwight (CHD) pays a 1.41% dividend yield with a 39% payout ratio, well-covered by free cash flow at 90%. Its buyback intensity remains moderate, supporting sustainable shareholder returns. Acme United (ACU) offers a higher yield of 1.61% but with a lower 22% payout ratio and weaker free cash flow coverage at 40%. ACU’s buybacks are less consistent, leaning more on dividend growth. Historically in consumer staples, I’ve observed that CHD’s balanced dividends and steady buybacks create superior long-term total returns compared to ACU’s riskier distribution model. For 2026, I favor CHD’s sustainable payout and buyback mix for superior shareholder reward.
Comparative Score Analysis: The Strategic Profile
The radar chart reveals the fundamental DNA and trade-offs of Church & Dwight Co., Inc. and Acme United Corporation, highlighting their financial strengths and vulnerabilities:
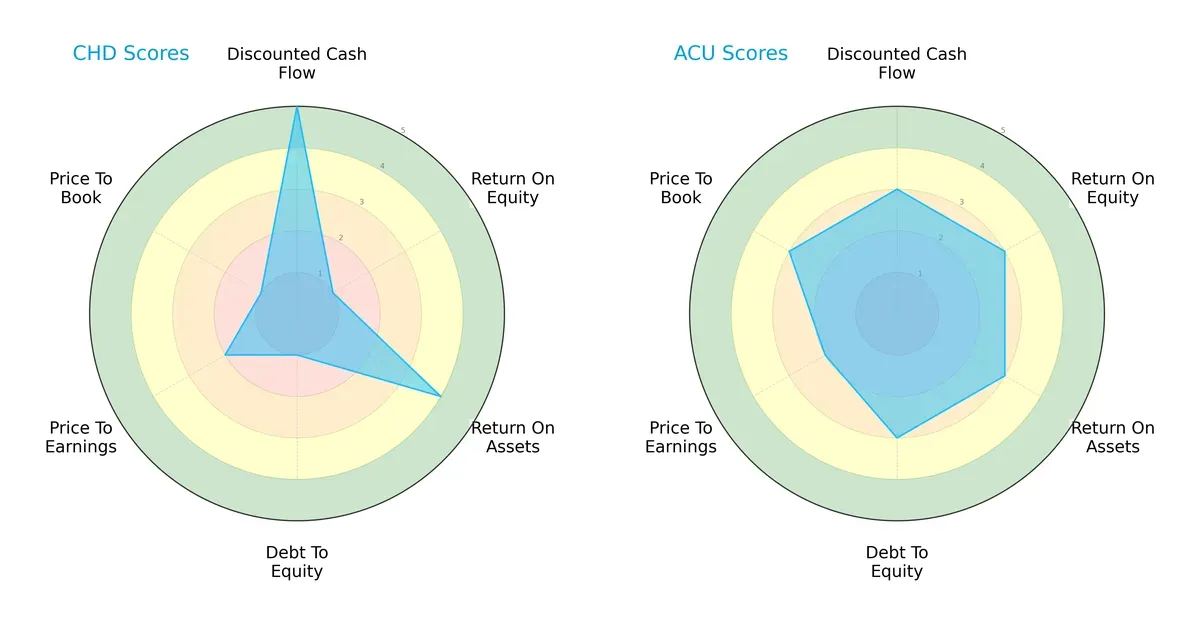
Church & Dwight shows a very favorable discounted cash flow score (5), but weak returns on equity (1) and assets (4), alongside poor debt management (1) and valuation metrics (PE 2, PB 1). Acme United offers a more balanced profile with moderate scores across all categories, including better leverage control (debt/equity 3) and valuation (PB 3). I see Acme relying on steady, consistent financial health, while Church & Dwight depends heavily on cash flow valuation advantages.
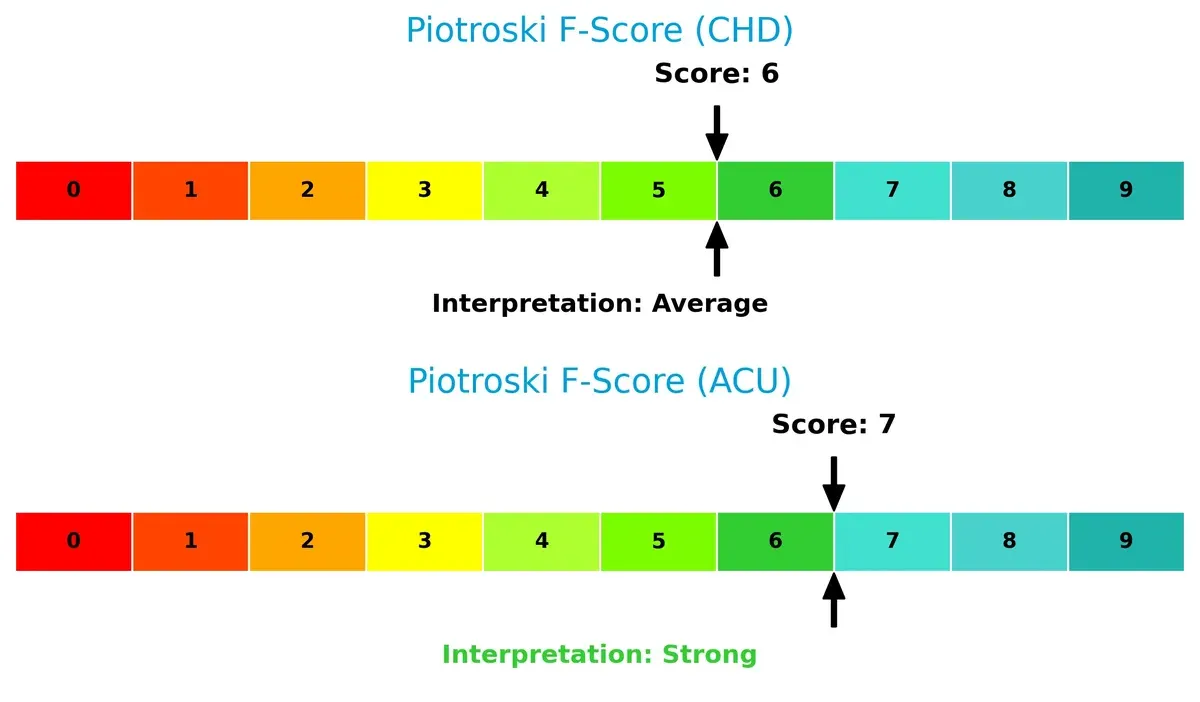
Financial Health: Quality of Operations
Acme United scores a 7 on the Piotroski scale, signaling strong financial health and operational quality. Church & Dwight registers a 6, reflecting average strength but slightly weaker internal metrics. Acme’s higher score suggests fewer red flags and a more robust balance sheet for this cycle:
How are the two companies positioned?
This section dissects the operational DNA of CHD and ACU by comparing their revenue distribution by segment and internal dynamics—strengths and weaknesses. The final objective confronts their economic moats to reveal which business model delivers the most resilient competitive advantage today.
Revenue Segmentation: The Strategic Mix
This visual comparison dissects how Church & Dwight and Acme United diversify their income streams and where their primary sector bets lie:
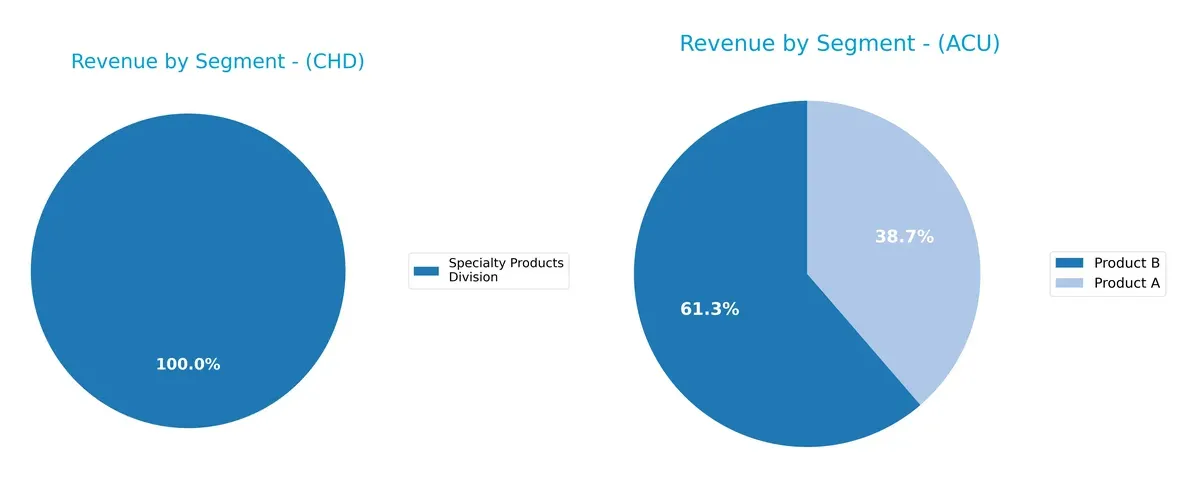
Church & Dwight anchors nearly all revenue in its Specialty Products Division, generating over $300M annually. Acme United displays a more diversified mix with Product A and Product B revenues ranging from $75M to $120M. This contrast highlights Church & Dwight’s concentrated dependence on a single segment, posing concentration risk. Acme’s dual-product focus supports resilience and flexibility, crucial in volatile markets.
Strengths and Weaknesses Comparison
This table compares the strengths and weaknesses of Church & Dwight and Acme United based on diversification, profitability, financials, innovation, global presence, and market share:
Church & Dwight Strengths
- Strong global presence with $5.8B total revenue
- Favorable net margin at 11.88%
- Low debt-to-assets ratio
- Stable Specialty Products Division revenue around $300M
Acme United Strengths
- Favorable weighted average cost of capital at 6.96%
- Strong asset turnover and fixed asset turnover ratios
- Favorable PE and PB ratios indicating fair valuation
- Diversified revenue across multiple products and regions
Church & Dwight Weaknesses
- Unfavorable ROE and ROIC at 0% indicating weak capital efficiency
- Poor liquidity ratios (current and quick ratios)
- Unfavorable interest coverage
- High PE ratio at 27.62 suggests overvaluation
Acme United Weaknesses
- Lower net margin at 5.15%
- ROE below benchmark at 9.37%
- Current ratio unfavorably high at 4.17, potentially inefficient asset use
Church & Dwight shows strength in global scale and profitability but struggles with capital efficiency and liquidity. Acme United delivers better capital efficiency and valuation metrics but faces margin pressure and liquidity concerns. These factors will influence each company’s strategic focus on operational efficiency and balance sheet management.
The Moat Duel: Analyzing Competitive Defensibility
A structural moat is the sole barrier protecting long-term profits from relentless competition erosion. Let’s dissect the moats of two household product players:
Church & Dwight Co., Inc.: Intangible Brand Power with Diverse Product Lines
Church & Dwight leverages strong brand equity and diversified household staples, reflected in stable margins near 45%. However, declining ROIC signals challenges sustaining this advantage into 2026.
Acme United Corporation: Niche Product Focus with Operational Efficiency
Acme United’s moat centers on specialized cutting and safety products. Despite a narrower market, it generates consistent gross margins around 39%. Yet, ROIC below WACC and a downward trend warn of value erosion ahead.
Brand Equity vs. Product Specialization: Who Holds the Moat Stronger?
Church & Dwight’s broader brand portfolio offers a wider moat, but its faltering capital returns are a red flag. Acme United’s focused niche yields operational efficiency but lacks durable value creation. Church & Dwight remains better positioned to defend market share, though both face moat durability risks.
Which stock offers better returns?
The past year shows contrasting price dynamics: Church & Dwight Co., Inc. (CHD) faced a 7.56% decline overall but gained 14.45% recently, while Acme United Corporation (ACU) achieved a steady 5.21% rise with a 13.34% recent uptick.
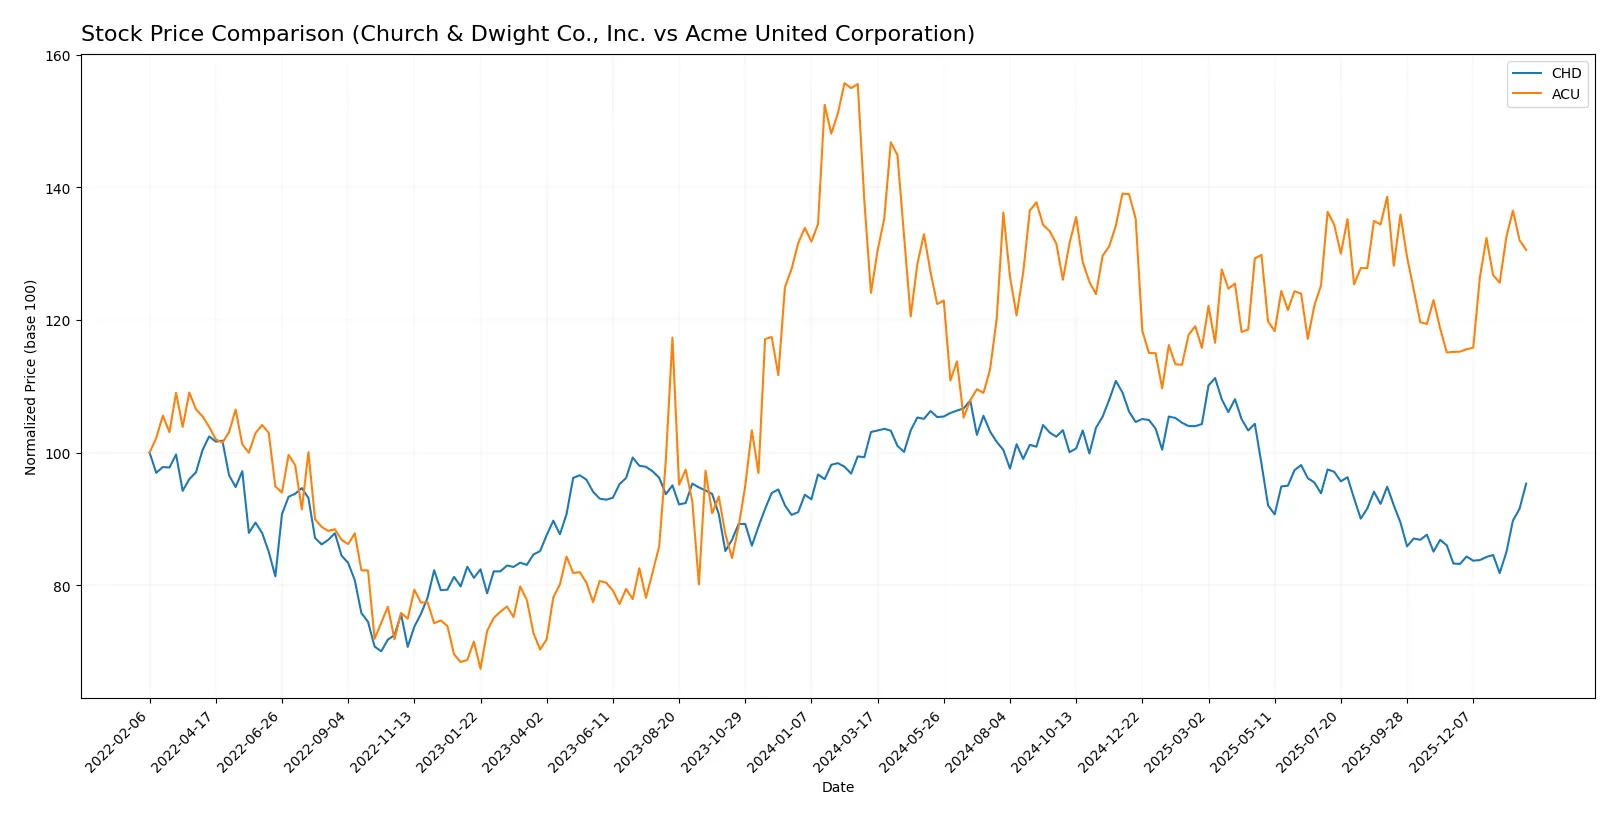
Trend Comparison
CHD’s stock declined 7.56% over 12 months, marking a bearish trend with accelerating losses and high volatility (7.84 std dev). It peaked at 112.33 and troughed at 82.64.
ACU’s price rose 5.21% over the same period, showing a bullish trend with accelerating gains and lower volatility (2.76 std dev). Its range was 33.7 to 46.99.
Comparing trends, ACU delivered stronger overall returns, outperforming CHD’s negative yearly performance despite both showing recent acceleration.
Target Prices
Church & Dwight Co., Inc. shows a clear target price consensus among analysts.
| Company | Target Low | Target High | Consensus |
|---|---|---|---|
| Church & Dwight Co., Inc. | 82 | 102 | 96.25 |
Analysts expect Church & Dwight’s stock price to hover around current levels, indicating a stable outlook with limited upside from today’s 96.25 USD. No verified target price data is available for Acme United Corporation.

Don’t Let Luck Decide Your Entry Point
Optimize your entry points with our advanced ProRealTime indicators. You’ll get efficient buy signals with precise price targets for maximum performance. Start outperforming now!
How do institutions grade them?
Here is a comparison of the most recent institutional grades for the two companies:
Church & Dwight Co., Inc. Grades
The following table summarizes recent grades from notable financial institutions for Church & Dwight Co., Inc.:
| Grading Company | Action | New Grade | Date |
|---|---|---|---|
| Jefferies | Maintain | Buy | 2026-01-28 |
| UBS | Maintain | Neutral | 2026-01-14 |
| TD Cowen | Maintain | Hold | 2026-01-08 |
| Wells Fargo | Maintain | Overweight | 2026-01-05 |
| Raymond James | Upgrade | Outperform | 2026-01-05 |
| Citigroup | Upgrade | Neutral | 2025-12-17 |
| Jefferies | Upgrade | Buy | 2025-12-17 |
| Deutsche Bank | Maintain | Buy | 2025-12-10 |
| Argus Research | Maintain | Buy | 2025-12-04 |
| Barclays | Maintain | Underweight | 2025-11-04 |
Acme United Corporation Grades
The following table summarizes recent grades from notable financial institutions for Acme United Corporation:
| Grading Company | Action | New Grade | Date |
|---|---|---|---|
| DA Davidson | Maintain | Buy | 2016-07-01 |
Which company has the best grades?
Church & Dwight Co., Inc. has received multiple recent grades, mostly positive, with several “Buy” and “Outperform” ratings. Acme United Corporation has only one grade from 2016. Investors may view Church & Dwight’s current institutional support as a stronger signal of confidence.
Risks specific to each company
The following categories identify the critical pressure points and systemic threats facing both firms in the 2026 market environment:
1. Market & Competition
Church & Dwight Co., Inc.
- Faces intense competition in consumer products with strong brands but high exposure to commoditization risks.
Acme United Corporation
- Operates in niche markets with less direct competition but limited scale and market penetration.
2. Capital Structure & Debt
Church & Dwight Co., Inc.
- Exhibits a favorable debt-to-equity ratio but weak interest coverage and liquidity ratios raise red flags.
Acme United Corporation
- Maintains a conservative debt profile with solid interest coverage and healthy liquidity metrics.
3. Stock Volatility
Church & Dwight Co., Inc.
- Low beta (0.46) indicates stability and defensive characteristics in volatile markets.
Acme United Corporation
- Moderate beta (0.74) suggests higher sensitivity to market swings, increasing risk exposure.
4. Regulatory & Legal
Church & Dwight Co., Inc.
- Large scale operations expose it to complex regulatory environments and potential liability.
Acme United Corporation
- Smaller scale and specialized products mean lower regulatory complexity but still subject to safety standards.
5. Supply Chain & Operations
Church & Dwight Co., Inc.
- Global supply chains face inflationary pressures and disruption risks amid geopolitical tensions.
Acme United Corporation
- More localized operations reduce complexity but limit economies of scale and sourcing flexibility.
6. ESG & Climate Transition
Church & Dwight Co., Inc.
- Moderate ESG initiatives but higher carbon footprint due to broad product portfolio.
Acme United Corporation
- Emerging ESG efforts with room to improve carbon efficiency and resource management.
7. Geopolitical Exposure
Church & Dwight Co., Inc.
- International sales increase exposure to tariffs, trade barriers, and currency volatility.
Acme United Corporation
- Concentrated primarily in North America, limiting geopolitical risks but constraining growth.
Which company shows a better risk-adjusted profile?
Acme United’s strongest risk lies in limited market scale and slower growth potential. Church & Dwight faces more acute financial and operational risks, particularly liquidity strains and regulatory complexity. Acme’s conservative capital structure and better liquidity support a stronger risk-adjusted profile. Notably, Acme’s Altman Z-Score places it securely in the safe zone, while Church & Dwight lacks this reassurance, warranting caution despite its larger market presence.
Final Verdict: Which stock to choose?
Church & Dwight (CHD) stands out for its strong brand portfolio and solid cash flow generation, which fuels steady dividends and share repurchases. Its point of vigilance lies in declining ROIC trends and mixed profitability signals, suggesting caution for value-focused investors. CHD suits portfolios targeting stable, income-oriented growth with moderate risk tolerance.
Acme United (ACU) offers a strategic moat through its lean operations and favorable debt management, delivering operational efficiency and financial stability. Compared to CHD, ACU presents a more attractive valuation and stronger balance sheet metrics, making it a safer choice for investors prioritizing capital preservation with a growth tilt. It fits well within GARP (Growth at a Reasonable Price) portfolios.
If you prioritize resilient cash generation and brand strength, CHD is the compelling choice despite some profitability headwinds. However, if you seek better valuation discipline and financial stability with growth potential, ACU offers superior risk-adjusted appeal. Both stocks present distinct profiles, demanding alignment with your investment strategy and risk appetite.
Disclaimer: Investment carries a risk of loss of initial capital. The past performance is not a reliable indicator of future results. Be sure to understand risks before making an investment decision.
Go Further
I encourage you to read the complete analyses of Church & Dwight Co., Inc. and Acme United Corporation to enhance your investment decisions: