Home > Comparison > Technology > IBM vs ACN
The strategic rivalry between International Business Machines Corporation (IBM) and Accenture plc shapes the evolution of the global technology services sector. IBM operates as a diversified technology powerhouse with strengths in software, infrastructure, and financing. Accenture, by contrast, excels as a professional services leader focused on consulting, digital transformation, and intelligent automation. This analysis will assess which corporate strategy offers a superior risk-adjusted return for a diversified portfolio in today’s dynamic market environment.

Table of contents
Companies Overview
International Business Machines Corporation and Accenture plc both stand as titans in the global Information Technology Services market. They drive innovation and transformation for enterprises worldwide.
International Business Machines Corporation: Hybrid Cloud Pioneer
IBM dominates through its hybrid cloud platform and software solutions, including Red Hat’s open-source offerings. Its revenue stems from software, consulting, infrastructure, and financing segments. In 2026, IBM’s strategy emphasizes expanding hybrid cloud adoption and AI-powered business automation to serve regulated industries and mission-critical workloads.
Accenture plc: Digital Transformation Leader
Accenture leads by delivering strategy, consulting, and technology services focused on digital transformation. Its core revenue comes from application services, intelligent automation, and technology consulting. In 2026, Accenture targets agile transformation, AI integration, and sustainability consulting to enhance client operations and innovation capabilities.
Strategic Collision: Similarities & Divergences
Both companies excel in technology consulting but diverge in approach: IBM leans on a closed hybrid cloud ecosystem, while Accenture pushes an open, service-driven digital transformation model. Their primary battle is industrial-scale cloud adoption and AI integration. IBM offers a capital-intensive infrastructure play; Accenture presents a labor-intensive consulting model, shaping distinct investment risk and growth profiles.
Income Statement Comparison
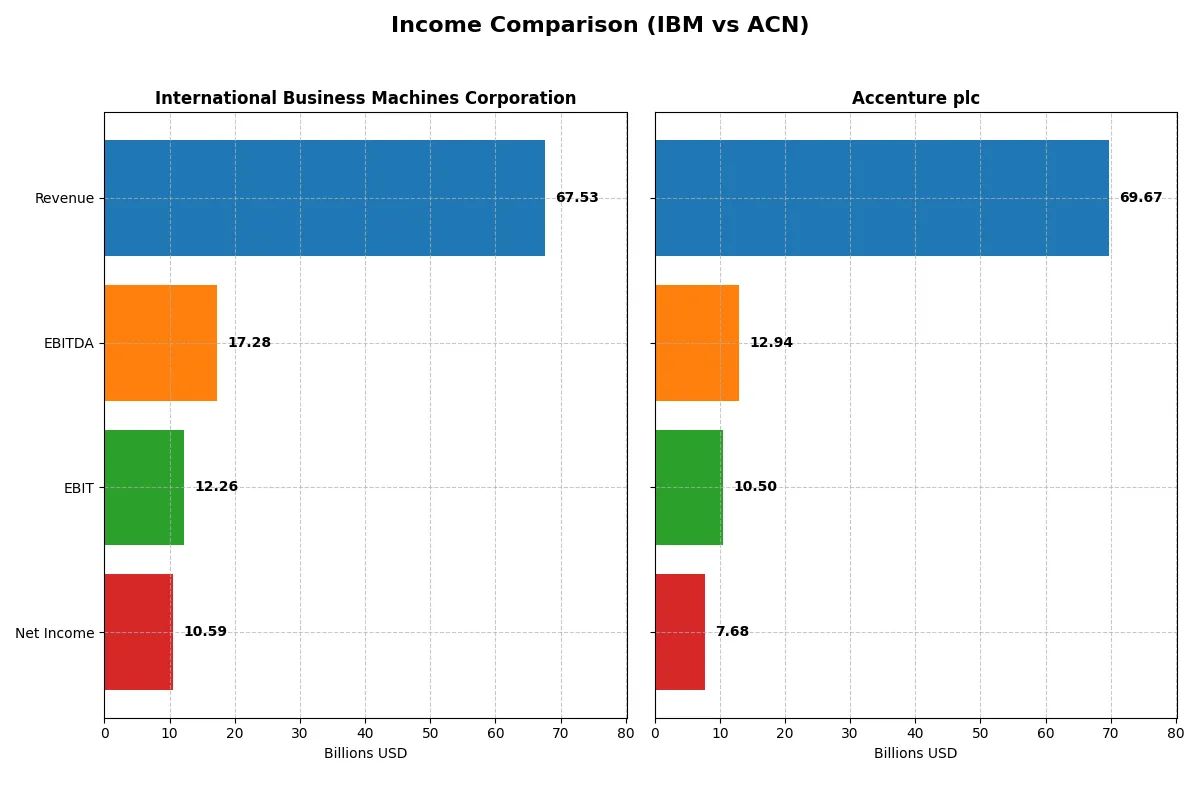
This data dissects the core profitability and scalability of both corporate engines to reveal who dominates the bottom line:
| Metric | IBM (IBM) | Accenture (ACN) |
|---|---|---|
| Revenue | 67.5B | 69.7B |
| Cost of Revenue | 27.4B | 47.4B |
| Operating Expenses | 29.9B | 12.0B |
| Gross Profit | 40.2B | 22.2B |
| EBITDA | 17.3B | 12.9B |
| EBIT | 12.3B | 10.5B |
| Interest Expense | 1.9B | 0.2B |
| Net Income | 10.6B | 7.7B |
| EPS | 11.36 | 12.29 |
| Fiscal Year | 2025 | 2025 |
Income Statement Analysis: The Bottom-Line Duel
This income statement comparison reveals the true operational efficiency and profitability momentum of two industry leaders.
International Business Machines Corporation (IBM) Analysis
IBM’s revenue rose steadily from $57.4B in 2021 to $67.5B in 2025, showing a 17.8% growth over five years. Net income surged impressively by 84.5%, reaching $10.6B in 2025. IBM maintains strong gross (59.5%) and net margins (15.7%), reflecting effective cost control and robust profitability. The 2025 EBIT jumped 63%, signaling accelerating operational efficiency.
Accenture plc (ACN) Analysis
Accenture’s revenue climbed from $50.5B in 2021 to nearly $69.7B in 2025, a 37.9% increase, outpacing IBM’s topline growth. Net income grew 30%, hitting $7.7B in 2025, though net margin dipped slightly to 11%. ACN’s gross margin stands at a leaner 31.9%, but it sustains favorable EBIT margins near 15%. Recent growth is steady, with EBIT up 7.6%, showing consistent but moderate momentum.
Margin Strength vs. Revenue Expansion
IBM leads on profitability with superior margins and a sharper net income growth trajectory. Accenture boasts stronger revenue growth but at thinner margins and slower bottom-line expansion. For investors prioritizing margin resilience and earnings momentum, IBM’s profile appears more compelling. Accenture suits those favoring top-line scale and steady operational progress.
Financial Ratios Comparison
These vital ratios act as a diagnostic tool to expose the underlying fiscal health, valuation premiums, and capital efficiency of the companies compared below:
| Ratios | International Business Machines Corporation (IBM) | Accenture plc (ACN) |
|---|---|---|
| ROE | 22.1% (2024) | 24.6% (2025) |
| ROIC | 9.2% (2024) | 17.0% (2025) |
| P/E | 34.2 (2024) | 21.2 (2025) |
| P/B | 7.54 (2024) | 5.21 (2025) |
| Current Ratio | 1.04 (2024) | 1.42 (2025) |
| Quick Ratio | 1.00 (2024) | 1.42 (2025) |
| D/E | 2.14 (2024) | 0.26 (2025) |
| Debt-to-Assets | 43% (2024) | 12.5% (2025) |
| Interest Coverage | 5.88 (2024) | 44.7 (2025) |
| Asset Turnover | 0.46 (2024) | 1.07 (2025) |
| Fixed Asset Turnover | 7.03 (2024) | 16.2 (2025) |
| Payout ratio | 102.1% (2024) | 48.2% (2025) |
| Dividend yield | 2.98% (2024) | 2.28% (2025) |
| Fiscal Year | 2024 | 2025 |
Efficiency & Valuation Duel: The Vital Signs
Financial ratios act as a company’s DNA, unveiling hidden risks and operational strengths that define its market performance and resilience.
International Business Machines Corporation
IBM exhibits a strong net margin of 15.69%, indicating profitability despite zero reported ROE and ROIC, which are unfavorable signs. The stock trades at a stretched P/E of 26.07, suggesting expensive valuation. IBM offers a 2.27% dividend yield, rewarding shareholders amid reinvestment challenges reflected by mixed ratio signals.
Accenture plc
Accenture posts a favorable 24.61% ROE and 16.99% ROIC, highlighting efficient capital use and solid profitability. Its P/E of 21.16 appears reasonably priced compared to sector peers. The company maintains a 2.28% dividend yield and shows strong balance sheet metrics, signaling operational efficiency and shareholder value creation.
Premium Valuation vs. Operational Safety
Accenture leads with a balanced profile of profitability, valuation, and robust capital management, offering lower risk and steady returns. IBM’s stretched valuation and weak returns pose higher risk despite dividends. Growth-oriented investors may prefer Accenture’s operational safety, while value seekers should note IBM’s cautionary signals.
Which one offers the Superior Shareholder Reward?
I compare IBM and Accenture’s distribution strategies, dividend yields, payout ratios, and buyback intensity to identify the superior shareholder reward. IBM yields ~2.3–4.9% with payout ratios near 60–100%, showing solid dividend coverage. Accenture pays lower yields (~1.0–2.3%) with payout ratios around 35–48%, favoring growth reinvestment. Buybacks are more aggressive at IBM, enhancing total returns amid moderate free cash flow multiples. Accenture’s lower leverage and consistent free cash flow coverage support sustainable dividends but less immediate yield. I find IBM’s higher dividend yield and buyback activity offer a superior total return profile for 2026 investors.
Comparative Score Analysis: The Strategic Profile
The radar chart reveals the fundamental DNA and trade-offs of International Business Machines Corporation and Accenture plc, illustrating their core financial strengths and vulnerabilities:
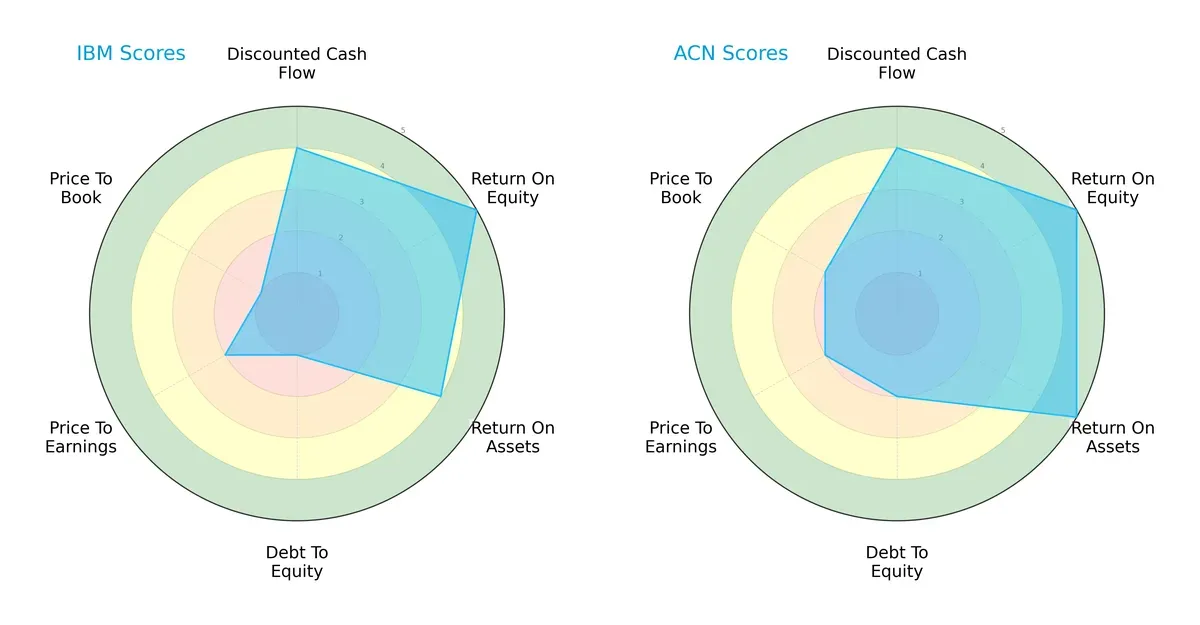
Accenture leads with a more balanced profile, excelling in ROA (5 vs. 4) and maintaining moderate debt-to-equity and valuation scores. IBM matches on ROE but lags significantly in debt management and valuation metrics, revealing a reliance on profitability over financial prudence.
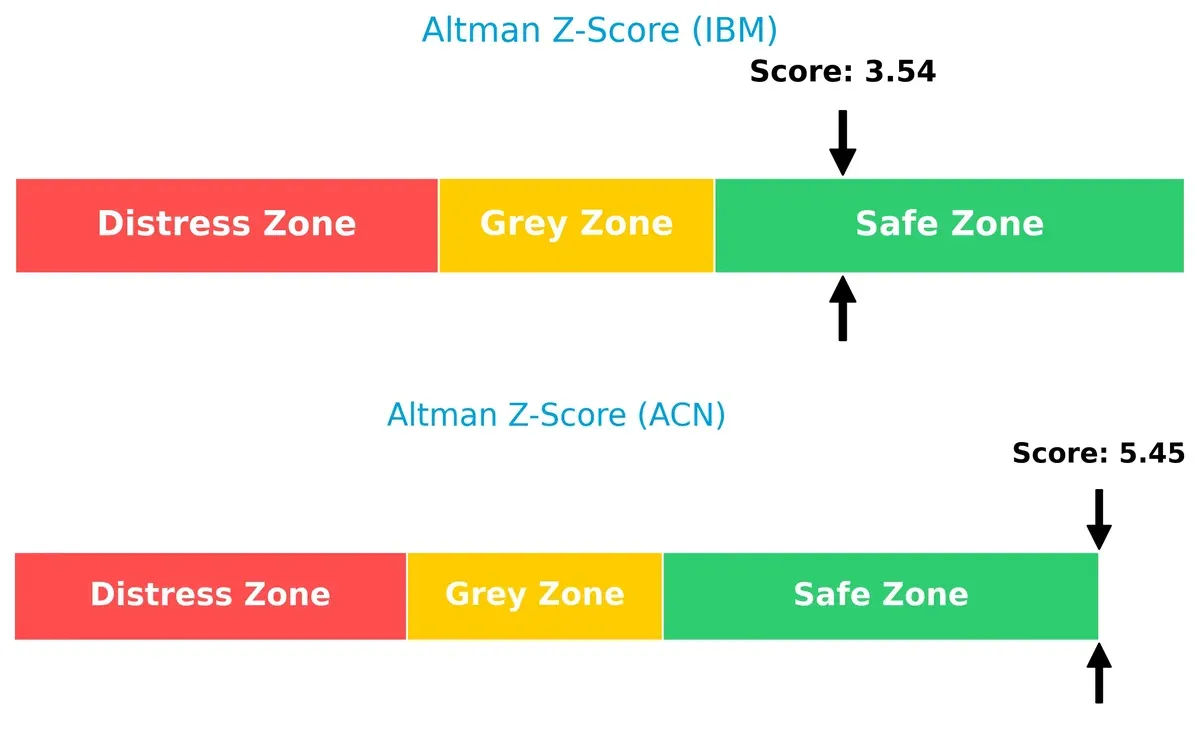
Bankruptcy Risk: Solvency Showdown
Accenture’s Altman Z-Score of 5.45 versus IBM’s 3.54 signals stronger solvency and a safer long-term outlook in this market cycle:
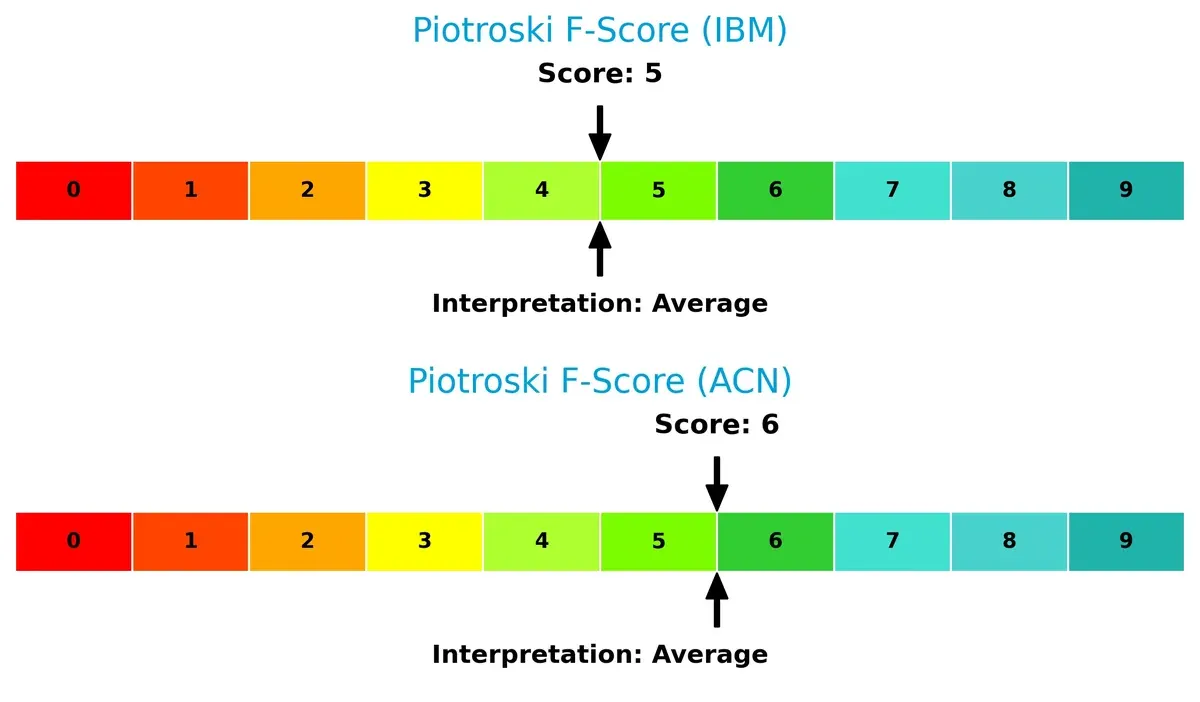
Financial Health: Quality of Operations
Accenture’s Piotroski F-Score of 6 edges out IBM’s 5, indicating marginally stronger operational quality. Neither firm shows acute red flags, but Accenture demonstrates a steadier internal financial condition:
How are the two companies positioned?
This section dissects IBM and Accenture’s operational DNA by comparing their revenue distribution and internal strengths and weaknesses. The goal is to confront their economic moats and identify which model offers the most resilient, sustainable advantage today.
Revenue Segmentation: The Strategic Mix
This visual comparison dissects how International Business Machines Corporation and Accenture plc diversify their income streams and where their primary sector bets lie:
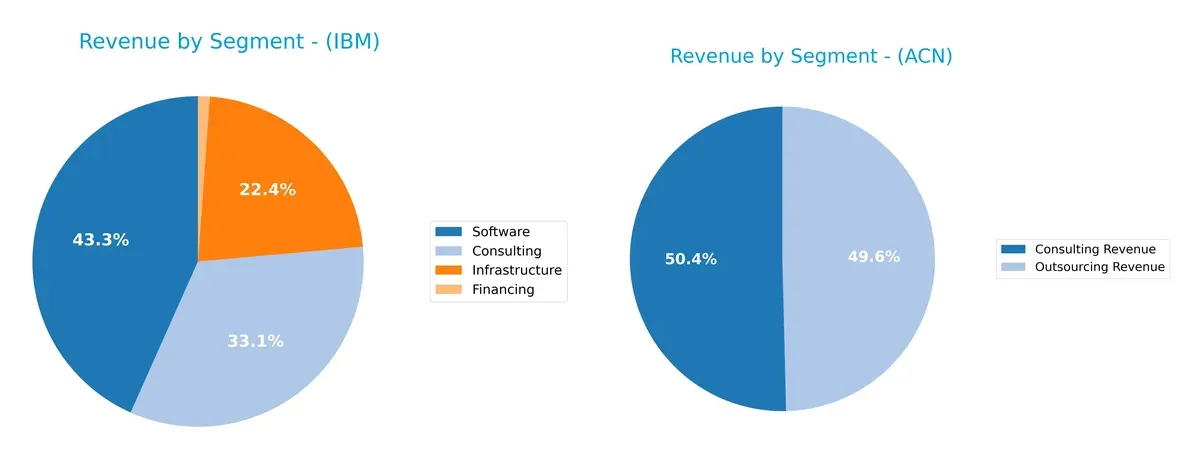
IBM anchors its revenue with a strong software segment at $27B and consulting at $20.7B, complemented by infrastructure ($14B) and marginal financing. Accenture, however, pivots on a more balanced split between consulting ($35.1B) and outsourcing ($34.6B). IBM’s concentration in software and infrastructure suggests ecosystem lock-in, while Accenture’s dual focus reduces concentration risk by leveraging service diversity.
Strengths and Weaknesses Comparison
This table compares the Strengths and Weaknesses of IBM and Accenture plc:
IBM Strengths
- Diversified revenue streams from Software, Consulting, Infrastructure, and Financing
- Global presence with strong Americas and EMEA sales
- Favorable net margin of 15.7%
- Low debt-to-assets ratio and solid interest coverage
- Consistent dividend yield of 2.27%
Accenture Strengths
- High profitability with 24.6% ROE and 17.0% ROIC
- Favorable asset and fixed asset turnover ratios
- Diverse revenue from Consulting and Outsourcing
- Strong global footprint in Europe, North America, and Growth Markets
- Robust interest coverage and low debt-to-assets ratio
- Dividend yield comparable to IBM
IBM Weaknesses
- Unfavorable ROE and ROIC at 0%
- Poor liquidity ratios with zero current and quick ratios
- Unavailable WACC and low asset turnover
- High PE ratio of 26.1 despite weak profitability signals
- Slightly unfavorable overall financial ratios
Accenture Weaknesses
- Unfavorable high price-to-book ratio of 5.21
- Neutral current ratio at 1.42 limits liquidity cushion
- PE ratio neutral but higher than S&P 500 average
- Some geographic revenue concentration in North America and Europe
IBM shows solid diversification and financial stability but suffers from weak returns and liquidity concerns. Accenture exhibits strong profitability and operational efficiency, although valuation metrics and liquidity ratios require monitoring. Both companies maintain global reach but face distinct challenges in capital allocation and market valuation.
The Moat Duel: Analyzing Competitive Defensibility
A structural moat safeguards long-term profits from relentless competitive erosion. In 2026, let’s dissect how IBM and Accenture defend their turf:
International Business Machines Corporation: Intangible Assets Powerhouse
IBM’s moat stems primarily from intangible assets like software and hybrid cloud platforms. This manifests in stable, favorable margins and accelerating earnings growth. However, its declining ROIC trend signals looming pressure, making innovation in AI and cloud critical to reinforce its moat.
Accenture plc: Service Network & Scale Advantage
Accenture leverages its vast global consulting network and operational scale, differentiating from IBM’s software-centric moat. Its ROIC exceeds WACC, reflecting efficient capital use despite a slight decline. Expansion into AI-driven digital transformation services offers fresh growth avenues to deepen its competitive edge.
Moat Quality Clash: Intangible Assets vs. Network Scale
IBM boasts stronger margin profiles and rapid profit growth, but lacks clear ROIC data, clouding sustainability. Accenture’s positive ROIC spread over WACC confirms value creation, albeit with margin pressures. I see Accenture’s wider moat as better equipped to defend market share amid evolving tech services demands.
Which stock offers better returns?
Over the past 12 months, IBM’s stock surged over 56%, showing strong gains despite recent deceleration. Accenture’s shares fell 30%, yet displayed accelerating recovery in the latest quarter.
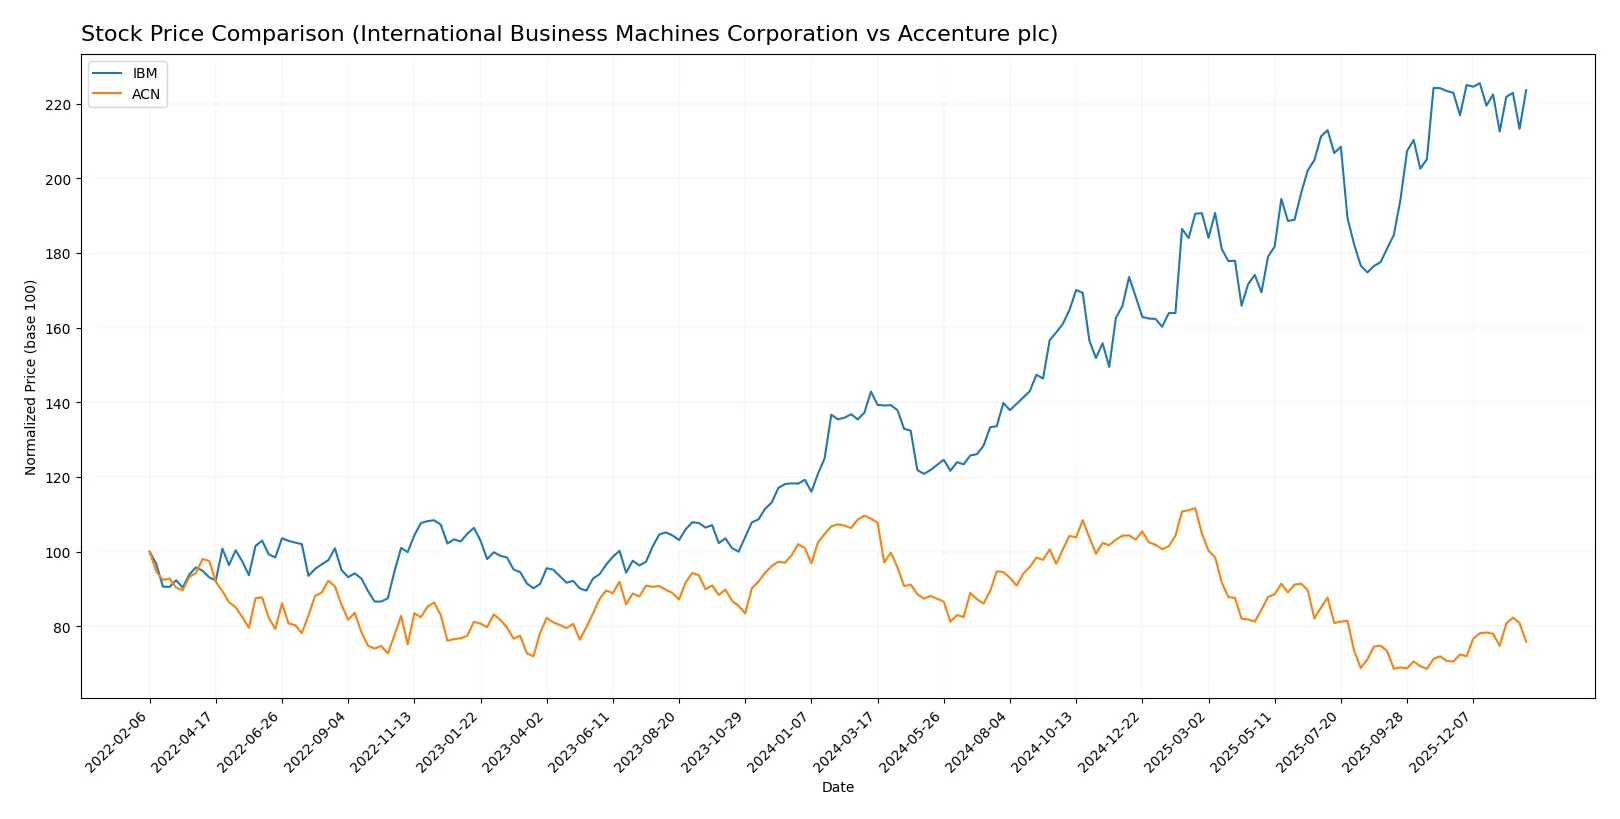
Trend Comparison
IBM’s stock rose 56.52% over the past year, marking a bullish trend with decelerating momentum and a high volatility of 43.36. The price ranged between 165.71 and 309.24.
Accenture’s stock dropped 30.29% in 12 months, reflecting a bearish trend with accelerating downside pressure. Volatility remains elevated at 41.98, with a high of 388.00 and a low of 238.39.
Comparing the two, IBM delivered the highest market performance over the year. Accenture’s recent rally has not yet offset its significant annual decline.
Target Prices
Analysts present a solid target consensus for IBM and Accenture, signaling moderate upside from current prices.
| Company | Target Low | Target High | Consensus |
|---|---|---|---|
| International Business Machines Corporation | 304 | 380 | 349.5 |
| Accenture plc | 265 | 330 | 302.93 |
The target consensus for IBM sits roughly 14% above its current price of 307, reflecting confidence in its hybrid cloud and AI segments. Accenture’s consensus exceeds its current price by about 15%, indicating optimism about its digital transformation leadership.

Don’t Let Luck Decide Your Entry Point
Optimize your entry points with our advanced ProRealTime indicators. You’ll get efficient buy signals with precise price targets for maximum performance. Start outperforming now!
How do institutions grade them?
Here is a comparison of recent grades from reputable grading companies for both firms:
International Business Machines Corporation Grades
The table below summarizes IBM’s latest grades from leading firms.
| Grading Company | Action | New Grade | Date |
|---|---|---|---|
| RBC Capital | maintain | Outperform | 2026-01-29 |
| Evercore ISI Group | maintain | Outperform | 2026-01-29 |
| UBS | maintain | Sell | 2026-01-29 |
| JP Morgan | maintain | Neutral | 2026-01-29 |
| Stifel | maintain | Buy | 2026-01-29 |
| Jefferies | maintain | Buy | 2026-01-29 |
| Wedbush | maintain | Outperform | 2026-01-29 |
| JP Morgan | maintain | Neutral | 2026-01-21 |
| Evercore ISI Group | maintain | Outperform | 2026-01-20 |
| B of A Securities | maintain | Buy | 2026-01-13 |
Accenture plc Grades
Below is a summary of Accenture’s most recent grades from recognized grading firms.
| Grading Company | Action | New Grade | Date |
|---|---|---|---|
| Wells Fargo | maintain | Equal Weight | 2026-01-14 |
| UBS | maintain | Buy | 2025-12-19 |
| Susquehanna | maintain | Neutral | 2025-12-19 |
| RBC Capital | maintain | Outperform | 2025-12-19 |
| Morgan Stanley | upgrade | Overweight | 2025-12-16 |
| Mizuho | maintain | Outperform | 2025-09-29 |
| Evercore ISI Group | maintain | Outperform | 2025-09-26 |
| BMO Capital | maintain | Market Perform | 2025-09-26 |
| TD Cowen | maintain | Buy | 2025-09-26 |
| Goldman Sachs | maintain | Buy | 2025-09-26 |
Which company has the best grades?
IBM shows a mix of Outperform, Buy, and Neutral grades with some Sell ratings, reflecting a balanced outlook. Accenture’s grades trend higher overall, with several Outperform and Buy ratings plus an upgrade to Overweight, suggesting stronger institutional confidence. Investors may interpret Accenture’s grades as more favorable for growth prospects.
Risks specific to each company
The following categories identify the critical pressure points and systemic threats facing both firms in the 2026 market environment:
1. Market & Competition
International Business Machines Corporation
- Faces pressure from cloud and AI competitors; legacy infrastructure limits agility.
Accenture plc
- Strong in digital transformation; intense competition in consulting and tech services.
2. Capital Structure & Debt
International Business Machines Corporation
- Favorable debt ratios but low liquidity ratios raise concerns about short-term financial flexibility.
Accenture plc
- Moderate debt load with healthy interest coverage and liquidity ratios ensuring financial stability.
3. Stock Volatility
International Business Machines Corporation
- Lower beta (0.7) suggests less stock volatility, appealing to risk-averse investors.
Accenture plc
- Higher beta (1.25) indicates greater volatility and market sensitivity.
4. Regulatory & Legal
International Business Machines Corporation
- Subject to US regulatory scrutiny and data privacy laws impacting software and consulting.
Accenture plc
- Faces EU and global regulations; compliance costs rising in digital and sustainability sectors.
5. Supply Chain & Operations
International Business Machines Corporation
- Complex supply chains for hardware and hybrid cloud services vulnerable to disruptions.
Accenture plc
- Operational risks from global delivery model but diversified service lines mitigate impact.
6. ESG & Climate Transition
International Business Machines Corporation
- Increasing pressure to decarbonize legacy infrastructure; ESG initiatives in early stages.
Accenture plc
- Proactive ESG strategies linked to consulting services; faces client-driven sustainability demands.
7. Geopolitical Exposure
International Business Machines Corporation
- US-centric with exposure to geopolitical tensions affecting tech exports and supply chains.
Accenture plc
- Global footprint in 50+ countries exposes it to geopolitical risks but diversifies revenue streams.
Which company shows a better risk-adjusted profile?
Accenture’s most impactful risk is geopolitical exposure from its broad global footprint, balanced by strong financial health and operational diversity. IBM’s critical risk lies in capital structure and liquidity constraints, signaling caution. I judge Accenture holds a better risk-adjusted profile, supported by its favorable Altman Z-score (5.45 vs. IBM’s 3.54) and superior profitability and efficiency metrics.
Final Verdict: Which stock to choose?
International Business Machines Corporation (IBM) wields a superpower in its robust cash generation and impressive income quality, which underpins its steady dividend yield. Its point of vigilance lies in a declining ROIC trend and moderate leverage, signaling caution for capital efficiency. IBM may suit portfolios targeting value with income emphasis.
Accenture plc (ACN) commands a strategic moat grounded in high and consistent returns on invested capital, reflecting disciplined capital allocation and operational excellence. It offers better financial stability and liquidity than IBM, albeit at a premium valuation. ACN fits well in growth-oriented portfolios with a preference for quality and resilience.
If you prioritize steady income and proven cash flow, IBM presents a compelling scenario despite some capital efficiency concerns. However, if your strategy emphasizes growth with a stronger economic moat and balance sheet stability, Accenture outshines IBM in delivering consistent value creation and operational strength. Both choices require balancing risk tolerance against growth versus income focus.
Disclaimer: Investment carries a risk of loss of initial capital. The past performance is not a reliable indicator of future results. Be sure to understand risks before making an investment decision.
Go Further
I encourage you to read the complete analyses of International Business Machines Corporation and Accenture plc to enhance your investment decisions: