Home > Comparison > Technology > ACN vs IT
The strategic rivalry between Accenture plc and Gartner, Inc. shapes the competitive landscape of the Technology sector. Accenture operates as a capital-intensive global professional services powerhouse, offering broad technology and consulting solutions. Gartner, by contrast, focuses on high-margin research and advisory services with a subscription-driven model. This analysis pits operational scale against specialized insight to determine which trajectory delivers superior risk-adjusted returns for a diversified portfolio.

Table of contents
Companies Overview
Accenture plc and Gartner, Inc. are pivotal players in the global information technology services market, each commanding significant influence.
Accenture plc: Global Leader in IT Consulting and Services
Accenture dominates as a professional services giant, generating revenue through strategy, consulting, and technology operations. Its core strength lies in delivering end-to-end digital transformation, including cloud, AI, cybersecurity, and intelligent automation. In 2026, Accenture focuses strategically on expanding its ecosystem services and advancing hybrid cloud infrastructure to maintain its innovation edge.
Gartner, Inc.: Premier Research and Advisory Firm
Gartner operates primarily as a research and advisory powerhouse, monetizing through subscription-based research, conferences, and consulting services. It provides clients with data-driven insights and actionable IT solutions, emphasizing digital transformation and IT cost optimization. Gartner’s 2026 strategy concentrates on enhancing its consulting expertise and expanding conference offerings to deepen client engagement and market influence.
Strategic Collision: Similarities & Divergences
Both companies serve the IT sector but differ fundamentally: Accenture offers hands-on technology implementation, while Gartner excels in strategic intelligence and advisory. They compete in the digital transformation space, where Accenture drives execution and Gartner informs decision-making. Their investment profiles diverge sharply—Accenture’s scale and operational breadth contrast with Gartner’s niche expertise and subscription model stability.
Income Statement Comparison
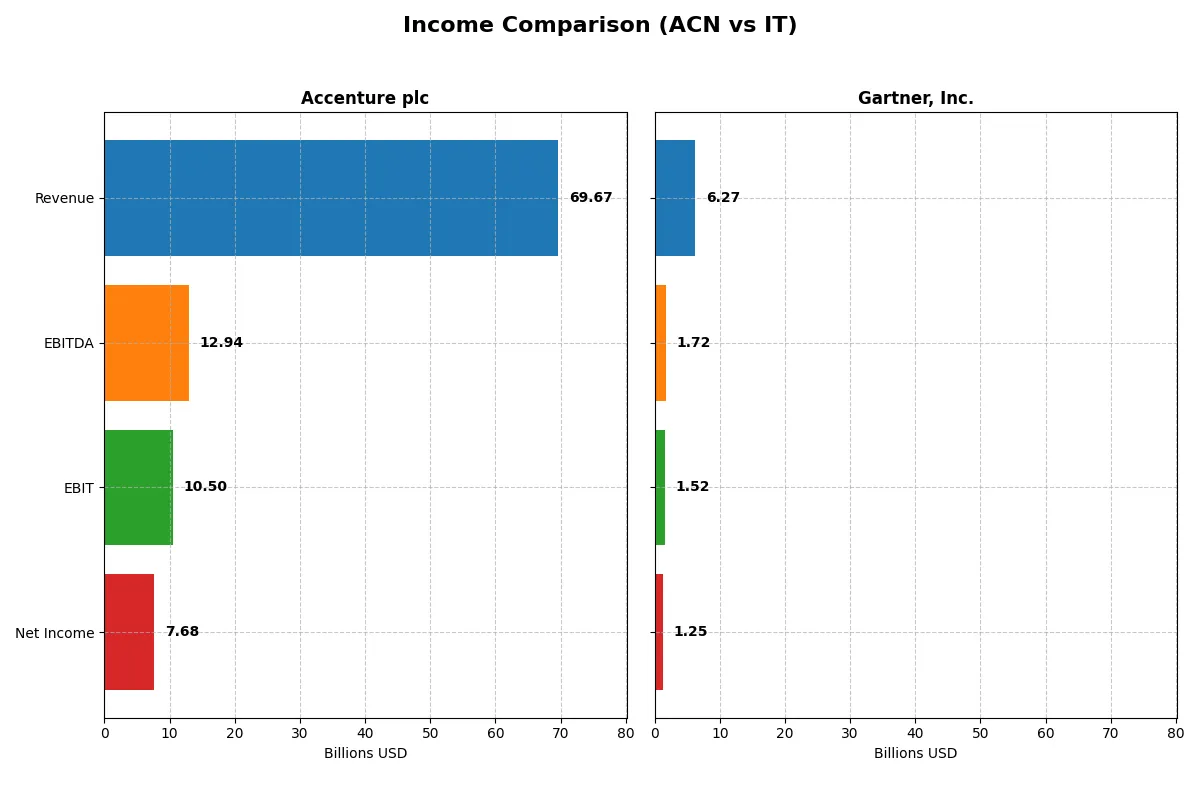
The following data dissects the core profitability and scalability of both corporate engines to reveal who dominates the bottom line:
| Metric | Accenture plc (ACN) | Gartner, Inc. (IT) |
|---|---|---|
| Revenue | 69.7B | 6.3B |
| Cost of Revenue | 47.4B | 2.0B |
| Operating Expenses | 12.0B | 3.1B |
| Gross Profit | 22.2B | 4.2B |
| EBITDA | 12.9B | 1.7B |
| EBIT | 10.5B | 1.5B |
| Interest Expense | 229M | 131M |
| Net Income | 7.7B | 1.3B |
| EPS | 12.29 | 16.12 |
| Fiscal Year | 2025 | 2024 |
Income Statement Analysis: The Bottom-Line Duel
This income statement comparison reveals the true efficiency and profitability of Accenture plc and Gartner, Inc. over their recent fiscal years.
Accenture plc Analysis
Accenture’s revenue climbed steadily from $50.5B in 2021 to $69.7B in 2025, with net income rising from $5.9B to $7.7B. Its gross margin holds firm near 32%, while net margin stabilizes around 11%, reflecting solid cost control. The 2025 fiscal year shows continued momentum with 7.4% revenue growth but a slight net margin dip, suggesting margin pressure despite overall efficiency.
Gartner, Inc. Analysis
Gartner’s revenue increased from $4.1B in 2020 to $6.3B in 2024, while net income surged from $267M to $1.25B. Gross margin impresses at nearly 68%, and net margin doubles to 20% in 2024, highlighting strong profitability. The latest year’s 6.1% revenue growth pairs with robust net margin expansion of 34%, signaling accelerating operational leverage and earnings power.
Margin Strength vs. Scale Expansion
Gartner outpaces Accenture in margin growth and net income acceleration, delivering superior profitability and earnings leverage. Accenture commands a larger revenue base with consistent growth but faces margin compression risks. Investors favor Gartner’s high-margin profile for earnings growth, while Accenture offers scale with steady efficiency.
Financial Ratios Comparison
These vital ratios act as a diagnostic tool to expose the underlying fiscal health, valuation premiums, and capital efficiency of each company:
| Ratios | Accenture plc (ACN) | Gartner, Inc. (IT) |
|---|---|---|
| ROE | 24.6% | 92.2% |
| ROIC | 17.0% | 22.4% |
| P/E | 21.2 | 30.1 |
| P/B | 5.21 | 27.7 |
| Current Ratio | 1.42 | 1.06 |
| Quick Ratio | 1.42 | 1.06 |
| D/E (Debt-to-Equity) | 0.26 | 2.13 |
| Debt-to-Assets | 12.5% | 34.0% |
| Interest Coverage | 44.7 | 8.82 |
| Asset Turnover | 1.07 | 0.73 |
| Fixed Asset Turnover | 16.2 | 12.5 |
| Payout Ratio | 48.2% | 0% |
| Dividend Yield | 2.28% | 0% |
| Fiscal Year | 2025 | 2024 |
Efficiency & Valuation Duel: The Vital Signs
Financial ratios serve as a company’s DNA, exposing hidden risks and highlighting operational excellence crucial for investment decisions.
Accenture plc
Accenture shows solid profitability with a 24.61% ROE and a healthy 11.02% net margin, indicating efficient operations. Its P/E of 21.16 suggests a fairly valued stock, though a high P/B ratio of 5.21 signals some premium pricing. The company rewards shareholders with a 2.28% dividend yield, reflecting steady cash returns.
Gartner, Inc.
Gartner posts an exceptional 92.24% ROE and a robust 20% net margin, but trades at a stretched P/E of 30.06 and an elevated P/B of 27.73, indicating expensive valuation. The absence of dividends points to reinvestment in growth, supported by a strong 22.39% ROIC, but higher leverage raises caution.
Balanced Value vs. High-Growth Premium
Accenture offers a balanced profile with strong profitability, moderate valuation, and consistent dividends. Gartner’s metrics reveal impressive returns but come with stretched valuation and higher risk. Investors seeking stability may prefer Accenture, while those targeting growth might lean toward Gartner’s aggressive profile.
Which one offers the Superior Shareholder Reward?
I compare Accenture plc (ACN) and Gartner, Inc. (IT) on shareholder return strategies. Accenture pays a 2.28% dividend yield with a sustainable 48% payout ratio, supported by strong free cash flow of 17.4B. It also executes consistent buybacks, enhancing total returns. Gartner, by contrast, pays no dividends, reinvesting all cash into growth and acquisitions, fueling a robust 20% net margin but burdened by high leverage (debt-to-equity 2.13x). Its buyback activity is limited, reflecting a reinvestment-heavy model. Historically, dividend plus buyback models like Accenture’s offer steadier, risk-adjusted returns, especially amid market cycles. I find Accenture’s balanced distribution and capital allocation more sustainable and rewarding for 2026 investors.
Comparative Score Analysis: The Strategic Profile
The radar chart reveals the fundamental DNA and trade-offs of Accenture plc and Gartner, Inc., highlighting their financial strengths and vulnerabilities:
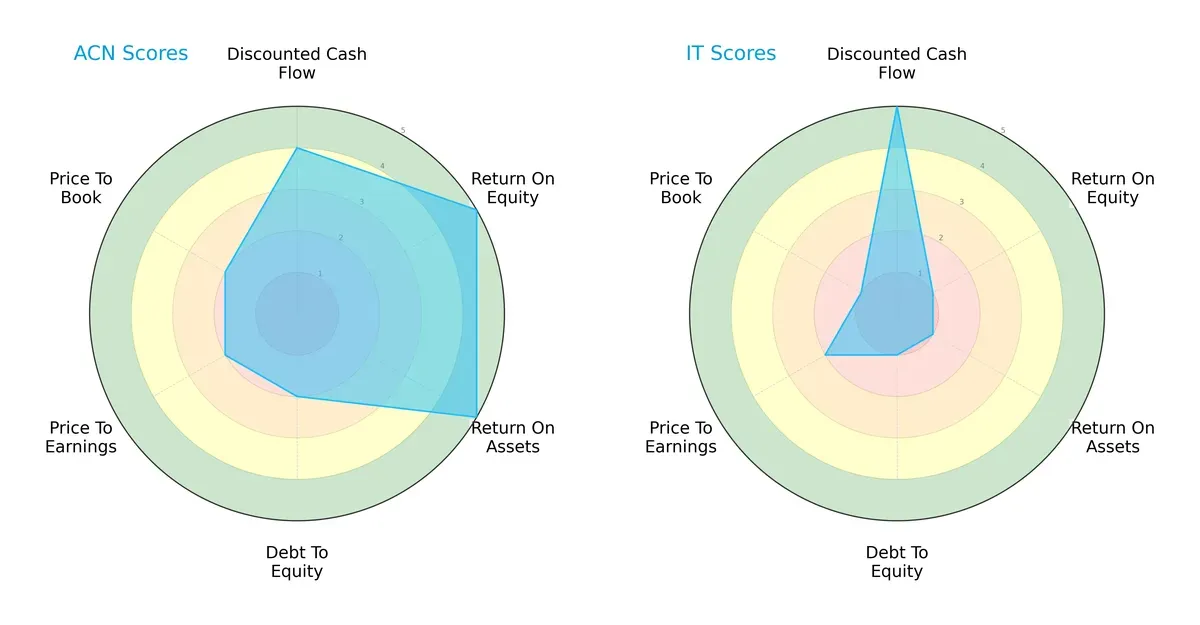
Accenture delivers a balanced profile with strong ROE (5) and ROA (5), signaling efficient capital use and asset management. However, its moderate Debt/Equity (2) and valuation scores (PE/PB at 2) suggest cautious leverage and valuation risk. Gartner shows a strong DCF score (5), indicating robust future cash flow, but suffers from very unfavorable profitability (ROE and ROA at 1) and high financial risk (Debt/Equity at 1). Accenture’s well-rounded metrics position it as the more stable choice, while Gartner relies heavily on its cash flow strength with notable operational and leverage weaknesses.
Bankruptcy Risk: Solvency Showdown
The Altman Z-Score gap distinctly favors Accenture, implying stronger long-term solvency and resilience in the current cycle:
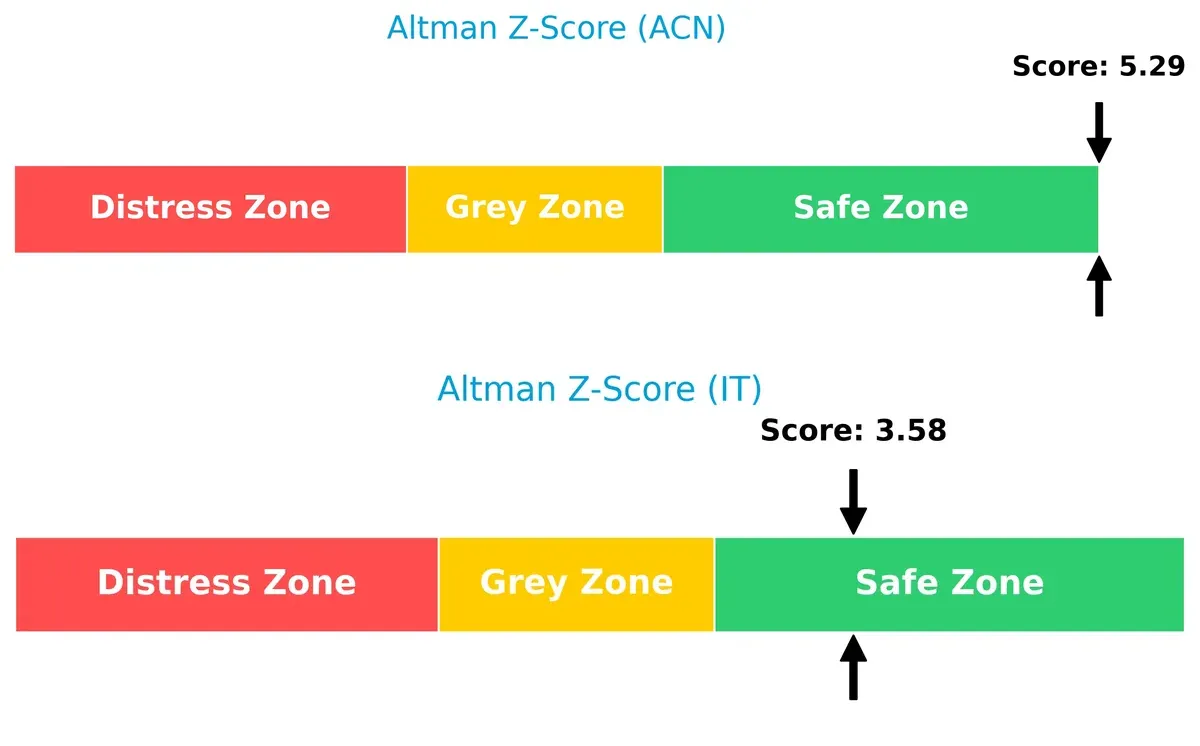
Accenture’s score of 5.29 places it comfortably in the safe zone, signaling low bankruptcy risk. Gartner’s 3.58 also qualifies as safe but is on the lower end, reflecting moderate vulnerability if market conditions deteriorate.
Financial Health: Quality of Operations
Both firms show average Piotroski F-Scores, but Accenture slightly outperforms Gartner, indicating marginally superior operational quality and fewer internal red flags:
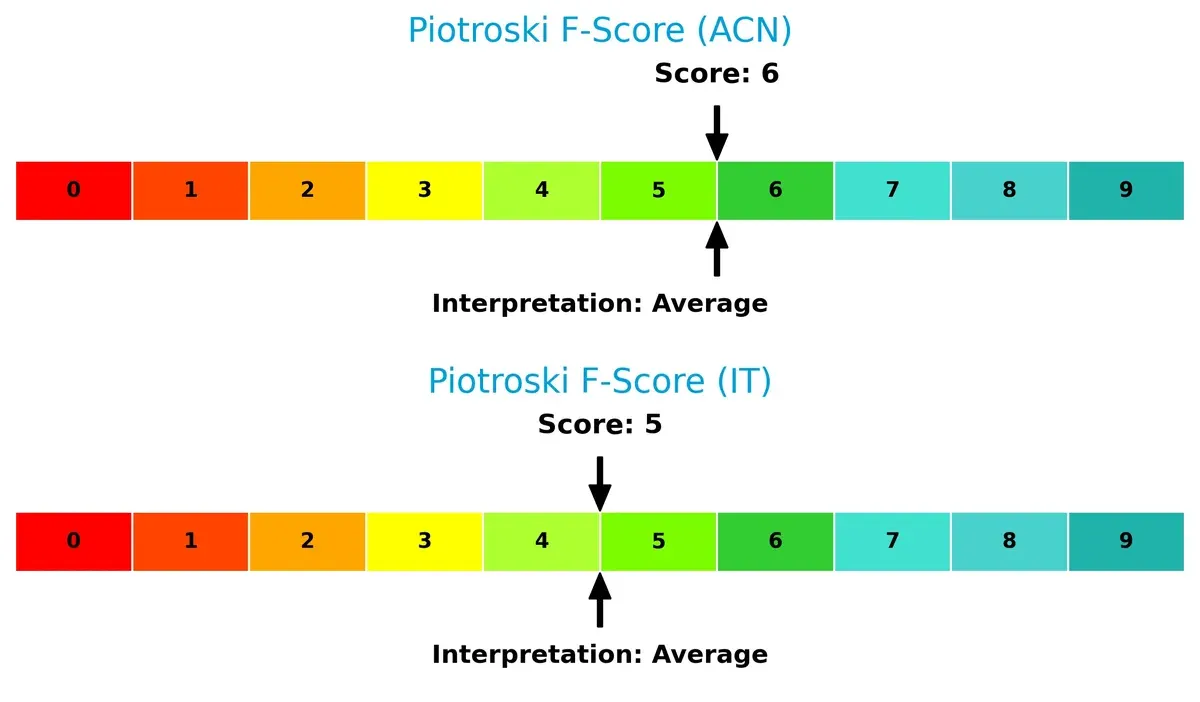
Accenture’s score of 6 suggests solid financial health, while Gartner’s 5 points to average strength with some areas needing improvement. Neither firm shows critical distress, but Accenture demonstrates greater consistency in profitability, leverage, and liquidity metrics.
How are the two companies positioned?
This section dissects the operational DNA of Accenture and Gartner by comparing their revenue distribution and internal dynamics. The goal is to confront their economic moats and identify which model offers the most resilient competitive advantage today.
Revenue Segmentation: The Strategic Mix
This visual comparison dissects how both Accenture plc and Gartner, Inc. diversify their income streams and where their primary sector bets lie:
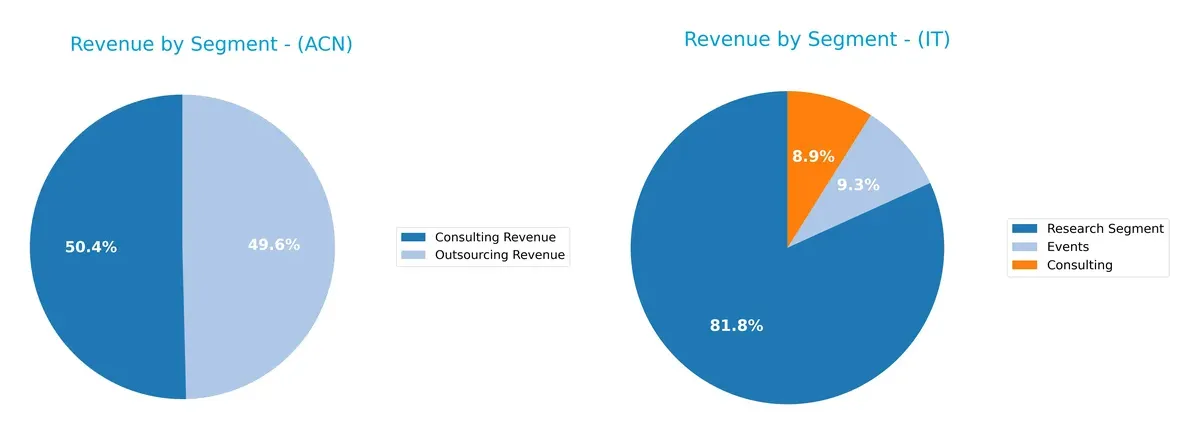
Accenture anchors its revenue in two massive segments: Consulting at $35B and Outsourcing near $35B, showing a balanced but concentrated model. Gartner pivots heavily on its Research Segment at $5.1B, dwarfing Consulting ($559M) and Events ($583M). Accenture’s dual focus suggests strong ecosystem lock-in with diversified services, while Gartner’s concentration in research heightens dependency risks but cements infrastructure dominance in market intelligence.
Strengths and Weaknesses Comparison
This table compares the Strengths and Weaknesses of Accenture plc and Gartner, Inc.:
Accenture plc Strengths
- Strong diversification across Consulting and Outsourcing revenues
- Favorable profitability with 11.02% net margin and 16.99% ROIC
- Solid balance sheet with low debt-to-assets (12.51%) and high interest coverage (45.94)
- Global presence with significant revenues in North America and Europe
- High asset turnover indicating efficient use of assets
- Consistent dividend yield of 2.28%
Gartner, Inc. Strengths
- High profitability with 20% net margin and exceptional 92.24% ROE
- Favorable ROIC (22.39%) exceeding WACC (7.78%)
- Innovation focus in Research segment generating over 5B revenue
- Strong market position in the US and EMEA regions
- Favorable fixed asset turnover (12.53)
- Quick ratio supports good short-term liquidity
Accenture plc Weaknesses
- Unfavorable price-to-book ratio (5.21) indicating potential overvaluation
- Neutral current ratio (1.42) suggests moderate liquidity buffer
- Moderate PE ratio (21.16) may limit upside compared to sector peers
- Heavy reliance on North America and Europe markets with less exposure to Growth Markets
- Limited visibility on innovation product segmentation
- Outsourcing revenue growth slower than Consulting
Gartner, Inc. Weaknesses
- Unfavorable valuation multiples with high PE (30.06) and PB (27.73)
- High debt-to-equity (2.13) increases financial risk
- Dividend yield at 0% may deter income-focused investors
- Asset turnover (0.73) lags industry efficiency standards
- Concentrated revenue streams with heavy dependence on Research segment
- Neutral current ratio (1.06) limits liquidity flexibility
Both companies show strong profitability and global reach but face valuation and capital structure challenges. Accenture benefits from broader service diversification, while Gartner’s strengths lie in higher margins and research innovation. Each must balance growth investments with financial prudence amid market pressures.
The Moat Duel: Analyzing Competitive Defensibility
A structural moat shields long-term profits from relentless competition, making it the ultimate defense for sustainable earnings:
Accenture plc: Expertise-Driven Consulting Moat
Accenture leverages intangible assets and deep client relationships. Its ROIC exceeds WACC by 7.7%, signaling value creation despite a recent decline. Expansion in digital services may deepen this moat.
Gartner, Inc.: Subscription Network Effects Moat
Gartner’s moat arises from its subscription-based research network, driving high margins and a 14.6% ROIC premium over WACC. Its rising ROIC trend reflects durable competitive strength with growth in advisory services.
Intangible Assets vs. Network Effects: The Moat Showdown
Gartner boasts a wider and deepening moat with rapid profitability gains, while Accenture creates value but faces margin pressure. Gartner is better positioned to defend market share through scalable subscription models.
Which stock offers better returns?
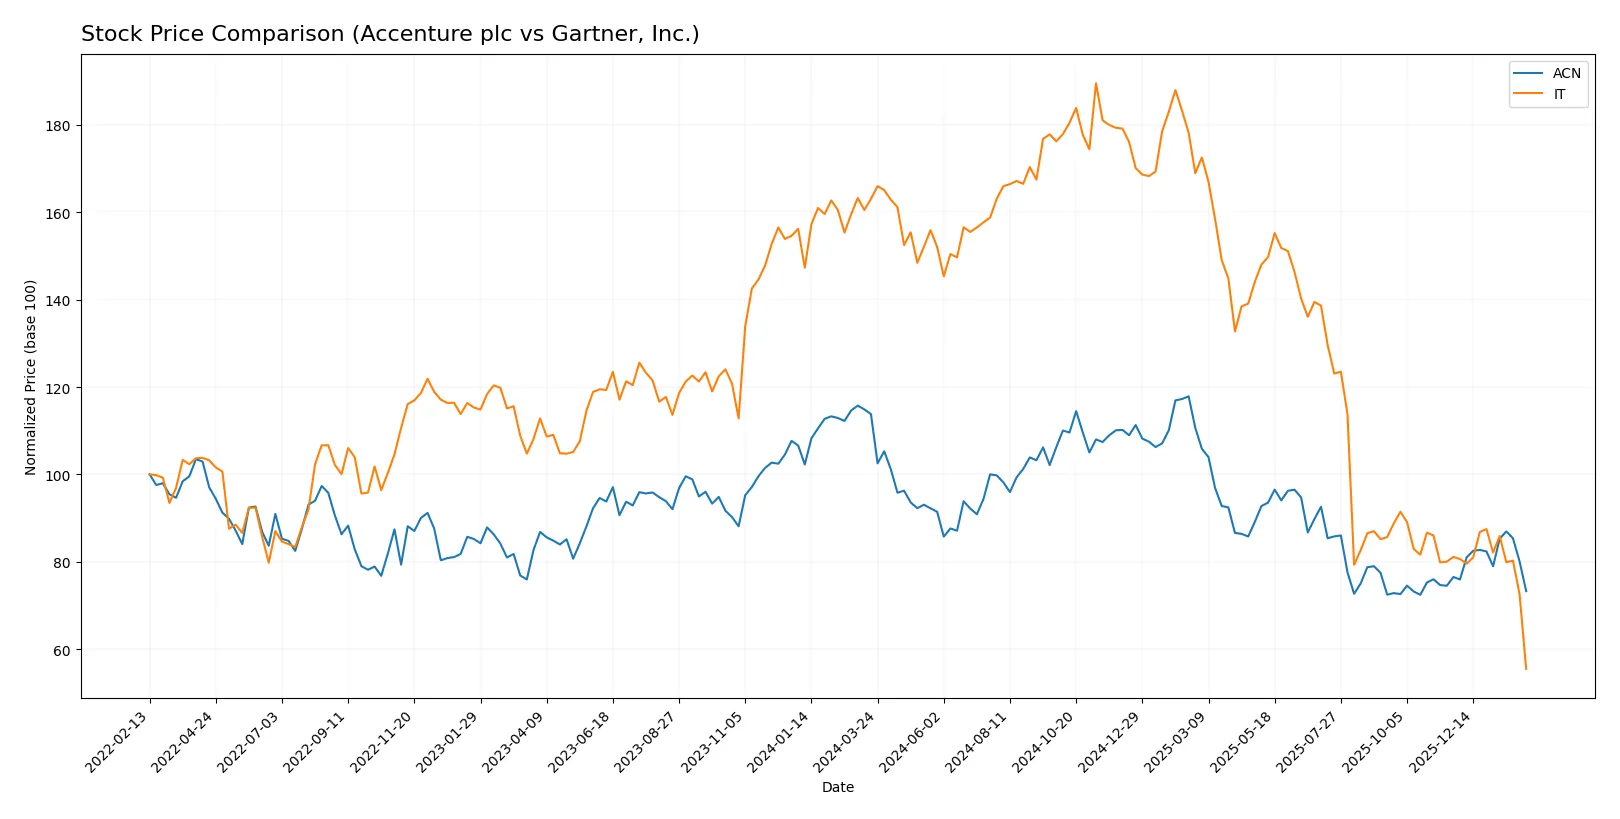
The past year shows a pronounced downtrend for both stocks, with Accenture’s decline accelerating while Gartner’s drop decelerates after a steep fall.
Trend Comparison
Accenture plc’s stock fell 35.61% over the past year, marking a clear bearish trend with accelerating losses and a high standard deviation of 41.93. The price ranged between 238.39 and 388.0.
Gartner, Inc. experienced a sharper 65.99% decline, signaling a bearish trend with decelerating losses. Volatility was extreme, with a standard deviation of 108.27, and prices fluctuated between 160.16 and 547.4.
Comparing both, Gartner’s stock delivered the largest negative return, underperforming Accenture amid greater volatility and deceleration in price decline.
Target Prices
Analysts present a cautiously optimistic target consensus for Accenture plc and Gartner, Inc.
| Company | Target Low | Target High | Consensus |
|---|---|---|---|
| Accenture plc | 265 | 330 | 302.93 |
| Gartner, Inc. | 231 | 300 | 265 |
Accenture’s consensus target exceeds its current price by 25%, signaling upside potential despite recent weakness. Gartner’s target price suggests a 65% gain, indicating strong analyst confidence amidst market volatility.

Don’t Let Luck Decide Your Entry Point
Optimize your entry points with our advanced ProRealTime indicators. You’ll get efficient buy signals with precise price targets for maximum performance. Start outperforming now!
How do institutions grade them?
Accenture plc Grades
The following table summarizes Accenture’s recent institutional grades from major analysts.
| Grading Company | Action | New Grade | Date |
|---|---|---|---|
| Wells Fargo | Maintain | Equal Weight | 2026-01-14 |
| Susquehanna | Maintain | Neutral | 2025-12-19 |
| RBC Capital | Maintain | Outperform | 2025-12-19 |
| UBS | Maintain | Buy | 2025-12-19 |
| Morgan Stanley | Upgrade | Overweight | 2025-12-16 |
| Mizuho | Maintain | Outperform | 2025-09-29 |
| JP Morgan | Maintain | Overweight | 2025-09-26 |
| Guggenheim | Maintain | Buy | 2025-09-26 |
| TD Cowen | Maintain | Buy | 2025-09-26 |
| Baird | Maintain | Outperform | 2025-09-26 |
Gartner, Inc. Grades
Here is a summary of Gartner’s latest institutional grades from recognized grading firms.
| Grading Company | Action | New Grade | Date |
|---|---|---|---|
| UBS | Maintain | Neutral | 2026-01-09 |
| Morgan Stanley | Maintain | Equal Weight | 2025-12-17 |
| BMO Capital | Maintain | Market Perform | 2025-11-06 |
| Goldman Sachs | Maintain | Buy | 2025-11-05 |
| UBS | Maintain | Neutral | 2025-11-05 |
| Wells Fargo | Maintain | Underweight | 2025-11-05 |
| Barclays | Maintain | Equal Weight | 2025-11-05 |
| Wells Fargo | Maintain | Underweight | 2025-10-29 |
| Barclays | Downgrade | Equal Weight | 2025-10-22 |
| UBS | Maintain | Neutral | 2025-10-06 |
Which company has the best grades?
Accenture holds consistently stronger grades, including multiple Buy and Outperform ratings. Gartner’s grades lean more neutral and underweight, indicating less bullish sentiment. Investors may interpret Accenture’s grades as a sign of higher analyst confidence.
Risks specific to each company
The following categories identify the critical pressure points and systemic threats facing both firms in the 2026 market environment:
1. Market & Competition
Accenture plc
- Faces intense competition in technology consulting and digital transformation, but benefits from a diverse global client base.
Gartner, Inc.
- Operates in a niche advisory segment with strong brand but exposed to disruption from new digital research models.
2. Capital Structure & Debt
Accenture plc
- Maintains a low debt-to-equity ratio (0.26), signaling strong balance sheet and manageable leverage.
Gartner, Inc.
- Carries high debt-to-equity (2.13), increasing financial risk despite adequate interest coverage.
3. Stock Volatility
Accenture plc
- Beta of 1.236 indicates above-market volatility, reflecting sensitivity to tech sector swings.
Gartner, Inc.
- Lower beta at 1.036 suggests relatively less price fluctuation but still exposed to market risks.
4. Regulatory & Legal
Accenture plc
- Operates globally, facing complex regulatory environments but has robust compliance frameworks.
Gartner, Inc.
- Primarily US-focused, with some international exposure, less diversified regulatory risk.
5. Supply Chain & Operations
Accenture plc
- Complex global operations and technology delivery models create operational risks amid geopolitical tensions.
Gartner, Inc.
- Relies heavily on intellectual capital and data, with lower physical supply chain risks.
6. ESG & Climate Transition
Accenture plc
- Actively invests in sustainability consulting, positioning well for ESG-driven demand and risk mitigation.
Gartner, Inc.
- ESG efforts less pronounced, potentially lagging in adapting to rising investor and client expectations.
7. Geopolitical Exposure
Accenture plc
- Significant international presence exposes it to global geopolitical risks including trade tensions and sanctions.
Gartner, Inc.
- More concentrated in North America, reducing but not eliminating geopolitical risk exposure.
Which company shows a better risk-adjusted profile?
Accenture faces market volatility and geopolitical risks but benefits from a strong balance sheet and diversified operations. Gartner’s elevated debt and valuation multiples heighten financial risk despite niche market strength. Accenture’s low leverage and favorable profitability suggest a superior risk-adjusted profile in 2026. Notably, Gartner’s debt-to-equity ratio above 2 signals caution amid its recent 21% stock decline.
Final Verdict: Which stock to choose?
Accenture’s superpower lies in its robust operational efficiency and consistent value creation despite a slight dip in profitability. Its strong balance sheet and diversified business model make it a solid candidate for portfolios seeking steady, long-term growth. The main point of vigilance is its premium valuation, which could temper near-term upside. It fits well with an Aggressive Growth portfolio aiming for reliable cash flow and operational resilience.
Gartner’s strategic moat stems from its commanding presence in market research and advisory services, generating recurring revenues that underpin its durable competitive advantage. While it carries higher leverage and a riskier balance sheet than Accenture, Gartner offers greater upside potential fueled by accelerating profitability and expanding returns on invested capital. This profile suits a GARP (Growth at a Reasonable Price) investor focused on companies with both growth momentum and a defensible market position.
If you prioritize operational stability and consistent cash generation, Accenture is the compelling choice due to its prudent capital allocation and favorable financial metrics. However, if you seek rapid growth with a durable competitive advantage and can tolerate higher risk, Gartner offers better stability in profitability growth and expanding economic moats. Both scenarios require careful monitoring of valuation and balance sheet health to manage downside risks effectively.
Disclaimer: Investment carries a risk of loss of initial capital. The past performance is not a reliable indicator of future results. Be sure to understand risks before making an investment decision.
Go Further
I encourage you to read the complete analyses of Accenture plc and Gartner, Inc. to enhance your investment decisions: