Home > Comparison > Technology > ACN vs FISV
The strategic rivalry between Accenture plc and Fiserv, Inc. shapes the evolution of the technology services sector. Accenture operates as a global consulting and digital transformation powerhouse, while Fiserv specializes in payment and financial services technology. This head-to-head highlights the contrast between broad-based innovation and niche fintech expertise. This analysis aims to identify which company offers a superior risk-adjusted profile for investors seeking diversified exposure in technology services.
Table of contents
Companies Overview
Accenture plc and Fiserv, Inc. stand as pivotal players in the global information technology services market.
Accenture plc: Global Leader in Digital Transformation
Accenture dominates the professional services sector with a diversified portfolio spanning strategy consulting, technology operations, and intelligent automation. Its revenue engine relies heavily on digital transformation, cloud services, and cybersecurity offerings. In 2026, the company strategically focused on expanding its AI capabilities and hybrid cloud infrastructure to maintain competitive advantage.
Fiserv, Inc.: Innovator in Payment and Financial Technology
Fiserv specializes in payment processing and financial services technology, generating revenue through merchant acquiring, digital banking, and card transaction services. Its strategic emphasis in 2026 centers on enhancing omnichannel commerce platforms and security solutions to capture growing demand in fintech and digital payments markets.
Strategic Collision: Similarities & Divergences
Both firms operate in technology services, yet Accenture pursues a broad, consulting-driven model while Fiserv targets fintech-specific infrastructure. Their primary battleground lies in digital transformation and payment ecosystems. Accenture’s scale and consulting breadth contrast with Fiserv’s niche focus and fintech innovation, creating distinct investment profiles shaped by market scope and specialization.
Income Statement Comparison
This data dissects the core profitability and scalability of both corporate engines to reveal who dominates the bottom line:
| Metric | Accenture plc (ACN) | Fiserv, Inc. (FISV) |
|---|---|---|
| Revenue | 69.7B | 20.5B |
| Cost of Revenue | 47.4B | 8.0B |
| Operating Expenses | 12.0B | 6.6B |
| Gross Profit | 22.2B | 12.4B |
| EBITDA | 12.9B | 8.8B |
| EBIT | 10.5B | 5.7B |
| Interest Expense | 229M | 1.2B |
| Net Income | 7.7B | 3.1B |
| EPS | 12.29 | 5.41 |
| Fiscal Year | 2025 | 2024 |
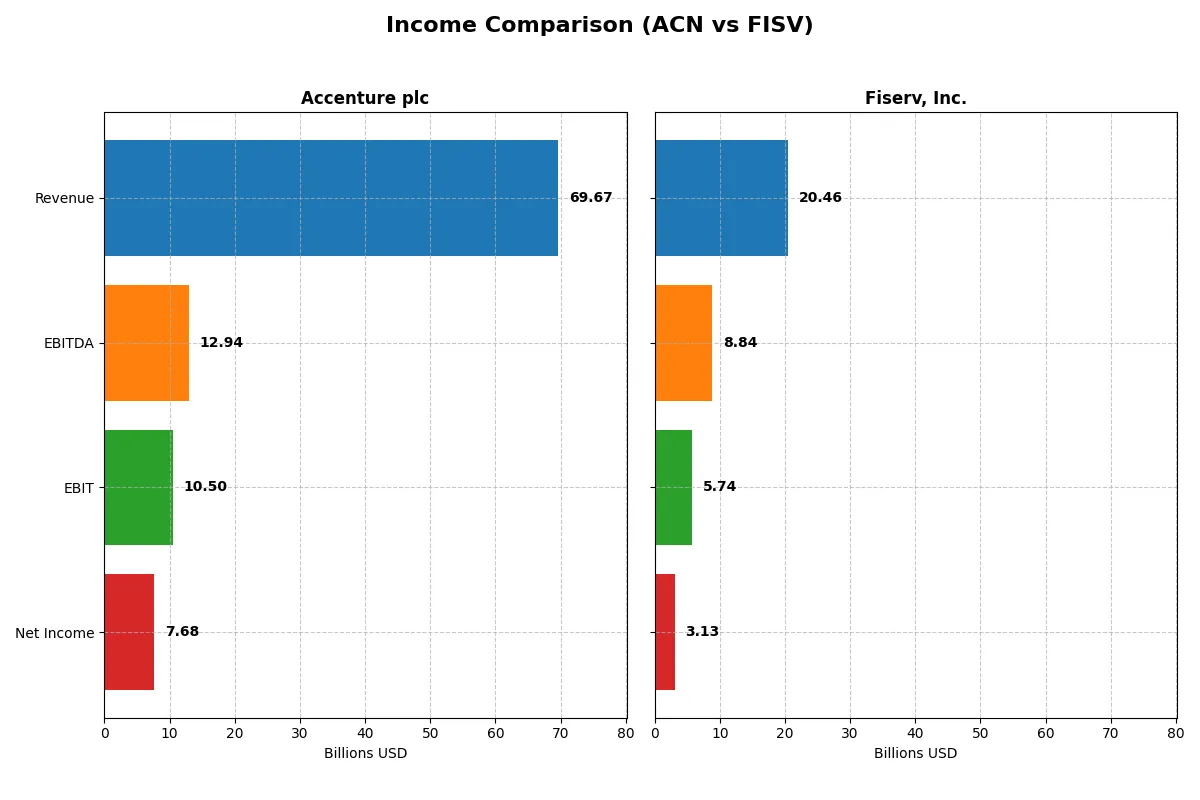
Income Statement Analysis: The Bottom-Line Duel
This income statement comparison reveals which company runs a more efficient and profitable corporate engine through revenue and margin dynamics.
Accenture plc Analysis
Accenture’s revenue climbed steadily from $50.5B in 2021 to $69.7B in 2025, with net income rising from $5.9B to $7.7B. Gross margin remains healthy at nearly 32%, while net margin hovers around 11%. The 2025 figures show solid operating efficiency but a slight dip in net margin, signaling tightening profitability despite revenue growth.
Fiserv, Inc. Analysis
Fiserv grew revenue from $14.9B in 2020 to $20.5B in 2024, with net income surging from $958M to $3.1B. Gross margin exceeds 60%, and net margin stands at a robust 15.3%. The 2024 results reflect strong operating leverage and margin expansion, driving exceptional bottom-line momentum in a competitive fintech landscape.
Margin Power vs. Revenue Scale
Fiserv’s superior margins and explosive net income growth outpace Accenture’s steady revenue expansion and margin stability. While Accenture boasts scale and consistent profitability, Fiserv’s high margins and rapid earnings growth mark it as the more fundamentally efficient operator. Investors prioritizing margin strength and earnings acceleration may find Fiserv’s profile more compelling.
Financial Ratios Comparison
These vital ratios act as a diagnostic tool to expose the underlying fiscal health, valuation premiums, and capital efficiency of the companies compared below:
| Ratios | Accenture plc (ACN) | Fiserv, Inc. (FISV) |
|---|---|---|
| ROE | 24.6% | 11.6% |
| ROIC | 17.0% | 8.7% |
| P/E | 21.2 | 38.0 |
| P/B | 5.21 | 4.39 |
| Current Ratio | 1.42 | 1.06 |
| Quick Ratio | 1.42 | 1.06 |
| D/E (Debt-to-Equity) | 0.26 | 0.92 |
| Debt-to-Assets | 12.5% | 32.3% |
| Interest Coverage | 44.7 | 4.7 |
| Asset Turnover | 1.07 | 0.27 |
| Fixed Asset Turnover | 16.2 | 8.62 |
| Payout ratio | 48.2% | 0% |
| Dividend yield | 2.28% | 0% |
| Fiscal Year | 2025 | 2024 |
Efficiency & Valuation Duel: The Vital Signs
Financial ratios act as a company’s DNA, exposing hidden risks and operational strengths crucial for investment decisions.
Accenture plc
Accenture displays strong profitability with a 24.6% ROE and an 11.0% net margin, reflecting operational efficiency. Its P/E of 21.2 suggests a fairly priced stock, though a high PB of 5.2 signals premium valuation. Shareholders benefit from a 2.3% dividend yield, indicating steady returns alongside disciplined capital allocation.
Fiserv, Inc.
Fiserv shows a higher net margin at 15.3% but a modest 11.6% ROE, pointing to less efficient equity use. The stock trades at a stretched P/E of 38.0, indicating expensive valuation relative to earnings. The absence of dividends highlights reinvestment in growth or R&D, but leverage and asset turnover remain concerns.
Premium Valuation vs. Operational Safety
Accenture balances strong returns with reasonable valuation and reliable dividends, delivering operational safety. Fiserv’s high P/E and lack of dividends imply greater risk without immediate shareholder income. Investors seeking steady income and efficiency may prefer Accenture’s profile, while growth-focused investors might tolerate Fiserv’s stretched metrics.
Which one offers the Superior Shareholder Reward?
I compare Accenture plc (ACN) and Fiserv, Inc. (FISV) on their shareholder return strategies. ACN offers a 2.28% dividend yield with a 48% payout ratio, well-covered by a strong free cash flow of $17.4/share, and maintains steady buybacks enhancing total returns. FISV pays no dividends, focusing on reinvestment with a robust free cash flow of $8.7/share but carries higher leverage (debt/equity 0.92) and modest buyback activity. Historically, ACN’s balanced dividend and buyback approach shows higher sustainability and shareholder value in tech services. I favor ACN for superior total return potential in 2026.
Comparative Score Analysis: The Strategic Profile
The radar chart reveals the fundamental DNA and strategic trade-offs that define Accenture plc and Fiserv, Inc.:
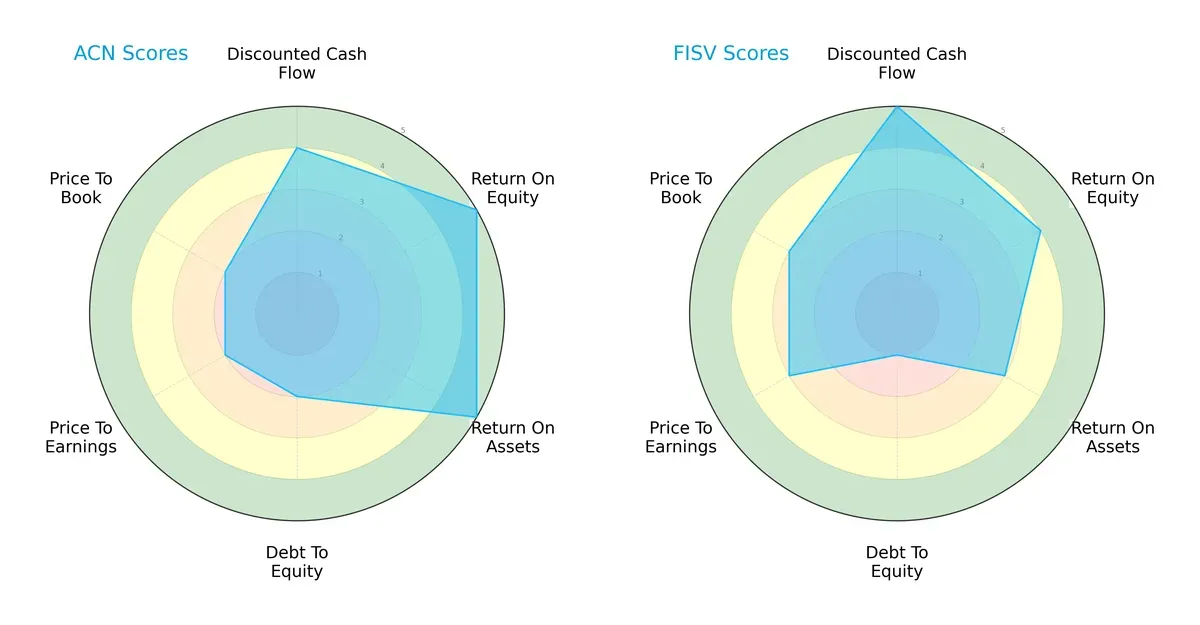
Accenture shows a balanced profile with strong ROE (5) and ROA (5), but moderate leverage and valuation scores (2 each). Fiserv leans heavily on discounted cash flow strength (5) but suffers from a weak debt-to-equity score (1), signaling higher financial risk. Accenture’s diversified strengths suggest a more stable investment, while Fiserv relies on cash flow advantages amid financial leverage concerns.
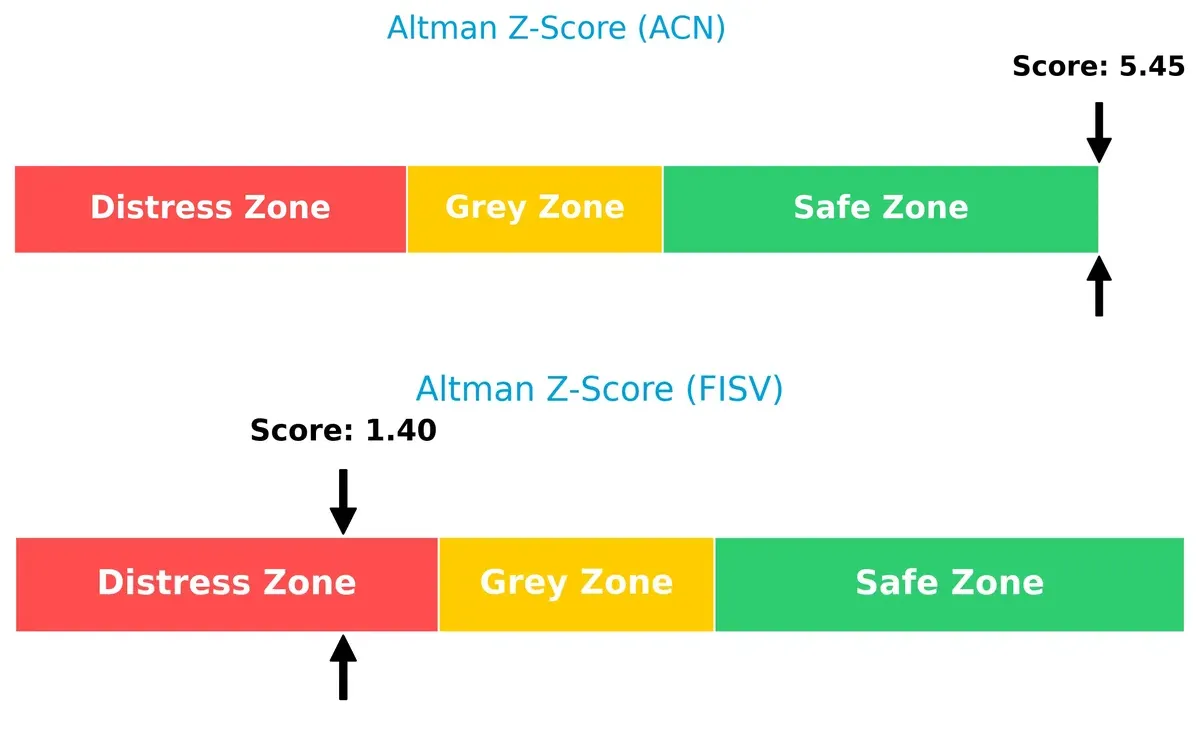
Bankruptcy Risk: Solvency Showdown
Accenture’s Altman Z-Score of 5.45 places it safely in the secure zone, indicating robust solvency and low bankruptcy risk. Fiserv’s 1.40 score signals distress, suggesting vulnerability in this economic cycle:
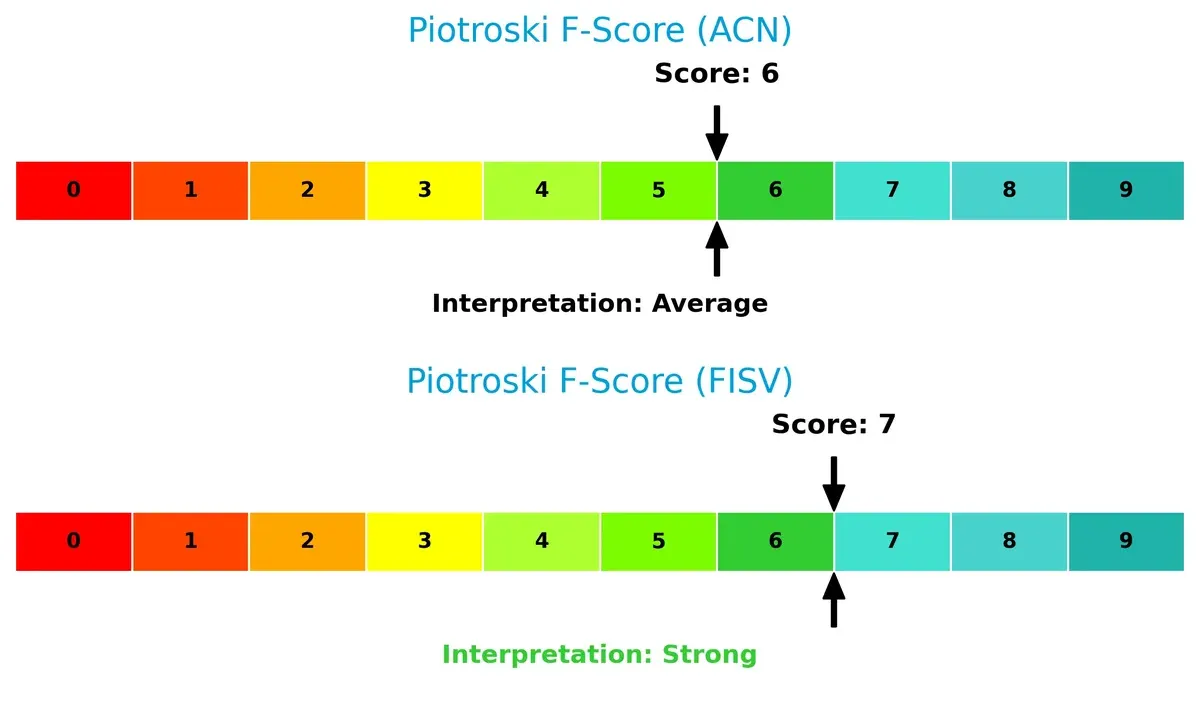
Financial Health: Quality of Operations
Fiserv’s Piotroski F-Score of 7 shows stronger internal operational health versus Accenture’s 6, which is average. This indicates that Fiserv maintains better profitability and efficiency metrics, despite its solvency challenges:
How are the two companies positioned?
This section dissects Accenture and Fiserv’s operational DNA by comparing revenue distribution and internal strengths and weaknesses. The goal is to confront their economic moats to reveal which model delivers the most resilient, sustainable competitive advantage today.
Revenue Segmentation: The Strategic Mix
This visual comparison dissects how Accenture plc and Fiserv, Inc. diversify their income streams and where their primary sector bets lie:
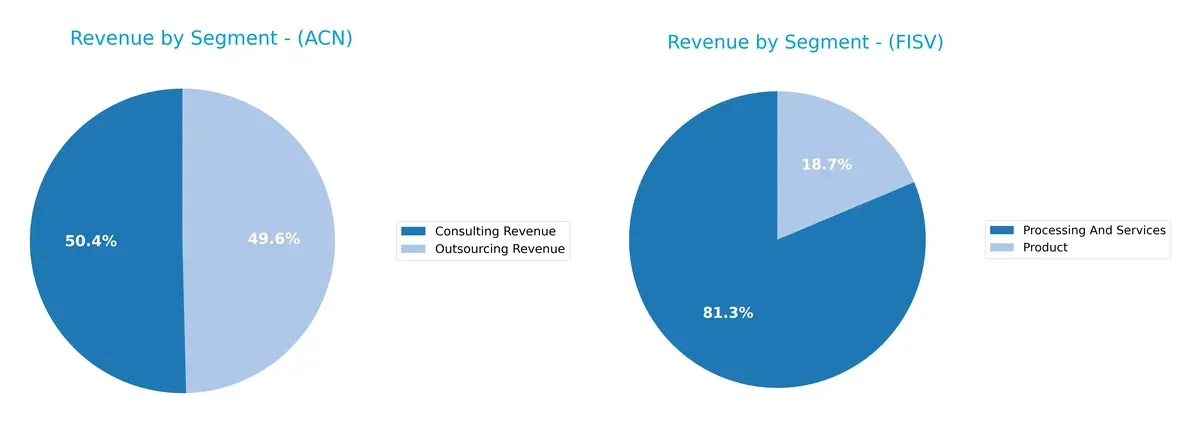
Accenture anchors its 2025 revenue around Consulting ($35.1B) and Outsourcing ($34.6B), showing a balanced focus on services. In contrast, Fiserv pivots heavily on Processing and Services ($16.6B) with a smaller Product segment ($3.8B), indicating concentration risk. Accenture’s diversified portfolio across consulting and outsourcing reduces dependency on any single stream, while Fiserv’s dominance in processing highlights infrastructure reliance and ecosystem lock-in.
Strengths and Weaknesses Comparison
This table compares the Strengths and Weaknesses of Accenture plc and Fiserv, Inc.:
Accenture plc Strengths
- Broad revenue diversification across consulting, outsourcing, and multiple industries
- Strong profitability with favorable net margin, ROE, and ROIC
- Solid financial health with low debt-to-assets and high interest coverage
- Global presence with significant revenues in North America, Europe, and Growth Markets
Fiserv, Inc. Strengths
- Higher net margin indicating operational efficiency
- Favorable WACC suggesting lower capital cost
- Positive quick ratio supports liquidity
- Product segment showing steady revenue contribution
Accenture plc Weaknesses
- Unfavorable price-to-book ratio may indicate overvaluation
- Neutral current ratio suggests moderate short-term liquidity
- Limited product revenue compared to services
- Price-to-earnings ratio neutral, not indicating strong market premium
Fiserv, Inc. Weaknesses
- Unfavorable price-to-earnings and price-to-book ratios imply valuation concerns
- Lower ROE and ROIC limit profitability strength
- Higher debt-to-assets ratio and weak interest coverage raise financial risk
- Low asset turnover signals inefficient asset use
- No dividend yield reduces income appeal
Accenture’s strengths lie in diversified revenue streams and strong profitability metrics, supporting its global strategy. Fiserv shows operational efficiency but faces valuation and financial structure challenges that may impact future growth and risk management.
The Moat Duel: Analyzing Competitive Defensibility
A structural moat is the only reliable shield protecting long-term profits from relentless competitive erosion in dynamic markets:
Accenture plc: Intangible Assets and Scale Advantage
Accenture’s moat centers on intangible assets like brand and expertise, showing stable 31.9% gross margins and 15.1% EBIT margins. Its vast global reach and consulting scale underpin high ROIC but face margin pressure from rising costs in 2026.
Fiserv, Inc.: Network Effects and Operational Efficiency
Fiserv’s moat relies on network effects in payments and fintech platforms, delivering superior 60.8% gross margins and 28.1% EBIT margins. Its ROIC growth signals expanding value creation, positioning it to capitalize on fintech innovations and cross-selling opportunities.
Intangible Assets vs. Network Effects: The Moat Showdown
Fiserv’s rising ROIC and margin dominance reveal a deeper, more durable moat than Accenture’s scale-based advantage, which shows signs of profitability pressure. Fiserv appears better equipped to defend and expand market share in 2026.
Which stock offers better returns?
The past year reveals sharp declines for both Accenture plc and Fiserv, Inc., with Accenture showing some recent recovery while Fiserv’s trend remains subdued.
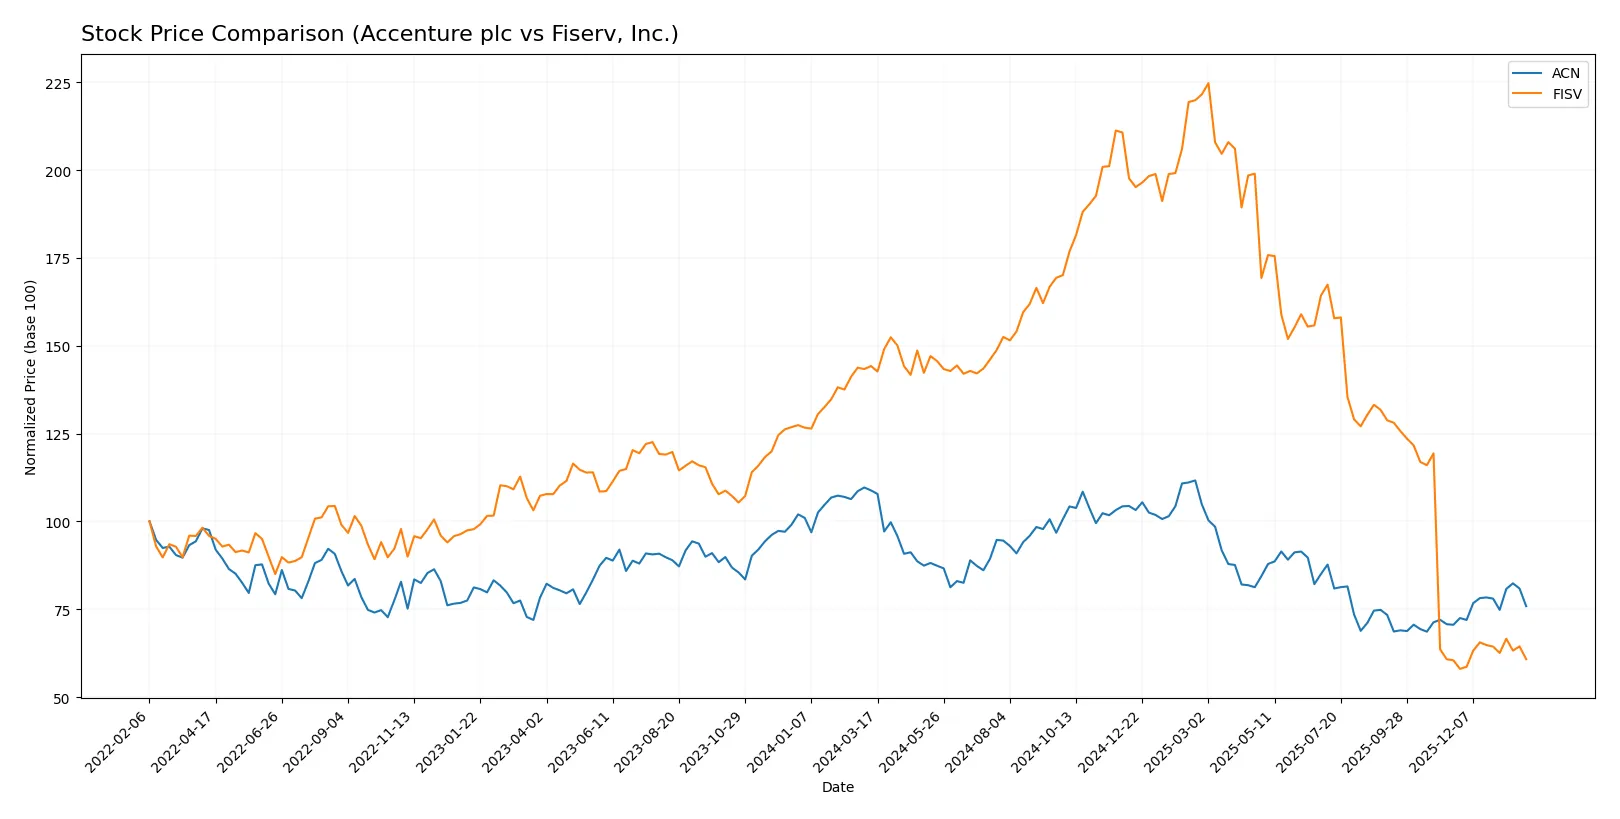
Trend Comparison
Accenture plc’s stock declined 30.29% over the past year, marking a bearish trend with accelerating losses. Recent months show a 7.52% rebound, indicating emerging positive momentum.
Fiserv, Inc. experienced a steeper 57.86% drop, confirming a bearish trend with accelerating decline. Its recent 0.49% gain signals a near-neutral short-term trend with minimal recovery.
Comparing both, Accenture’s smaller overall loss and stronger recent rebound give it higher market performance than Fiserv during the analyzed period.
Target Prices
Analysts present a mixed but generally optimistic target consensus for Accenture plc and Fiserv, Inc.
| Company | Target Low | Target High | Consensus |
|---|---|---|---|
| Accenture plc | 265 | 330 | 302.93 |
| Fiserv, Inc. | 62 | 180 | 105.61 |
Accenture’s consensus target of $303 suggests a ~15% upside from its current $264 price. Fiserv’s target implies a more volatile outlook, with a consensus nearly 65% above today’s $64 price.

Don’t Let Luck Decide Your Entry Point
Optimize your entry points with our advanced ProRealTime indicators. You’ll get efficient buy signals with precise price targets for maximum performance. Start outperforming now!
How do institutions grade them?
Here is a summary of recent institutional grades for Accenture plc and Fiserv, Inc.:
Accenture plc Grades
The table below shows Accenture’s latest grades from notable financial institutions.
| Grading Company | Action | New Grade | Date |
|---|---|---|---|
| Wells Fargo | maintain | Equal Weight | 2026-01-14 |
| UBS | maintain | Buy | 2025-12-19 |
| Susquehanna | maintain | Neutral | 2025-12-19 |
| RBC Capital | maintain | Outperform | 2025-12-19 |
| Morgan Stanley | upgrade | Overweight | 2025-12-16 |
| Mizuho | maintain | Outperform | 2025-09-29 |
| Evercore ISI Group | maintain | Outperform | 2025-09-26 |
| BMO Capital | maintain | Market Perform | 2025-09-26 |
| TD Cowen | maintain | Buy | 2025-09-26 |
| Goldman Sachs | maintain | Buy | 2025-09-26 |
Fiserv, Inc. Grades
The table below summarizes recent grades for Fiserv from established grading firms.
| Grading Company | Action | New Grade | Date |
|---|---|---|---|
| Tigress Financial | maintain | Buy | 2025-12-31 |
| Mizuho | maintain | Outperform | 2025-12-22 |
| Goldman Sachs | downgrade | Neutral | 2025-10-30 |
| Bernstein | downgrade | Market Perform | 2025-10-30 |
| Argus Research | downgrade | Hold | 2025-10-30 |
| Morgan Stanley | downgrade | Equal Weight | 2025-10-30 |
| Truist Securities | downgrade | Hold | 2025-10-30 |
| JP Morgan | maintain | Overweight | 2025-10-30 |
| Citigroup | maintain | Neutral | 2025-10-30 |
| RBC Capital | maintain | Outperform | 2025-10-30 |
Which company has the best grades?
Accenture holds stronger consensus with multiple “Buy” and “Outperform” ratings, including a recent upgrade to “Overweight.” Fiserv faces several downgrades, which might signal caution to investors.
Risks specific to each company
The following categories identify critical pressure points and systemic threats facing Accenture plc and Fiserv, Inc. in the 2026 market environment:
1. Market & Competition
Accenture plc
- Dominates IT consulting with strong global presence and innovation focus.
Fiserv, Inc.
- Faces intense competition in fintech and payments, pressured by emerging digital disruptors.
2. Capital Structure & Debt
Accenture plc
- Maintains low debt-to-equity (0.26), strong interest coverage (46x), signaling financial stability.
Fiserv, Inc.
- Elevated debt-to-equity (0.92) and modest interest coverage (4.6x) increase financial risk.
3. Stock Volatility
Accenture plc
- Beta of 1.25 reflects moderate volatility aligned with tech sector norms.
Fiserv, Inc.
- Lower beta at 0.80 indicates less volatility but may suggest lower growth expectations.
4. Regulatory & Legal
Accenture plc
- Compliance with global IT and consulting regulations; exposure to data privacy laws.
Fiserv, Inc.
- Faces stringent financial services regulations and payment security compliance risks.
5. Supply Chain & Operations
Accenture plc
- Complex global service delivery network with robust risk management frameworks.
Fiserv, Inc.
- Relies on software platforms and third-party partnerships vulnerable to operational disruptions.
6. ESG & Climate Transition
Accenture plc
- Advanced sustainability services support client transitions; strong internal ESG policies.
Fiserv, Inc.
- Increasing pressure to align fintech solutions with evolving ESG standards.
7. Geopolitical Exposure
Accenture plc
- Significant international footprint exposes it to global trade tensions and regulatory shifts.
Fiserv, Inc.
- Primarily US-based, lower geopolitical risk but sensitive to domestic policy changes.
Which company shows a better risk-adjusted profile?
Accenture’s strongest risk is geopolitical exposure due to its global reach but boasts robust financial health and moderate volatility. Fiserv’s critical risk lies in high leverage undermining resilience despite a strong fintech niche. Given these factors, Accenture presents a better risk-adjusted profile, supported by a safe-zone Altman Z-score (5.45) versus Fiserv’s distress-zone score (1.40). The data also reveal Fiserv’s concerning debt-to-equity ratio (0.92), spotlighting elevated financial risk that investors must weigh carefully.
Final Verdict: Which stock to choose?
Accenture’s superpower lies in its unmatched operational efficiency and robust capital allocation. It consistently creates value above its cost of capital, though its declining ROIC trend is a point of vigilance. This stock fits well in an Aggressive Growth portfolio seeking steady profitability with some caution.
Fiserv’s strategic moat is its durable competitive advantage reflected in a rising ROIC and strong income quality. While it carries higher debt risk than Accenture, it offers potentially higher upside with a very favorable moat status. It suits a GARP (Growth at a Reasonable Price) portfolio focused on improving profitability and growth.
If you prioritize stable value creation and operational excellence, Accenture is the compelling choice due to its efficient capital use and strong financial health. However, if you seek growth with an improving profitability trajectory and can tolerate higher leverage, Fiserv offers better growth potential but with elevated risk.
Disclaimer: Investment carries a risk of loss of initial capital. The past performance is not a reliable indicator of future results. Be sure to understand risks before making an investment decision.
Go Further
I encourage you to read the complete analyses of Accenture plc and Fiserv, Inc. to enhance your investment decisions: