Home > Comparison > Technology > ACN vs FIS
The strategic rivalry between Accenture plc and Fidelity National Information Services, Inc. shapes the competitive landscape of the Technology sector. Accenture operates as a global professional services powerhouse, delivering broad digital transformation and consulting services. In contrast, Fidelity National Information Services focuses on specialized technology solutions for banking and capital markets. This head-to-head pits diversified growth against niche expertise. This analysis will determine which trajectory offers superior risk-adjusted returns for a diversified portfolio.

Table of contents
Companies Overview
Accenture plc and Fidelity National Information Services, Inc. both play pivotal roles in the global information technology services sector.
Accenture plc: Global Leader in Digital and Consulting Services
Accenture dominates as a professional services company specializing in strategy, consulting, technology, and operations worldwide. Its core revenue stems from delivering agile transformation, cloud services, and intelligent automation. In 2026, the company strategically focuses on digital industrial workforce solutions and cybersecurity services, emphasizing innovation and comprehensive digital transformation.
Fidelity National Information Services, Inc.: Specialist in Financial Technology Solutions
Fidelity National Information Services excels as a technology partner for merchants, banks, and capital markets. It generates revenue across merchant acquiring, core banking processing, and capital market solutions. The company’s 2026 strategy centers on expanding digital banking, fraud prevention, and global e-commerce services, reinforcing its position in financial ecosystem technology.
Strategic Collision: Similarities & Divergences
Both firms thrive in technology-driven service delivery but diverge in client focus—Accenture targets broad digital transformation, while Fidelity specializes in fintech infrastructure. Their main competition lies in cloud and digital solutions adoption, with Accenture’s expansive consulting contrasting Fidelity’s niche in financial services technology. Each offers distinct investment profiles: Accenture’s scale and innovation versus Fidelity’s sector-specific depth and stability.
Income Statement Comparison
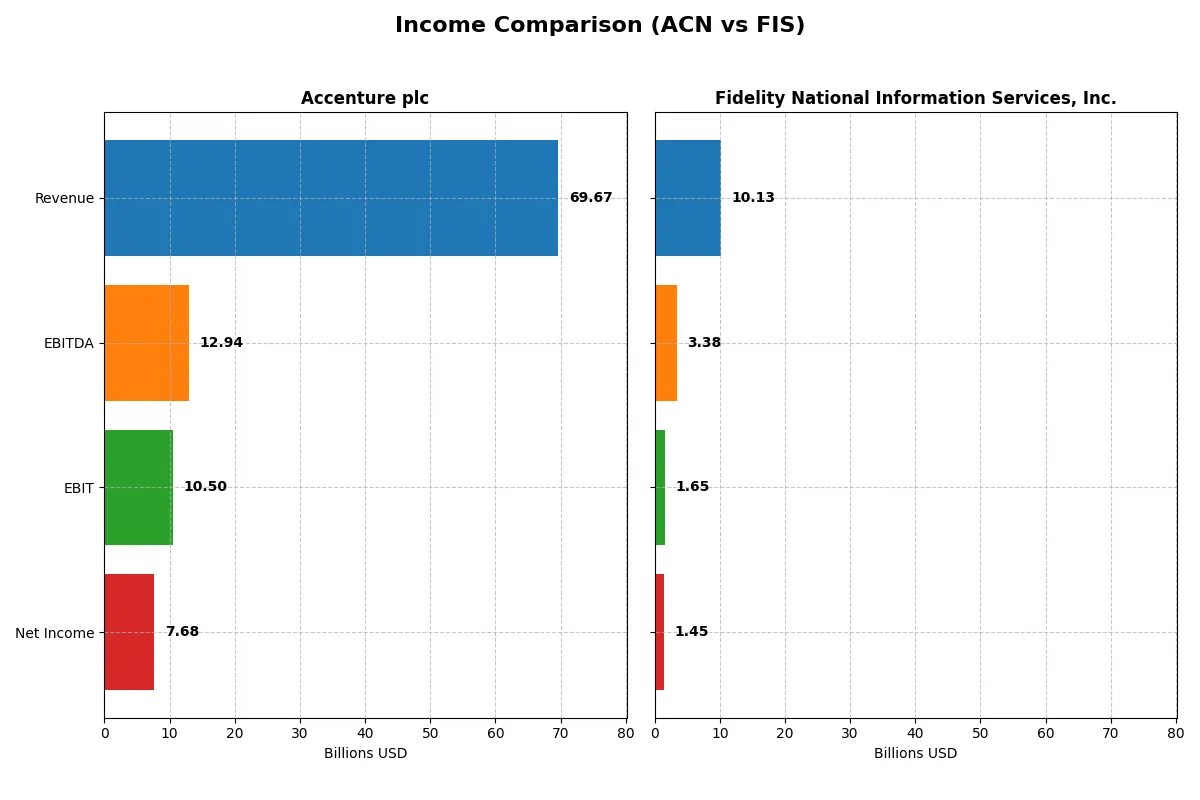
This data dissects the core profitability and scalability of both corporate engines to reveal who dominates the bottom line:
| Metric | Accenture plc (ACN) | Fidelity National Information Services, Inc. (FIS) |
|---|---|---|
| Revenue | 69.7B | 10.1B |
| Cost of Revenue | 47.4B | 6.3B |
| Operating Expenses | 12.0B | 2.1B |
| Gross Profit | 22.2B | 3.8B |
| EBITDA | 12.9B | 3.4B |
| EBIT | 10.5B | 1.6B |
| Interest Expense | 229M | 351M |
| Net Income | 7.7B | 787M |
| EPS | 12.29 | 1.42 |
| Fiscal Year | 2025 | 2024 |
Income Statement Analysis: The Bottom-Line Duel
The income statement comparison reveals which company drives profitability and efficiency more effectively through its core business operations.
Accenture plc Analysis
Accenture’s revenue climbed steadily from $50.5B in 2021 to $69.7B in 2025, reflecting robust top-line growth. Net income rose from $5.9B to $7.7B, demonstrating strong bottom-line expansion. Gross margins hold firm near 32%, while net margins remain healthy around 11%. In 2025, Accenture shows efficient cost control and solid EBITDA momentum, signaling operational strength.
Fidelity National Information Services, Inc. Analysis
FIS’s revenue declined from $13.9B in 2021 to $10.1B in 2024, indicating contraction in sales volume. However, net income swung from a $6.7B loss in 2023 to a $1.45B profit in 2024, driven by improved operational leverage and margin expansion. Gross margin stands higher than Accenture’s at 37.6%, with a net margin of 14.3%. The rebound in 2024 earnings shows promising recovery momentum despite top-line challenges.
Margin Resilience vs. Revenue Growth
Accenture leads with consistent revenue and profit growth supported by stable margins and operational efficiency. FIS impresses with margin expansion and a dramatic net income turnaround despite shrinking revenues. For investors, Accenture’s profile offers steady growth and margin reliability, while FIS presents a higher-risk, high-reward recovery story.
Financial Ratios Comparison
These vital ratios act as a diagnostic tool to expose underlying fiscal health, valuation premiums, and capital efficiency of the companies compared below:
| Ratios | Accenture plc (ACN) | Fidelity National Information Services, Inc. (FIS) |
|---|---|---|
| ROE | 24.6% | 9.2% |
| ROIC | 17.0% | 4.0% |
| P/E | 21.2 | 30.8 |
| P/B | 5.21 | 2.85 |
| Current Ratio | 1.42 | 0.85 |
| Quick Ratio | 1.42 | 0.85 |
| D/E | 0.26 | 0.74 |
| Debt-to-Assets | 12.5% | 34.2% |
| Interest Coverage | 44.7 | 4.9 |
| Asset Turnover | 1.07 | 0.30 |
| Fixed Asset Turnover | 16.2 | 11.6 |
| Payout ratio | 48.2% | 55.2% |
| Dividend yield | 2.28% | 1.79% |
| Fiscal Year | 2025 | 2024 |
Efficiency & Valuation Duel: The Vital Signs
Financial ratios act as a company’s DNA, revealing hidden risks and operational excellence critical for investment decisions.
Accenture plc
Accenture shows strong profitability with a 24.6% ROE and an 11.0% net margin, indicating efficient capital use and robust earnings. Its P/E of 21.2 is reasonable, though a 5.2 P/B ratio appears stretched. The company supports shareholders with a 2.3% dividend yield, reflecting disciplined capital allocation alongside growth investments.
Fidelity National Information Services, Inc.
FIS reports a favorable 14.3% net margin but a weak 9.2% ROE and low 4.0% ROIC, signaling operational challenges. The stock trades at a high P/E of 30.8, suggesting it is expensive relative to earnings. Dividend yield stands at 1.8%, with limited reinvestment efficiency, raising concerns about value creation.
Premium Valuation vs. Operational Safety
Accenture balances strong profitability and shareholder returns with a reasonable valuation, while FIS struggles with weak returns and stretched multiples. Investors seeking operational safety and consistent returns may prefer Accenture’s profile. Those tolerating higher risk might consider FIS’s growth potential despite its challenges.
Which one offers the Superior Shareholder Reward?
I see Accenture (ACN) delivers a balanced distribution with a 2.28% dividend yield and a 48% payout ratio, supported by strong free cash flow (FCF) coverage near 95%. Its consistent buybacks amplify shareholder returns sustainably. Fidelity National Information Services (FIS) offers a higher 1.79–3.47% dividend yield but suffers from volatile earnings and weaker coverage ratios. FIS’s buybacks are less reliable amid elevated debt (43% debt-to-capital) and mixed profitability. I judge Accenture’s disciplined dividend and aggressive buyback strategy more sustainable and rewarding for 2026 investors.
Comparative Score Analysis: The Strategic Profile
The radar chart reveals the fundamental DNA and trade-offs of Accenture plc and Fidelity National Information Services, Inc.:
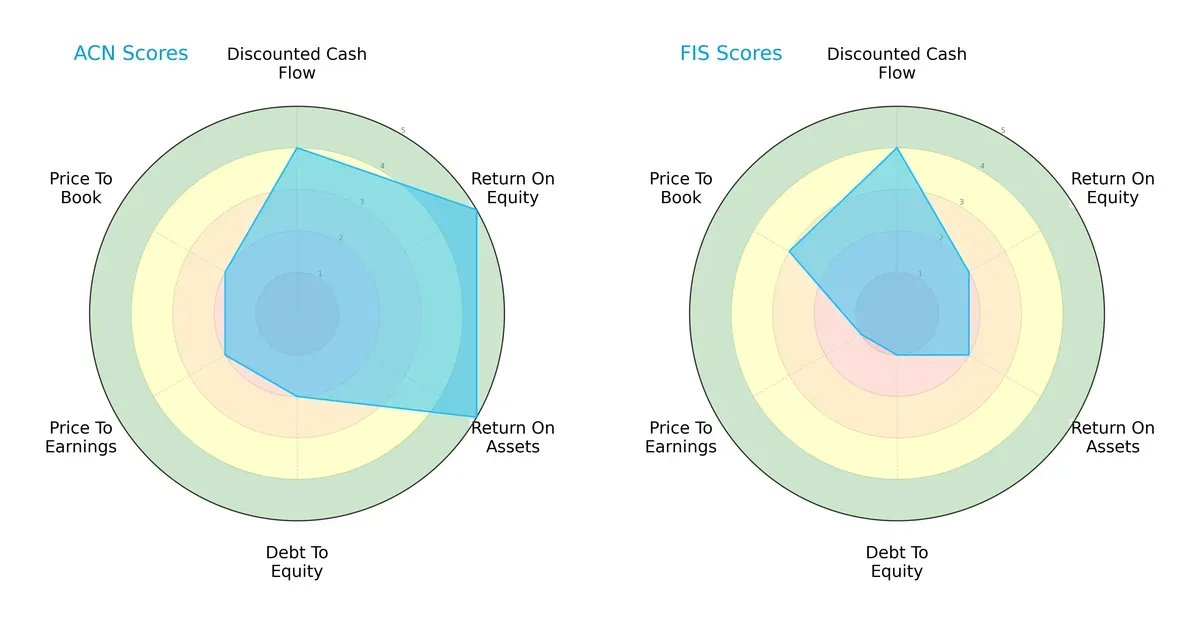
Accenture displays a balanced profile with strong profitability (ROE 5, ROA 5) and moderate leverage and valuation scores (Debt/Equity 2, P/E and P/B 2). Fidelity matches Accenture’s DCF score (4) but lags in profitability (ROE 2, ROA 2) and shows significant financial risk with a very low debt-to-equity score (1). Fidelity’s valuation scores are weaker (P/E 1, P/B 3). Accenture’s diversified strengths suggest greater resilience, while Fidelity relies more heavily on its cash flow projections.
—
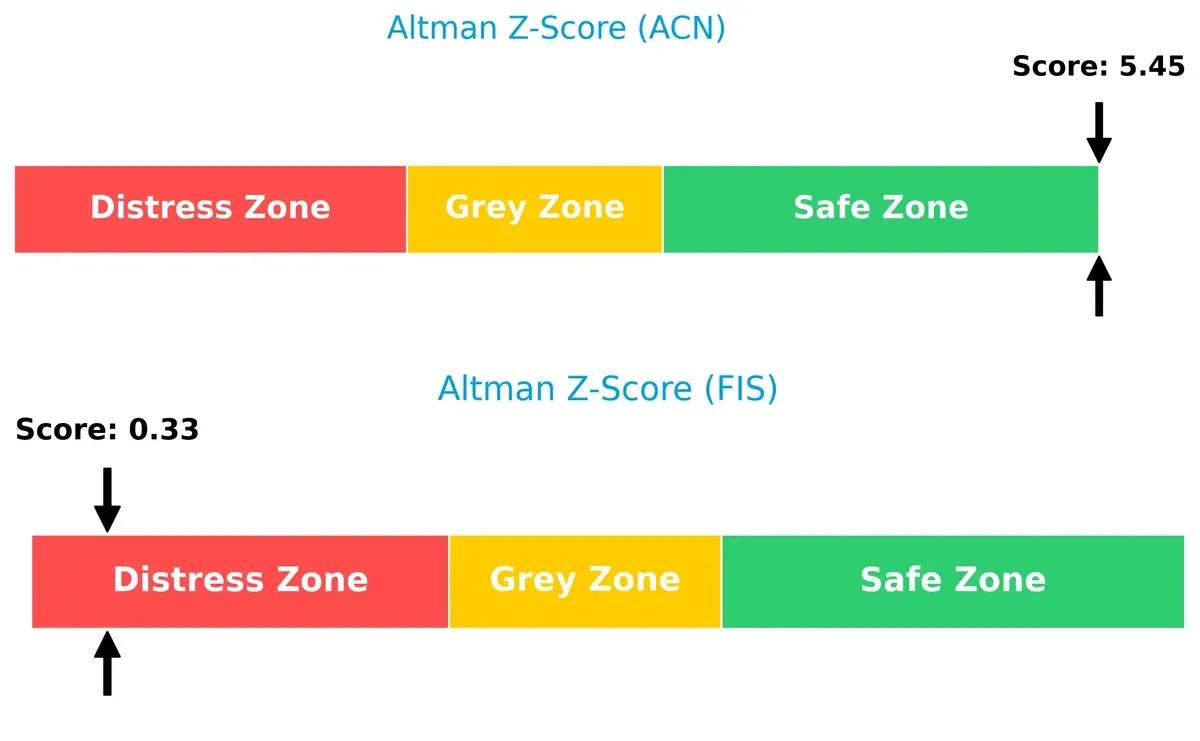
Bankruptcy Risk: Solvency Showdown
Accenture’s Altman Z-Score of 5.45 signals robust financial health, well within the safe zone. Fidelity’s 0.33 places it deep in the distress zone, indicating high bankruptcy risk in this cycle:
—
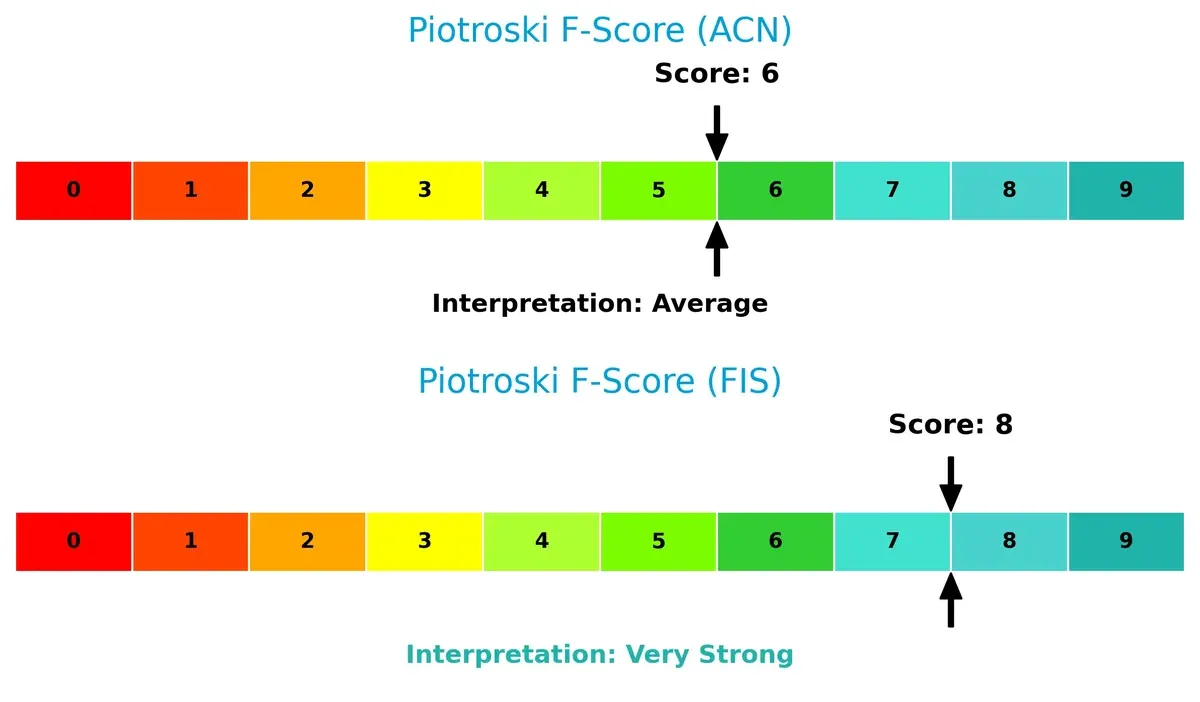
Financial Health: Quality of Operations
Fidelity’s Piotroski F-Score of 8 reflects very strong financial health, surpassing Accenture’s average score of 6. This suggests Fidelity currently executes internal operations more efficiently despite its solvency risks:
How are the two companies positioned?
This section dissects the operational DNA of Accenture and FIS by analyzing their revenue distribution and internal strengths and weaknesses. The goal is to confront their economic moats to reveal which model delivers the most resilient competitive advantage today.
Revenue Segmentation: The Strategic Mix
This visual comparison dissects how Accenture plc and Fidelity National Information Services diversify their income streams and reveals their primary sector bets:
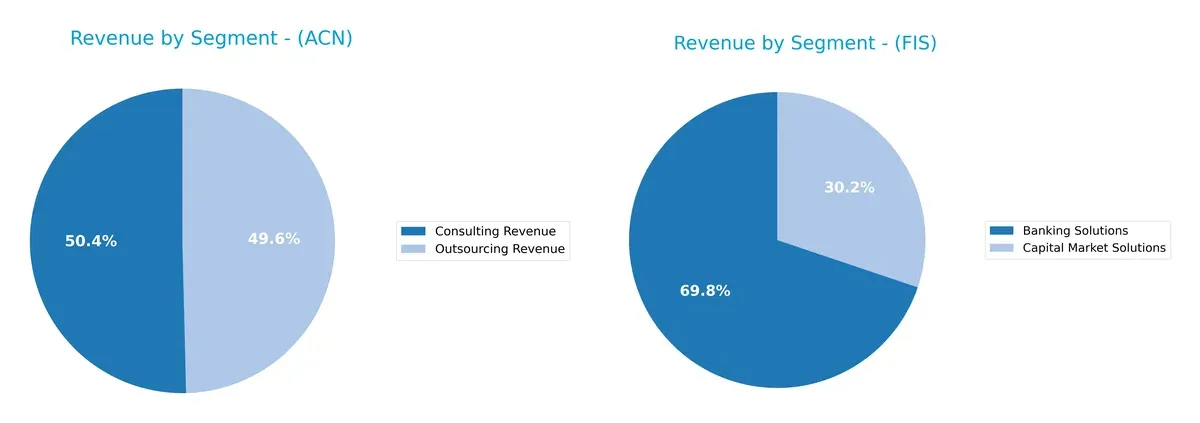
Accenture pivots around two large pillars: Consulting at $35.1B and Outsourcing near $34.6B in 2025, showing a balanced, dual-segment focus. Fidelity National anchors on Banking Solutions at $6.9B with Capital Market Solutions trailing at $3.0B in 2024, revealing heavier concentration risk. Accenture’s mix supports ecosystem lock-in via consulting and outsourcing, while Fidelity’s reliance on core financial technology segments suggests infrastructure dominance but less diversification.
Strengths and Weaknesses Comparison
This table compares the strengths and weaknesses of Accenture plc and Fidelity National Information Services, Inc.:
Accenture Strengths
- Strong profitability with 24.61% ROE and 16.99% ROIC
- Favorable debt metrics with 0.26 D/E and 12.51% debt-to-assets
- Diverse revenue streams across consulting, outsourcing, and products
- Global presence with significant revenue in North America, Europe, and Growth Markets
- High asset turnover efficiency
- Favorable interest coverage at 45.94
FIS Strengths
- Higher net margin at 14.32%
- Favorable WACC at 6.42% supports capital efficiency
- Diverse business segments including Banking and Capital Market Solutions
- Growing North America revenue base at $7.85B
- Solid fixed asset turnover at 11.56
- Neutral dividend yield of 1.79%
Accenture Weaknesses
- Unfavorable price-to-book ratio at 5.21 indicates premium valuation
- Neutral current ratio of 1.42 suggests moderate liquidity
- Neutral WACC limiting capital cost advantage
FIS Weaknesses
- Unfavorable ROE at 9.24% and ROIC at 3.99% indicate weak profitability
- Unfavorable current ratio of 0.85 signals liquidity risk
- Higher leverage with 0.74 D/E ratio and 34.16% debt-to-assets
- Unfavorable asset turnover at 0.3 reflecting lower operational efficiency
- Elevated P/E ratio at 30.8 suggests overvaluation
Both companies exhibit diversified revenue and global footprints, but Accenture’s superior profitability and balance sheet metrics contrast with FIS’s liquidity and efficiency challenges. This comparison highlights the importance of capital allocation and operational effectiveness in their strategic positioning.
The Moat Duel: Analyzing Competitive Defensibility
A structural moat is the only reliable shield that protects long-term profits from the relentless erosion of competition. Let’s dissect the moats of two industry leaders:
Accenture plc: Diversified Consulting Moat
Accenture’s moat stems from intangible assets and extensive client relationships. It shows stable high ROIC above WACC, reflecting efficient capital use. Expansion into AI and cloud services in 2026 should deepen its advantage.
Fidelity National Information Services, Inc.: Scale-Driven Cost Advantage
FIS relies on scale and integration within financial networks, contrasting Accenture’s consulting focus. Its ROIC is below WACC but rising, signaling improving profitability. Growth in digital payments and capital markets offers upside in 2026.
Consulting Expertise vs. Scale Efficiency
Accenture holds a wider moat with consistent value creation despite a slight ROIC decline. FIS is improving but still sheds value overall. Accenture is better positioned to defend market share amid intensifying tech disruption.
Which stock offers better returns?
Over the past 12 months, both stocks exhibited bearish trends with significant price declines, yet Accenture shows recent price recovery while Fidelity National Information Services continues downward momentum.
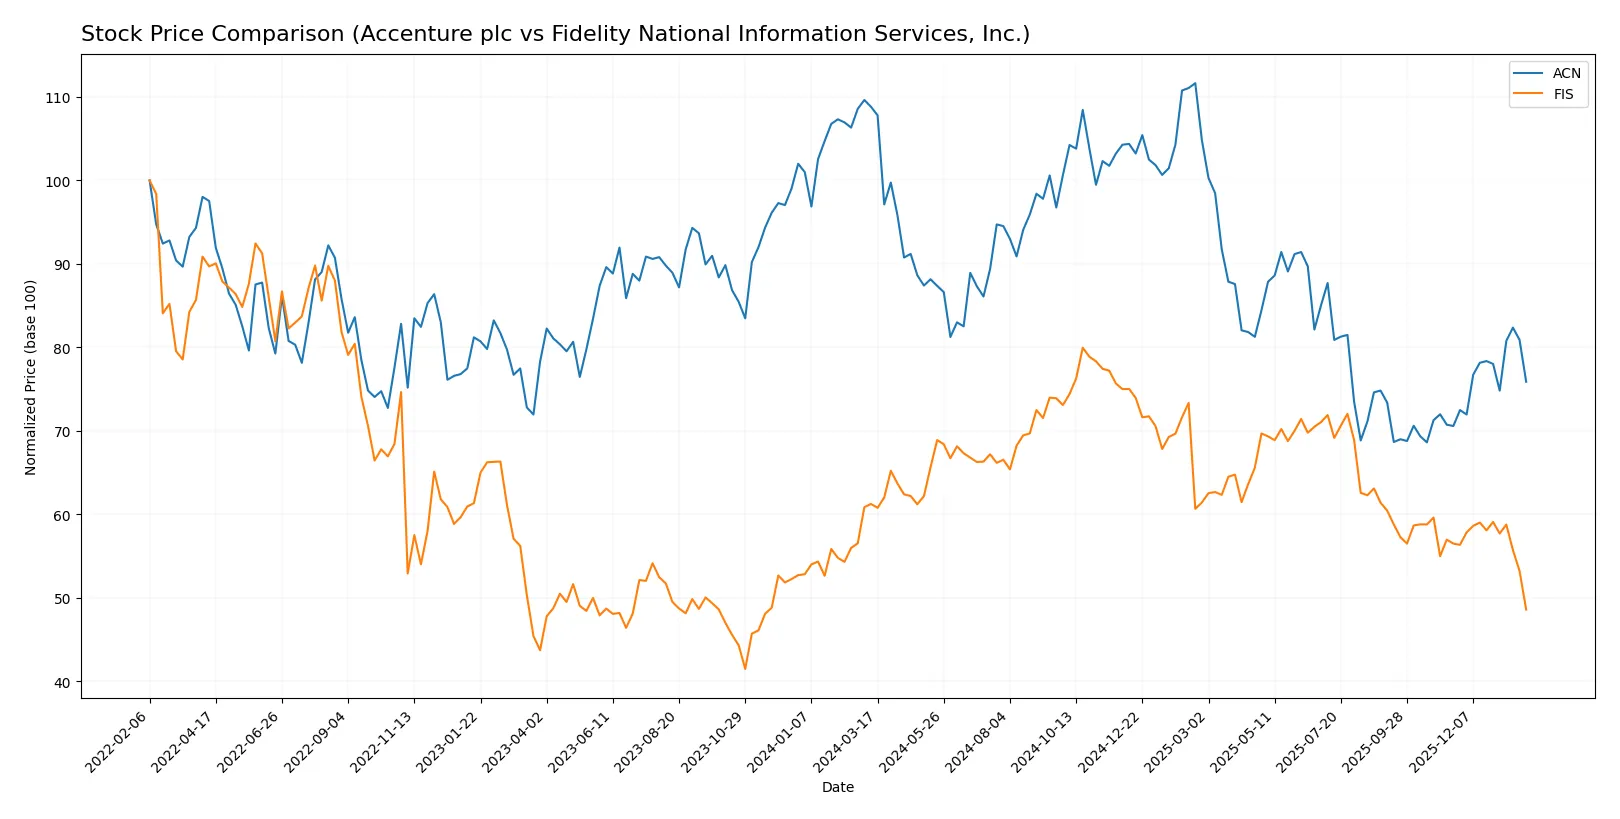
Trend Comparison
Accenture plc’s stock declined 30.29% over the past year, marking a bearish trend with accelerating price drops and high volatility. It showed a recent 7.52% gain signaling short-term recovery.
Fidelity National Information Services dropped 20.67% over the same period with a bearish trend but decelerating losses. Recent months saw a further 13.99% decline, confirming sustained downward pressure.
Accenture’s recent positive momentum contrasts with Fidelity’s deepening losses, making Accenture the higher performer over the full 12-month span despite overall declines.
Target Prices
Analysts present a bullish consensus for Accenture plc and Fidelity National Information Services, Inc.
| Company | Target Low | Target High | Consensus |
|---|---|---|---|
| Accenture plc (ACN) | 265 | 330 | 302.93 |
| Fidelity National Information Services (FIS) | 69 | 85 | 75.43 |
Accenture’s target consensus sits 15% above its current price of 264, indicating strong growth expectations. Fidelity National’s consensus exceeds its 55 price by over 36%, signaling robust upside potential.

Don’t Let Luck Decide Your Entry Point
Optimize your entry points with our advanced ProRealTime indicators. You’ll get efficient buy signals with precise price targets for maximum performance. Start outperforming now!
How do institutions grade them?
The following tables summarize the latest institutional grades for Accenture plc and Fidelity National Information Services, Inc.:
Accenture plc Grades
This table shows recent grade actions from several reputable grading companies for Accenture plc.
| Grading Company | Action | New Grade | Date |
|---|---|---|---|
| Wells Fargo | Maintain | Equal Weight | 2026-01-14 |
| UBS | Maintain | Buy | 2025-12-19 |
| Susquehanna | Maintain | Neutral | 2025-12-19 |
| RBC Capital | Maintain | Outperform | 2025-12-19 |
| Morgan Stanley | Upgrade | Overweight | 2025-12-16 |
| Mizuho | Maintain | Outperform | 2025-09-29 |
| Evercore ISI Group | Maintain | Outperform | 2025-09-26 |
| BMO Capital | Maintain | Market Perform | 2025-09-26 |
| TD Cowen | Maintain | Buy | 2025-09-26 |
| Goldman Sachs | Maintain | Buy | 2025-09-26 |
Fidelity National Information Services, Inc. Grades
Below are the latest ratings from recognized grading firms for Fidelity National Information Services, Inc.
| Grading Company | Action | New Grade | Date |
|---|---|---|---|
| Truist Securities | Maintain | Hold | 2025-11-19 |
| RBC Capital | Maintain | Outperform | 2025-11-06 |
| JP Morgan | Maintain | Overweight | 2025-11-06 |
| UBS | Maintain | Buy | 2025-11-06 |
| Truist Securities | Maintain | Hold | 2025-10-24 |
| Keefe, Bruyette & Woods | Maintain | Outperform | 2025-10-01 |
| UBS | Upgrade | Buy | 2025-09-30 |
| Keefe, Bruyette & Woods | Maintain | Outperform | 2025-08-06 |
| UBS | Maintain | Neutral | 2025-08-06 |
| Truist Securities | Maintain | Hold | 2025-07-17 |
Which company has the best grades?
Accenture plc holds consistently positive grades, including multiple “Outperform” and “Buy” ratings, with a recent upgrade to “Overweight.” Fidelity National Information Services also shows strong grades but more “Hold” and fewer upgrades. Accenture’s better grades may signal stronger institutional confidence.
Risks specific to each company
The following categories identify critical pressure points and systemic threats facing Accenture plc and Fidelity National Information Services, Inc. in the 2026 market environment:
1. Market & Competition
Accenture plc
- Faces intense competition in digital transformation and consulting services with pressure on margins.
Fidelity National Information Services, Inc.
- Operates in highly competitive fintech and payments sectors with innovation-driven disruption risks.
2. Capital Structure & Debt
Accenture plc
- Maintains low debt-to-equity (0.26), with strong interest coverage, indicating financial stability.
Fidelity National Information Services, Inc.
- Higher leverage (debt-to-equity 0.74) raises financial risk amid moderate interest coverage (4.7).
3. Stock Volatility
Accenture plc
- Exhibits higher beta (1.25), implying greater sensitivity to market swings.
Fidelity National Information Services, Inc.
- Beta below 1 (0.94) suggests less volatility but potentially less growth momentum.
4. Regulatory & Legal
Accenture plc
- Subject to global compliance across multiple jurisdictions with evolving data privacy laws.
Fidelity National Information Services, Inc.
- Faces significant regulatory scrutiny in payments and banking sectors, including anti-fraud and compliance risks.
5. Supply Chain & Operations
Accenture plc
- Depends on global talent and technology partners, vulnerable to talent shortages and tech disruptions.
Fidelity National Information Services, Inc.
- Relies on technology infrastructure and third-party vendors, exposing it to operational and cybersecurity risks.
6. ESG & Climate Transition
Accenture plc
- Strong ESG commitments may increase short-term costs but enhance long-term brand and compliance.
Fidelity National Information Services, Inc.
- ESG integration is evolving; climate risks may pressure operational costs and client demands.
7. Geopolitical Exposure
Accenture plc
- Global footprint exposes it to geopolitical tensions, currency fluctuations, and trade restrictions.
Fidelity National Information Services, Inc.
- Primarily US-based but faces risks from international operations and cross-border data regulations.
Which company shows a better risk-adjusted profile?
Accenture’s low leverage and strong financial health mitigate its market and geopolitical risks effectively. Fidelity’s elevated debt and weaker liquidity create vulnerability despite its strong Piotroski score. Accenture’s Altman Z-score firmly places it in the safe zone, contrasting sharply with Fidelity’s distress zone, spotlighting financial stability concerns. Fidelity’s main risk lies in capital structure, while Accenture faces competitive pressure. Overall, Accenture offers a superior risk-adjusted profile in 2026, supported by robust balance sheet metrics and operational resilience.
Final Verdict: Which stock to choose?
Accenture’s superpower lies in its unmatched efficiency and consistent value creation, reflected in strong returns on capital and operational excellence. Its slight decline in profitability is a point of vigilance. It suits portfolios focused on steady, long-term aggressive growth with tolerance for moderate valuation premiums.
Fidelity National Information Services’ moat is its entrenched position in financial services technology, delivering recurring revenue streams. While it appears less stable than Accenture, FIS’s improving profitability and strong cash flow generation offer a compelling safety profile for more conservative, value-oriented investors seeking growth at a reasonable price.
If you prioritize sustainable value creation and operational resilience, Accenture outshines due to superior returns and financial stability. However, if you seek turnaround potential with improving profitability and solid cash flow in a niche sector, FIS offers better stability despite current balance sheet challenges. Both present distinct analytical scenarios aligned with different investor risk profiles.
Disclaimer: Investment carries a risk of loss of initial capital. The past performance is not a reliable indicator of future results. Be sure to understand risks before making an investment decision.
Go Further
I encourage you to read the complete analyses of Accenture plc and Fidelity National Information Services, Inc. to enhance your investment decisions: