Home > Comparison > Technology > ACN vs EPAM
The strategic rivalry between Accenture plc and EPAM Systems defines the current trajectory of the global technology services sector. Accenture operates as a capital-intensive, diversified consulting and technology powerhouse with a vast global footprint. EPAM Systems, by contrast, focuses on digital platform engineering and software development with a leaner, innovation-driven model. This analysis will reveal which company’s corporate strategy offers a superior risk-adjusted outlook for diversified portfolios aiming to capture long-term sector leadership.

Table of contents
Companies Overview
Accenture and EPAM Systems both stand as influential players in the global technology services landscape.
Accenture plc: Global Professional Services Leader
Accenture dominates as a professional services giant, generating revenue through consulting, technology, and operations services worldwide. Its 2026 strategy focuses heavily on digital transformation, intelligent automation, and cloud infrastructure, reinforcing its broad, integrated service portfolio. The company’s scale and diverse offerings create a formidable competitive advantage in the Information Technology Services sector.
EPAM Systems, Inc.: Digital Engineering Specialist
EPAM Systems excels as a specialist in digital platform engineering and software development services. It drives revenue by delivering customized engineering, infrastructure management, and automation solutions across various industries. In 2026, EPAM prioritizes enhancing software testing, smart automation, and digital advisory services, aiming to deepen its niche expertise while expanding its global footprint.
Strategic Collision: Similarities & Divergences
Accenture embraces a broad, integrated service model, while EPAM focuses on specialized digital engineering and automation. They primarily compete in delivering end-to-end technology solutions to enterprise clients. Accenture’s vast scale contrasts with EPAM’s agility, resulting in distinct investment profiles shaped by breadth versus specialization.
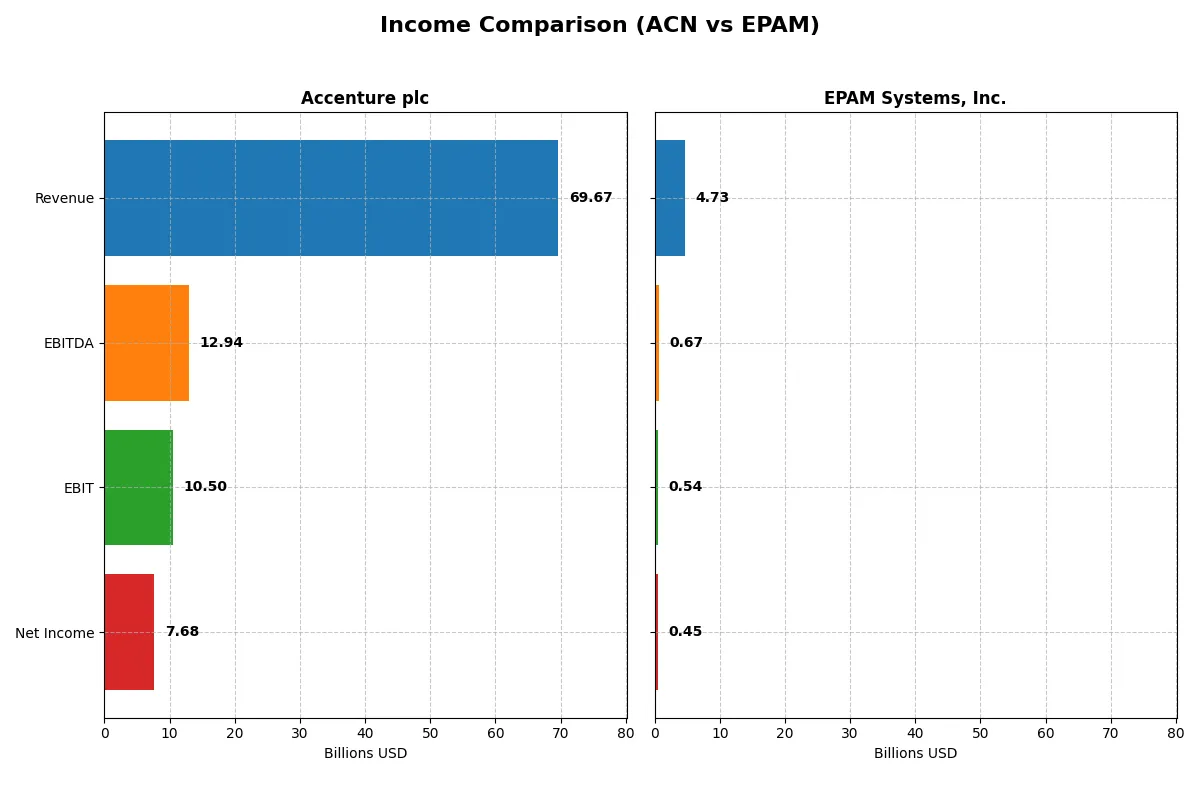
Income Statement Comparison
The data below dissects the core profitability and scalability of both corporate engines to reveal who dominates the bottom line:
| Metric | Accenture plc (ACN) | EPAM Systems, Inc. (EPAM) |
|---|---|---|
| Revenue | 69.7B | 4.7B |
| Cost of Revenue | 47.4B | 3.3B |
| Operating Expenses | 12.0B | 906M |
| Gross Profit | 22.2B | 1.5B |
| EBITDA | 12.9B | 672M |
| EBIT | 10.5B | 545M |
| Interest Expense | 229M | 0 |
| Net Income | 7.7B | 455M |
| EPS | 12.29 | 7.93 |
| Fiscal Year | 2025 | 2024 |
Income Statement Analysis: The Bottom-Line Duel
This income statement comparison reveals which company runs its business more efficiently through revenue generation and profit margins.
Accenture plc Analysis
Accenture’s revenue grew steadily from $50.5B in 2021 to $69.7B in 2025, with net income rising from $5.9B to $7.7B. Its gross margin holds strong at 31.9%, and net margin remains favorable at 11%. In 2025, Accenture shows momentum with a 7.4% revenue increase and solid EBIT growth, signaling operational efficiency.
EPAM Systems, Inc. Analysis
EPAM’s revenue climbed from $2.7B in 2020 to $4.7B in 2024, with net income increasing from $327M to $455M. Gross margin sits at a healthy 30.7%, while net margin is a respectable 9.6%. Despite slower 0.8% revenue growth in the latest year, EPAM improved net margin and EPS, reflecting improved profitability and cost control.
Verdict: Scale and Margin Leadership vs. Agile Profit Growth
Accenture outpaces EPAM in absolute scale and maintains stronger margins, driven by efficient cost control. EPAM shows impressive growth rates relative to size but lags in margin expansion. For investors prioritizing robust scale and consistent margin health, Accenture presents a more compelling profile. EPAM suits those seeking higher relative growth with improving profitability.
Financial Ratios Comparison
These vital ratios act as a diagnostic tool to expose the underlying fiscal health, valuation premiums, and capital efficiency of each company:
| Ratios | Accenture plc (ACN) | EPAM Systems, Inc. (EPAM) |
|---|---|---|
| ROE | 24.6% | 12.5% |
| ROIC | 17.0% | 10.7% |
| P/E | 21.2 | 29.5 |
| P/B | 5.21 | 3.69 |
| Current Ratio | 1.42 | 2.96 |
| Quick Ratio | 1.42 | 2.96 |
| D/E | 0.26 | 0.045 |
| Debt-to-Assets | 12.5% | 3.4% |
| Interest Coverage | 44.7 | 0 (not reported) |
| Asset Turnover | 1.07 | 1.00 |
| Fixed Asset Turnover | 16.2 | 14.1 |
| Payout Ratio | 48.2% | 0% |
| Dividend Yield | 2.28% | 0% |
| Fiscal Year | 2025 | 2024 |
Efficiency & Valuation Duel: The Vital Signs
Financial ratios act as a company’s DNA, exposing hidden risks and operational strengths crucial for investment decisions.
Accenture plc
Accenture demonstrates strong profitability with a 24.61% ROE and an 11.02% net margin, signaling operational efficiency. Its P/E of 21.16 suggests a fairly valued stock, while a high P/B of 5.21 raises some caution. The company rewards shareholders with a 2.28% dividend yield, reflecting steady cash returns.
EPAM Systems, Inc.
EPAM posts a moderate 12.52% ROE and a 9.61% net margin, indicating average profitability. The elevated P/E of 29.47 marks the stock as expensive relative to earnings. EPAM does not pay dividends, opting instead to reinvest earnings to fuel growth, aligning with a high current ratio of 2.96 and low debt levels.
Balanced Performance vs. Growth Premium
Accenture offers a stronger profitability profile and shareholder returns with a balanced valuation. EPAM’s premium multiples reflect growth expectations but come with less favorable capital efficiency. Conservative investors may prefer Accenture’s stability, while growth-focused investors might favor EPAM’s reinvestment strategy.
Which one offers the Superior Shareholder Reward?
I compare Accenture plc (ACN) and EPAM Systems, Inc. (EPAM) on shareholder reward through dividends and buybacks. ACN yields 2.28% with a 48% payout ratio, well covered by FCF, and runs steady buybacks. EPAM pays no dividend but plows free cash flow into growth and acquisitions, with modest buybacks. ACN’s disciplined distributions and buybacks offer sustainable, near-term returns. EPAM’s reinvestment strategy targets long-term gains but lacks immediate income. For investors prioritizing total return and income in 2026, ACN delivers the more attractive and reliable shareholder reward.
Comparative Score Analysis: The Strategic Profile
The radar chart reveals the fundamental DNA and trade-offs of Accenture plc and EPAM Systems, highlighting their operational and financial strengths:
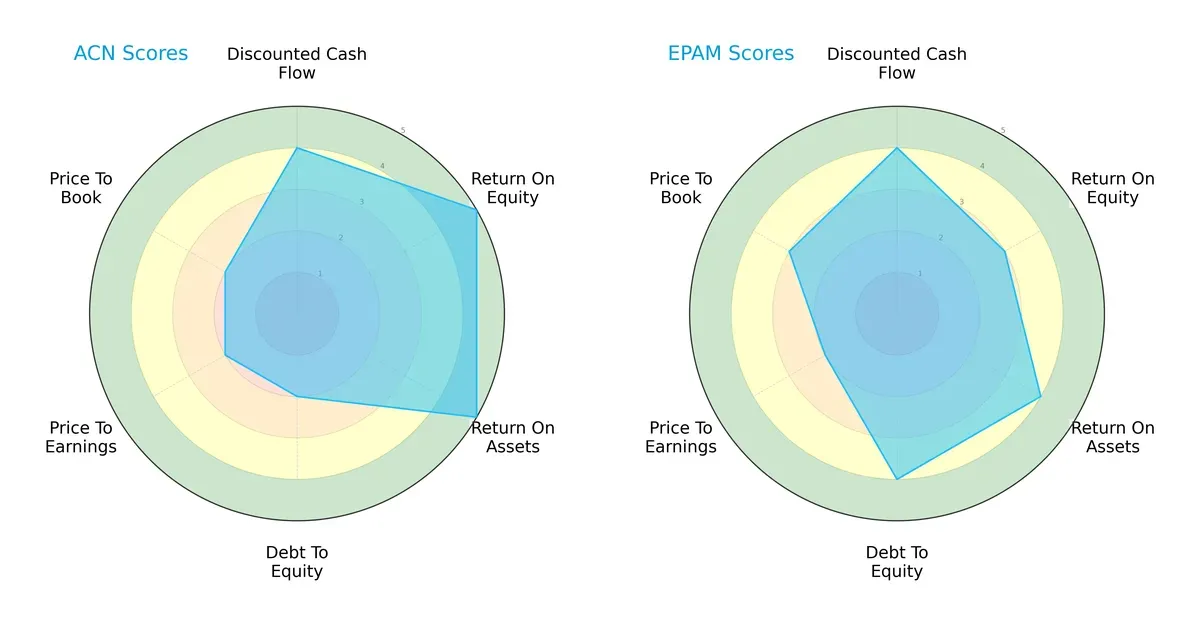
Accenture shows superior returns on equity (5 vs. 3) and assets (5 vs. 4), reflecting a more efficient profit generation. EPAM excels in debt management (4 vs. 2) and slightly better valuation on price-to-book (3 vs. 2). Overall, Accenture presents a balanced profile with strong profitability, while EPAM leverages financial discipline to offset lower returns.
—
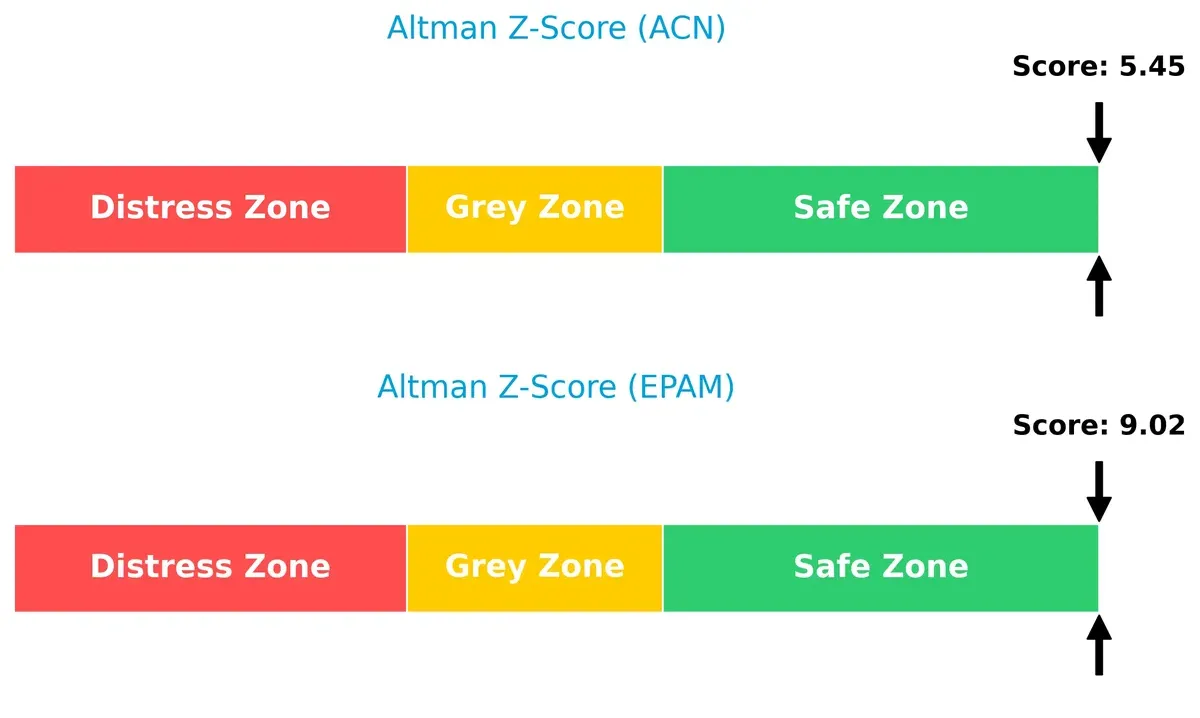
Bankruptcy Risk: Solvency Showdown
EPAM’s significantly higher Altman Z-Score (9.0 vs. 5.4) places it deeper in the safe zone, implying stronger resilience and lower bankruptcy risk through this economic cycle:
—
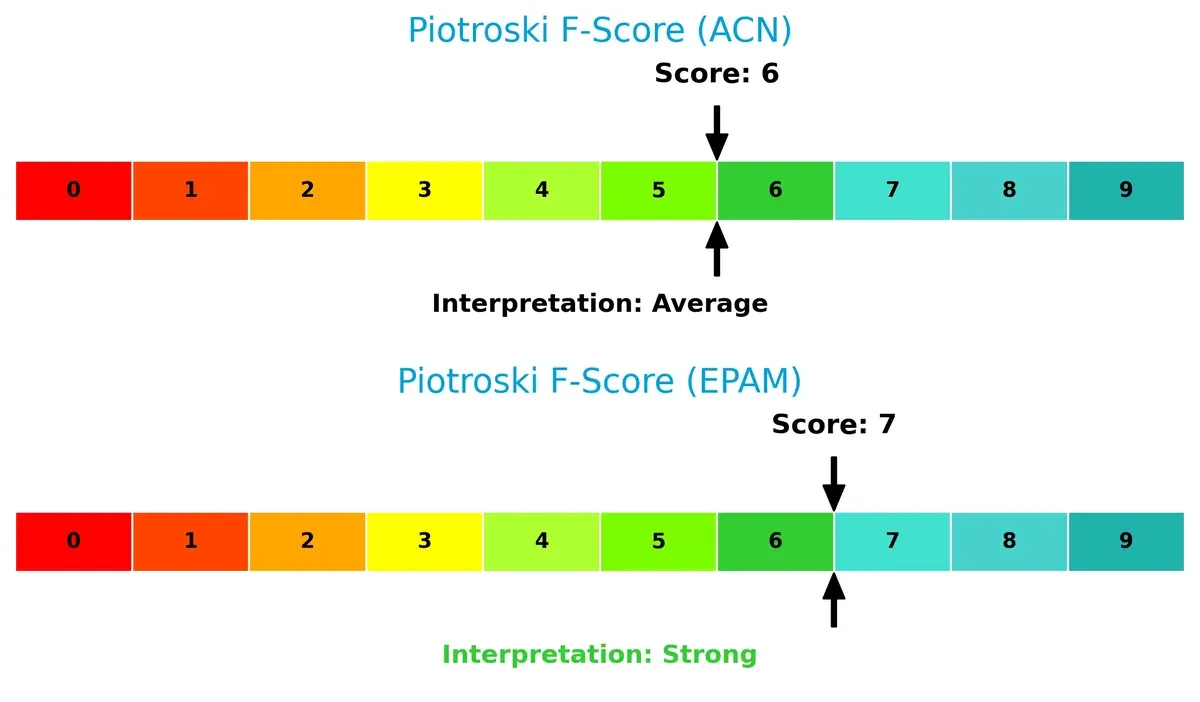
Financial Health: Quality of Operations
EPAM’s Piotroski Score of 7 vs. Accenture’s 6 indicates stronger internal financial health, with fewer red flags in profitability and efficiency metrics:
How are the two companies positioned?
This section dissects the operational DNA of Accenture and EPAM by comparing their revenue distribution and internal dynamics. The goal is to confront their economic moats and identify which model offers the most resilient competitive advantage today.
Revenue Segmentation: The Strategic Mix
This visual comparison dissects how Accenture plc and EPAM Systems, Inc. diversify income streams and reveals their primary sector bets:
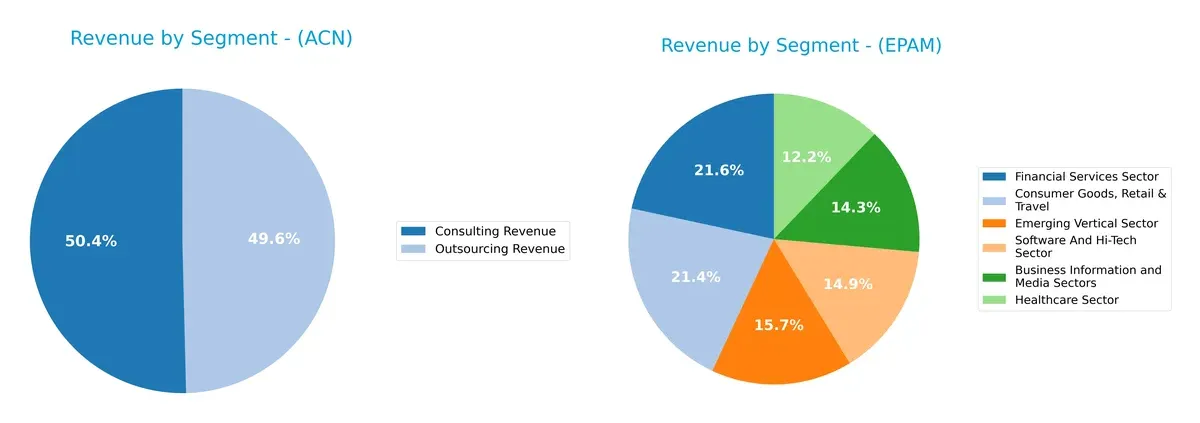
Accenture anchors its revenue in two massive segments: Consulting at $35B and Outsourcing near $34.6B, showing a classic dual focus. EPAM, by contrast, spreads roughly evenly across six sectors, none exceeding $1.1B, revealing a diversified but smaller scale footprint. Accenture’s mix signals ecosystem lock-in with deep client integration, while EPAM’s broad sector bets mitigate concentration risk but lack a dominant moat.
Strengths and Weaknesses Comparison
This table compares the Strengths and Weaknesses of Accenture plc and EPAM Systems, Inc.:
Accenture plc Strengths
- Diversified revenue streams across consulting, outsourcing, and multiple industries
- Strong global presence in North America, Europe, and growth markets
- High profitability with favorable net margin and ROIC
- Solid financial health with low debt and high interest coverage
- Consistent asset turnover and dividend yield
EPAM Systems, Inc. Strengths
- Favorable liquidity ratios with strong current and quick ratios
- Low debt levels and strong interest coverage
- Geographic diversification within North America and Europe
- Favorable fixed asset turnover
- Exposure to multiple vertical sectors including software, healthcare, and financial services
Accenture plc Weaknesses
- High price-to-book ratio signals possible overvaluation
- Neutral current ratio suggests moderate short-term liquidity risk
- WACC near ROIC indicates tight capital efficiency margin
EPAM Systems, Inc. Weaknesses
- Lower profitability with neutral net margin and ROE, unfavorable ROIC
- Higher WACC reduces capital efficiency
- Elevated PE ratio could indicate valuation risk
- Absence of dividend yield limits income potential
Accenture demonstrates robust profitability and a broad global footprint, but faces valuation scrutiny. EPAM shows strong liquidity and low leverage but struggles with profitability and valuation concerns. Both companies’ strategic focuses reflect their financial strengths and constraints.
The Moat Duel: Analyzing Competitive Defensibility
A structural moat shields long-term profits from relentless competition and market shifts. Here’s how Accenture and EPAM Systems stack up:
Accenture plc: Scale and Diversification Moat
Accenture leverages vast scale and diverse service lines, yielding high ROIC above WACC and stable margins. Its evolving digital and cloud offerings could deepen this lead in 2026.
EPAM Systems, Inc.: Niche Engineering Expertise
EPAM’s moat centers on specialized digital engineering and software services. Despite solid growth in revenue, its ROIC lags WACC, signaling pressure on value creation amid rising competition.
Scale & Diversification vs. Specialized Execution
Accenture’s wider moat results from scale and service breadth, enabling consistent value creation despite slight ROIC decline. EPAM’s narrower moat suffers from declining ROIC and value destruction. Accenture is better positioned to defend and expand market share long-term.
Which stock offers better returns?
The past year showed steep declines for both stocks, followed by a recent rebound marked by buyer dominance and accelerating upward momentum.
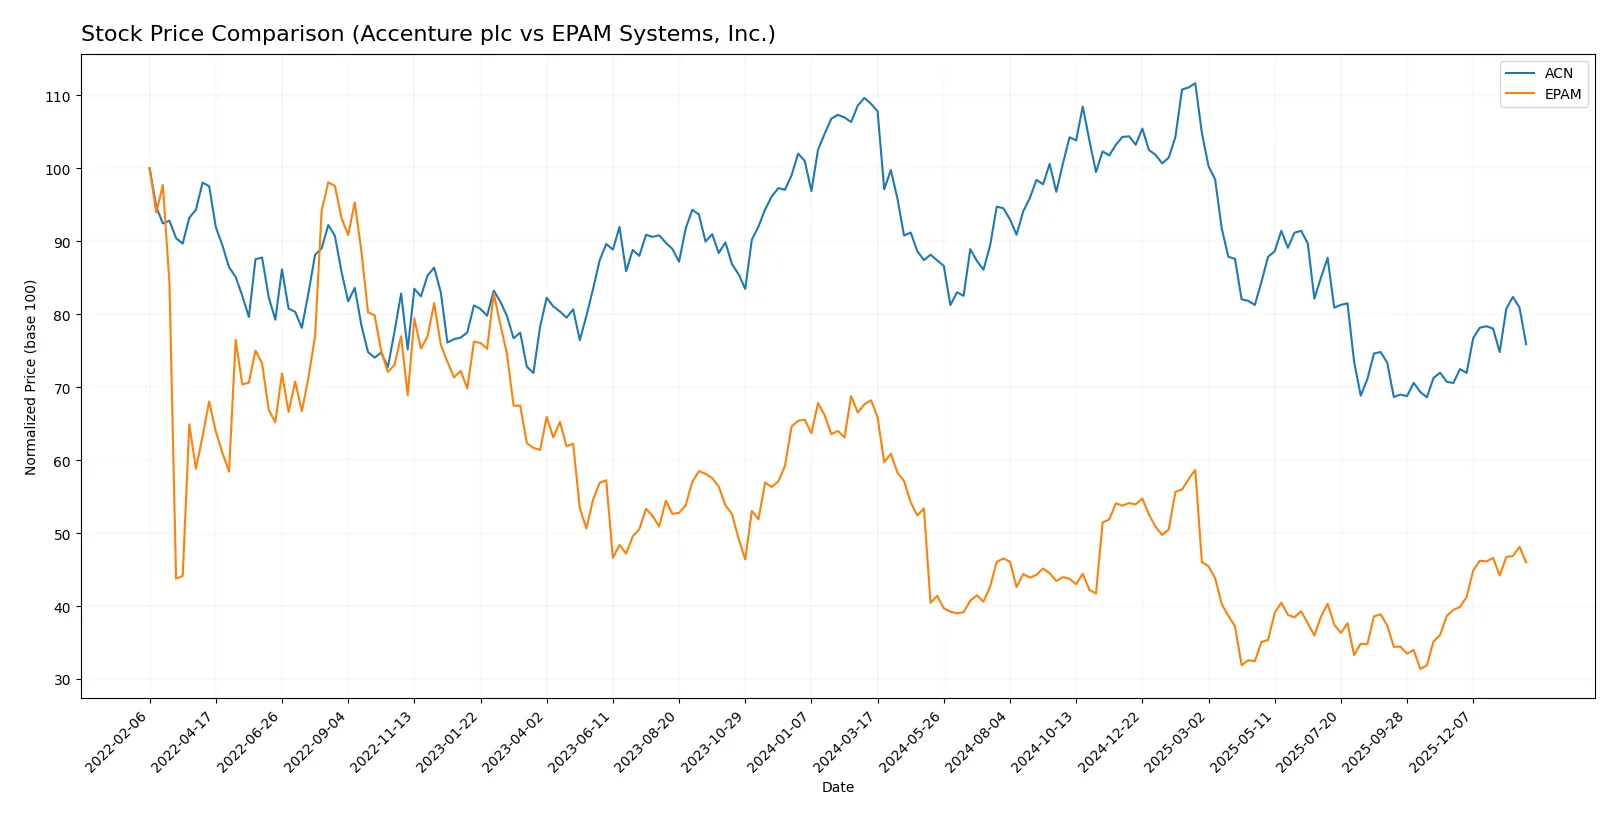
Trend Comparison
Accenture plc’s stock fell 30.29% over 12 months, a clear bearish trend with accelerating decline. The price ranged from 388.0 high to 238.39 low, with recent gains of 7.52% signaling early recovery.
EPAM Systems, Inc. dropped 32.58% over the same period, also bearish with accelerating losses. It traded between 309.4 high and 142.38 low, then rebounded 16.52%, showing stronger recent upward momentum.
EPAM underperformed Accenture over 12 months but outpaced Accenture’s recent rebound, delivering the highest market gains in the latest quarter.
Target Prices
Analysts project moderate upside for both Accenture plc and EPAM Systems, reflecting confidence in their robust tech services.
| Company | Target Low | Target High | Consensus |
|---|---|---|---|
| Accenture plc | 265 | 330 | 302.93 |
| EPAM Systems, Inc. | 175 | 247 | 214 |
The consensus target prices for Accenture and EPAM imply 15% and 2.6% upside, respectively, compared to current prices of $263.64 and $208.60. This suggests analysts expect Accenture to outperform EPAM in the near term.

Don’t Let Luck Decide Your Entry Point
Optimize your entry points with our advanced ProRealTime indicators. You’ll get efficient buy signals with precise price targets for maximum performance. Start outperforming now!
How do institutions grade them?
Accenture plc Grades
The following table lists recent institutional grades for Accenture plc from major firms.
| Grading Company | Action | New Grade | Date |
|---|---|---|---|
| Wells Fargo | Maintain | Equal Weight | 2026-01-14 |
| UBS | Maintain | Buy | 2025-12-19 |
| Susquehanna | Maintain | Neutral | 2025-12-19 |
| RBC Capital | Maintain | Outperform | 2025-12-19 |
| Morgan Stanley | Upgrade | Overweight | 2025-12-16 |
| Mizuho | Maintain | Outperform | 2025-09-29 |
| Evercore ISI Group | Maintain | Outperform | 2025-09-26 |
| BMO Capital | Maintain | Market Perform | 2025-09-26 |
| TD Cowen | Maintain | Buy | 2025-09-26 |
| Goldman Sachs | Maintain | Buy | 2025-09-26 |
EPAM Systems, Inc. Grades
The following table lists recent institutional grades for EPAM Systems, Inc. from major firms.
| Grading Company | Action | New Grade | Date |
|---|---|---|---|
| Citigroup | Maintain | Neutral | 2026-01-29 |
| Wells Fargo | Maintain | Overweight | 2026-01-14 |
| TD Cowen | Maintain | Buy | 2026-01-09 |
| Mizuho | Maintain | Outperform | 2025-11-11 |
| JP Morgan | Maintain | Overweight | 2025-11-07 |
| Morgan Stanley | Maintain | Equal Weight | 2025-09-09 |
| JP Morgan | Maintain | Overweight | 2025-08-20 |
| Barclays | Maintain | Overweight | 2025-05-12 |
| Piper Sandler | Maintain | Neutral | 2025-05-09 |
| Needham | Maintain | Buy | 2025-05-09 |
Which company has the best grades?
Accenture holds a diverse range of positive grades including multiple “Buy,” “Outperform,” and an “Overweight” upgrade. EPAM also receives strong support, mainly “Overweight” and “Buy” ratings. Accenture’s broader consensus of outperform and buy grades may suggest higher institutional confidence, potentially influencing investor perception toward stability and growth.
Risks specific to each company
The following categories identify critical pressure points and systemic threats facing Accenture plc and EPAM Systems, Inc. in the 2026 market environment:
1. Market & Competition
Accenture plc
- Dominates with global scale and diversified service offerings, maintaining a strong moat in IT consulting.
EPAM Systems, Inc.
- Faces intense competition in digital engineering; smaller scale limits market reach and pricing power.
2. Capital Structure & Debt
Accenture plc
- Maintains moderate leverage (D/E 0.26), strong interest coverage (46x), signaling low financial risk.
EPAM Systems, Inc.
- Very low debt (D/E 0.04) and no interest expense risk; conservatively financed but less capital flexibility.
3. Stock Volatility
Accenture plc
- Beta 1.25 indicates moderate volatility, typical for large-cap IT services.
EPAM Systems, Inc.
- Higher beta at 1.73 signals elevated stock price swings; higher risk for risk-averse investors.
4. Regulatory & Legal
Accenture plc
- Global footprint exposes it to complex multi-jurisdictional regulations but with established compliance frameworks.
EPAM Systems, Inc.
- US-centric but expanding globally; legal risks rise as it enters more regulated markets without mature controls.
5. Supply Chain & Operations
Accenture plc
- Robust global operations with diversified vendor base; resilient to disruptions through scale and automation.
EPAM Systems, Inc.
- Smaller operational scale and heavy reliance on specialized talent increase vulnerability to operational bottlenecks.
6. ESG & Climate Transition
Accenture plc
- Strong ESG initiatives integrated into business model; sustainability services drive competitive advantage.
EPAM Systems, Inc.
- Emerging ESG programs; lagging in climate transition disclosures could impact institutional investor appeal.
7. Geopolitical Exposure
Accenture plc
- Exposure to global political risks but diversified revenue mitigates localized shocks.
EPAM Systems, Inc.
- Higher risk from geopolitical tensions due to concentration in Eastern Europe and US markets.
Which company shows a better risk-adjusted profile?
Accenture’s dominant market position and balanced capital structure provide resilience against competition and financial shocks. EPAM, while financially conservative, faces higher volatility and geopolitical risks amid aggressive growth. Accenture’s mature ESG framework and operational scale add stability. EPAM’s higher beta and concentrated geopolitical exposure elevate its risk profile. Overall, Accenture offers a superior risk-adjusted profile in 2026, underpinned by strong financial health and diversified global operations. Notably, EPAM’s beta of 1.73 versus Accenture’s 1.25 highlights elevated volatility concerns that investors must weigh carefully.
Final Verdict: Which stock to choose?
Accenture’s superpower lies in its unmatched capital efficiency and robust return on invested capital well above its cost of capital. This translates into consistent value creation, though its slightly declining profitability is a point of vigilance. It suits investors seeking solid, long-term growth with a moderate risk appetite.
EPAM’s strategic moat is its strong liquidity position and low leverage, offering a financial safety net that surpasses Accenture’s. However, its value destruction indicated by a ROIC below WACC demands caution. EPAM fits well in portfolios prioritizing stability and capital preservation with some growth upside.
If you prioritize superior capital efficiency and proven value creation, Accenture outshines as the compelling choice due to its strong profitability metrics. However, if you seek better balance sheet safety and lower financial risk, EPAM offers better stability despite its challenges in generating excess returns. Each presents distinct scenarios tailored to different investor profiles.
Disclaimer: Investment carries a risk of loss of initial capital. The past performance is not a reliable indicator of future results. Be sure to understand risks before making an investment decision.
Go Further
I encourage you to read the complete analyses of Accenture plc and EPAM Systems, Inc. to enhance your investment decisions: