Home > Comparison > Technology > ACN vs CTSH
The strategic rivalry between Accenture plc and Cognizant Technology Solutions shapes the trajectory of the global technology services sector. Accenture operates as a diversified consulting and digital transformation powerhouse, while Cognizant focuses on specialized outsourcing and industry-specific technology solutions. This head-to-head highlights a contest between scale-driven innovation and targeted operational efficiency. This analysis evaluates which corporate model delivers superior risk-adjusted returns for a diversified investment portfolio in 2026.
Table of contents
Companies Overview
Accenture and Cognizant stand as pivotal players shaping global IT services and digital transformation.
Accenture: Global Leader in Digital Transformation
Accenture dominates as a professional services powerhouse, generating revenue from consulting, technology, and operations services worldwide. Its core strengths include agile application services, intelligent automation, and cloud infrastructure. In 2026, it focuses strategically on digital industrial workforce solutions and cybersecurity, reinforcing its competitive advantage in end-to-end digital transformation.
Cognizant: Specialist in Sector-Focused IT Services
Cognizant specializes in consultancy and outsourcing, with revenue driven by segment-specific solutions for financial services, healthcare, and communications. Its 2026 strategy emphasizes customer experience, robotic process automation, and AI to enhance operational efficiency. This market position centers on delivering tailored technology solutions across key industries.
Strategic Collision: Similarities & Divergences
Both firms excel in IT consulting but diverge in scope: Accenture pursues broad digital innovation; Cognizant targets vertical specialization. The primary battleground is digital automation and AI services. Accenture’s expansive portfolio contrasts with Cognizant’s focused industry approach, defining distinct investment profiles in scale and market reach.
Income Statement Comparison
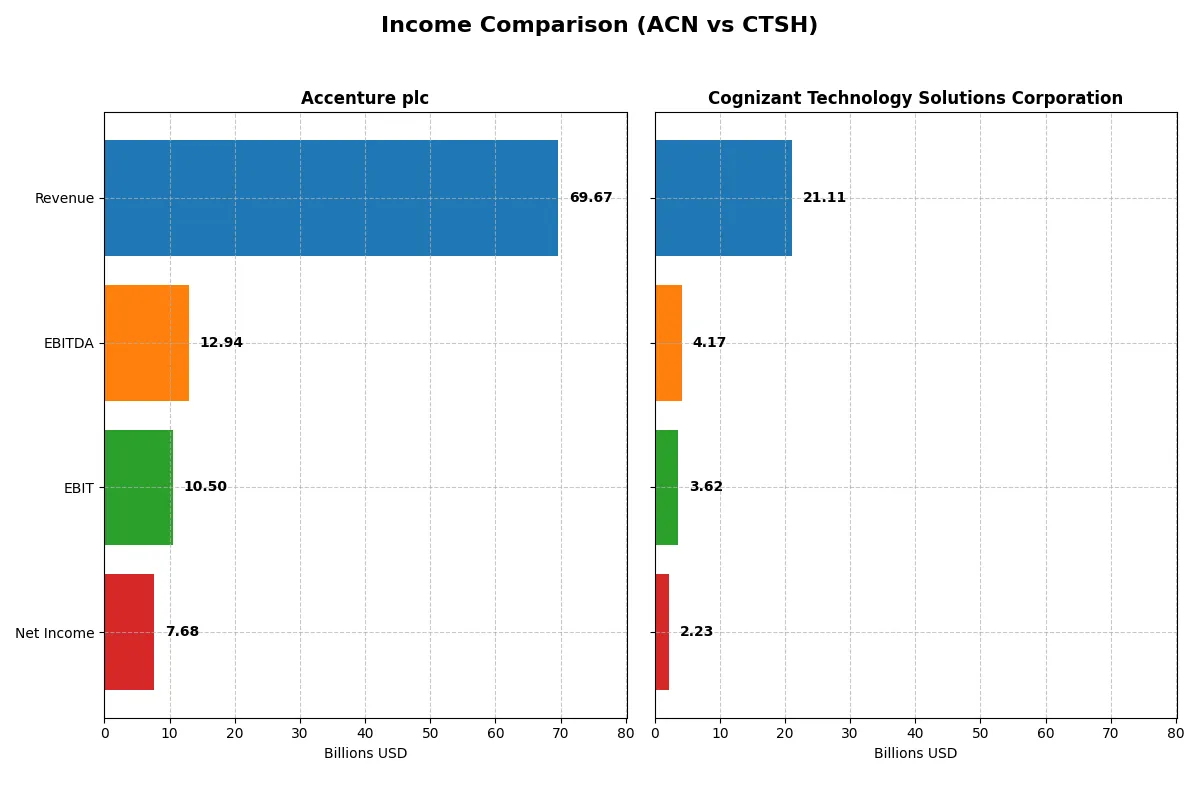
This data dissects the core profitability and scalability of both corporate engines to reveal who dominates the bottom line:
| Metric | Accenture plc (ACN) | Cognizant Technology Solutions Corporation (CTSH) |
|---|---|---|
| Revenue | 69.7B | 21.1B |
| Cost of Revenue | 47.4B | 14.0B |
| Operating Expenses | 12.0B | 3.6B |
| Gross Profit | 22.2B | 7.1B |
| EBITDA | 12.9B | 4.2B |
| EBIT | 10.5B | 3.6B |
| Interest Expense | 229M | 37M |
| Net Income | 7.7B | 2.2B |
| EPS | 12.29 | 4.56 |
| Fiscal Year | 2025 | 2025 |
Income Statement Analysis: The Bottom-Line Duel
This income statement comparison exposes how each company’s revenue and profit engines perform under market pressure and operational demands.
Accenture plc Analysis
Accenture’s revenue climbed steadily from 50.5B in 2021 to 69.7B in 2025, reflecting a robust 38% growth over five years. Net income followed suit, rising from 5.9B to 7.7B, albeit with a slight net margin compression to 11%. The 2025 gross margin of 31.9% and EBIT margin near 15% signal efficient cost management and strong operating leverage.
Cognizant Technology Solutions Corporation Analysis
Cognizant’s revenue grew more modestly, from 18.5B in 2021 to 21.1B in 2025, a 14% increase. Net income showed limited expansion, hovering around 2.1B to 2.2B, with a net margin just above 10%. Its 2025 gross margin of 33.7% and EBIT margin of 17.2% highlight solid profitability, yet slower momentum compared to peers.
Verdict: Growth Scale vs. Margin Efficiency
Accenture commands a clear lead in revenue and net income growth, showcasing scalable operations with healthy margin retention. Cognizant posts higher margins but lags in top-line expansion and net income growth. For investors, Accenture’s profile offers a compelling growth trajectory, while Cognizant appeals more to those prioritizing margin strength over rapid scale.
Financial Ratios Comparison
These vital ratios act as a diagnostic tool to expose the underlying fiscal health, valuation premiums, and capital efficiency of the companies compared below:
| Ratios | Accenture plc (ACN) | Cognizant Technology Solutions Corporation (CTSH) |
|---|---|---|
| ROE | 24.6% | 0% |
| ROIC | 17.0% | 0% |
| P/E | 21.2 | 17.9 |
| P/B | 5.21 | 0 |
| Current Ratio | 1.42 | 0 |
| Quick Ratio | 1.42 | 0 |
| D/E (Debt-to-Equity) | 0.26 | 0 |
| Debt-to-Assets | 12.5% | 0% |
| Interest Coverage | 44.7 | 95.4 |
| Asset Turnover | 1.07 | 0 |
| Fixed Asset Turnover | 16.2 | 0 |
| Payout ratio | 48.2% | 27.4% |
| Dividend yield | 2.28% | 1.53% |
| Fiscal Year | 2025 | 2025 |
Efficiency & Valuation Duel: The Vital Signs
Financial ratios act as a company’s DNA, exposing hidden risks and revealing operational excellence that shapes investor decisions.
Accenture plc
Accenture posts a robust ROE of 24.61% and a net margin of 11.02%, signaling strong profitability. Its P/E ratio of 21.16 suggests a fairly valued stock, while a high P/B of 5.21 raises concerns. The company returns value with a 2.28% dividend yield, balancing growth and shareholder income effectively.
Cognizant Technology Solutions Corporation
Cognizant’s net margin is solid at 10.56%, but zero reported ROE and ROIC indicate weak profitability metrics or data gaps. Its P/E of 17.9 appears reasonable, and the absence of debt is favorable. Dividend yield sits at 1.53%, showing moderate shareholder returns amid operational uncertainties.
Balanced Profitability vs. Valuation Ambiguity
Accenture offers a better balance of profitability and shareholder returns despite a stretched P/B ratio. Cognizant’s unclear profitability metrics and lower dividend yield elevate risk. Investors seeking stable operational performance may favor Accenture; those prioritizing valuation might find Cognizant’s profile more speculative.
Which one offers the Superior Shareholder Reward?
I see Accenture (ACN) pays a higher dividend yield at 2.28% with a payout ratio near 48%, well-covered by free cash flow (FCF). Its robust buyback program further boosts shareholder returns. Cognizant (CTSH) offers a lower 1.53% yield, with a more conservative 27% payout. CTSH invests heavily in growth, but its buybacks are less intense. Historically, Accenture’s balanced distribution—solid dividends and aggressive buybacks—sustains long-term value better than Cognizant’s growth-focused model. I conclude Accenture delivers the superior total shareholder reward in 2026.
Comparative Score Analysis: The Strategic Profile
The radar chart reveals the fundamental DNA and trade-offs of Accenture plc and Cognizant Technology Solutions Corporation, highlighting their investment strengths and weaknesses:
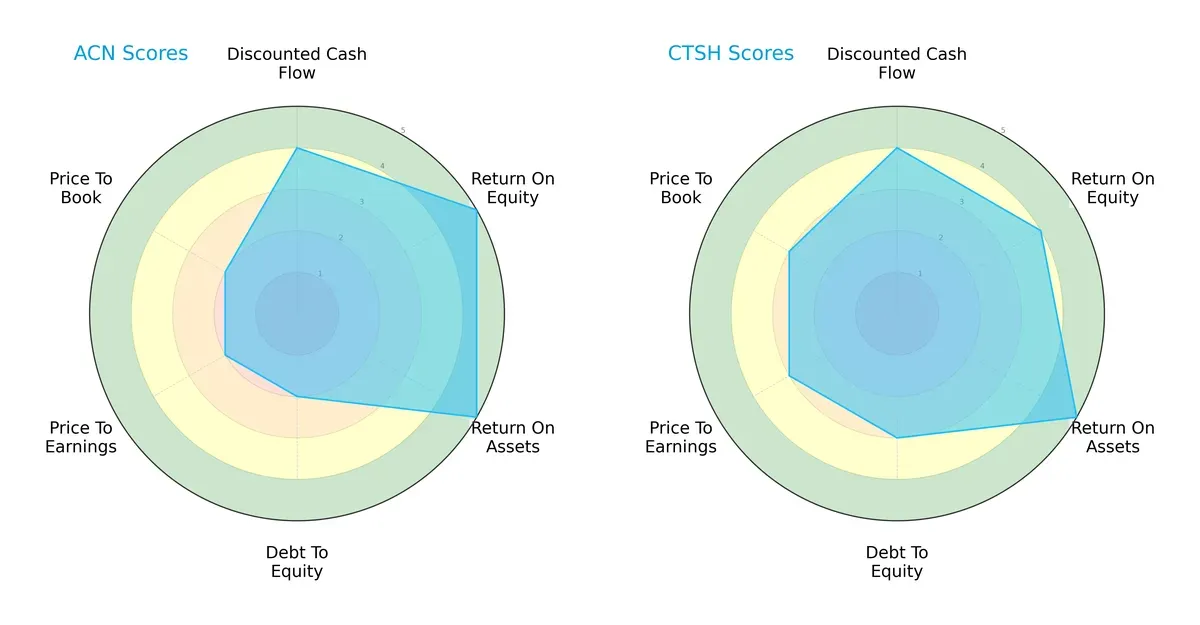
Accenture excels in return on equity (5) and return on assets (5), demonstrating operational efficiency. However, it carries higher financial risk with a debt-to-equity score of 2 and shows moderate valuation scores (P/E and P/B at 2). Cognizant maintains a more balanced profile with solid asset returns (5), slightly lower equity returns (4), and better debt management (3) plus valuation scores (3). Cognizant relies less on operational leverage and more on steadier financial footing compared to Accenture’s sharper equity edge.
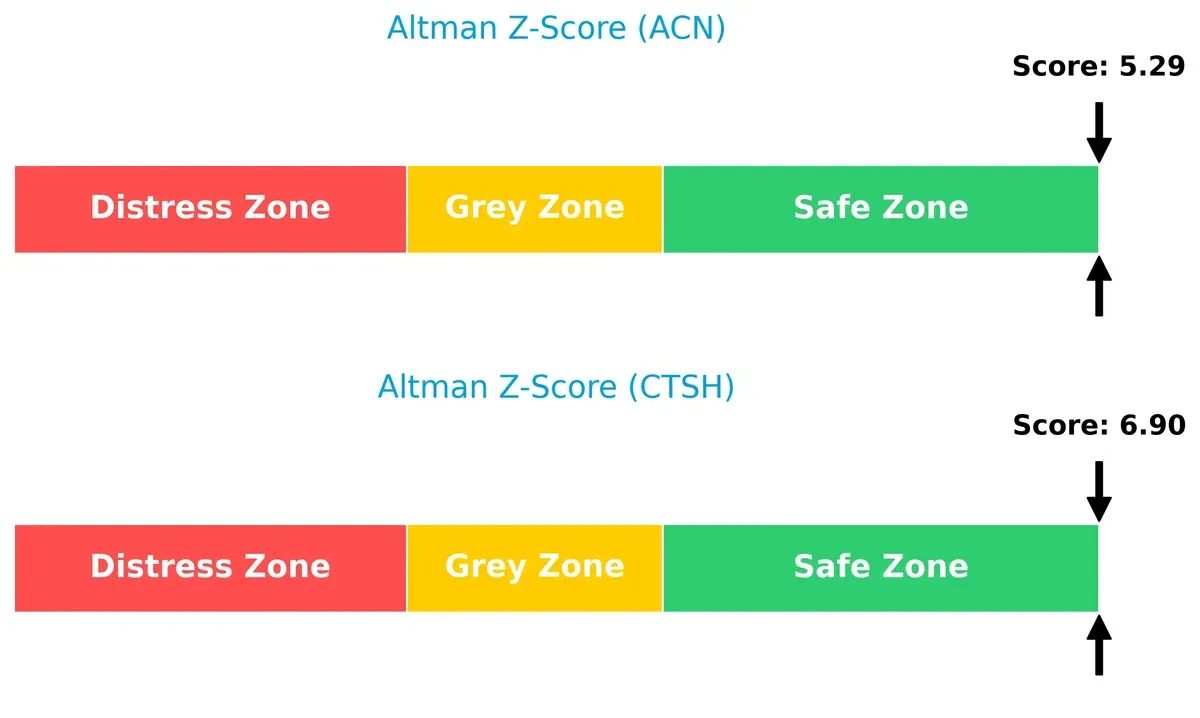
Bankruptcy Risk: Solvency Showdown
The Altman Z-Score comparison shows both firms in the safe zone with scores of 5.29 (Accenture) and 6.90 (Cognizant), indicating strong solvency and low bankruptcy risk in this economic cycle:
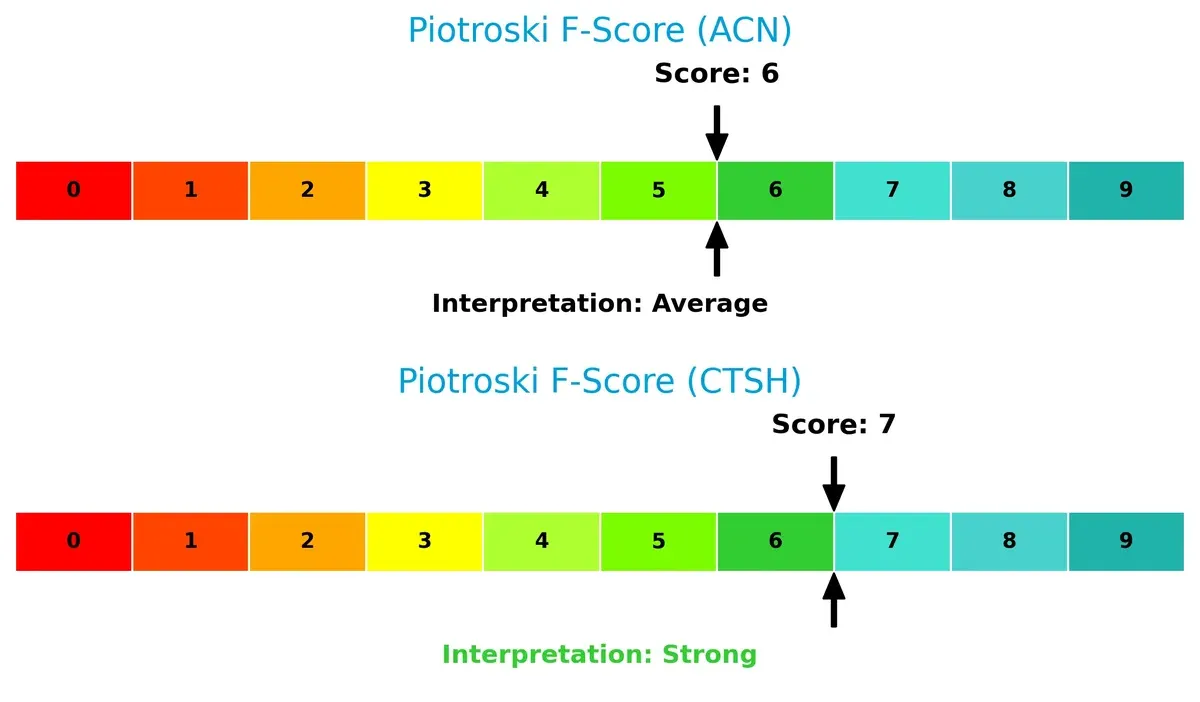
Financial Health: Quality of Operations
Cognizant’s Piotroski F-Score of 7 suggests stronger internal financial health compared to Accenture’s 6, signaling fewer red flags and better operational quality:
How are the two companies positioned?
This section dissects the operational DNA of Accenture and Cognizant by comparing their revenue distribution and internal dynamics. The goal is to confront their economic moats to identify the more resilient and sustainable competitive advantage today.
Revenue Segmentation: The Strategic Mix
The following visual comparison dissects how Accenture plc and Cognizant Technology Solutions diversify their income streams and where their primary sector bets lie:
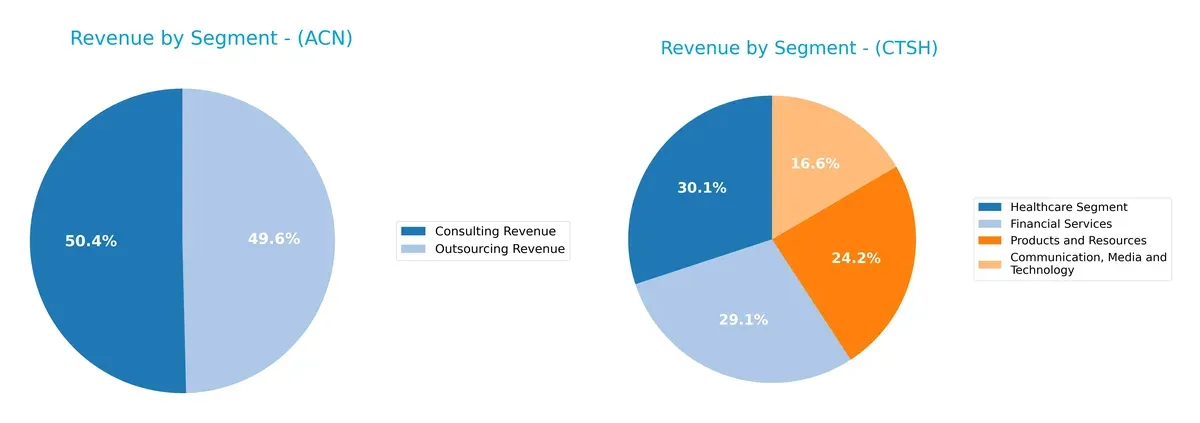
Accenture pivots on two massive segments: Consulting at $35.1B and Outsourcing at $34.6B, showing a balanced dual-core revenue model. In contrast, Cognizant’s revenue splits more evenly across four sectors, with Financial Services anchoring at $5.75B and Healthcare close behind at $5.93B. Accenture’s concentration signals strong ecosystem lock-in risk but benefits from infrastructure dominance. Cognizant’s spread reduces dependency risk but lacks a singular commanding moat.
Strengths and Weaknesses Comparison
This table compares the Strengths and Weaknesses of Accenture plc and Cognizant Technology Solutions Corporation:
Accenture plc Strengths
- Diverse revenue streams including consulting, outsourcing, and products
- Strong profitability with 11.02% net margin and 24.61% ROE
- Favorable financial ratios including low debt and high interest coverage
- Broad global presence with significant revenue in North America, Europe, and Growth Markets
- Leading market share in consulting and outsourcing services
Cognizant Technology Solutions Strengths
- Favorable net margin of 10.56%
- Favorable low debt and strong interest coverage ratio of 97.92
- Diversified revenue across technology, financial services, healthcare, and products
- Significant presence in North America and Europe
- Competitive price-to-book ratio (PB) indicating undervaluation
Accenture plc Weaknesses
- Unfavorable price-to-book ratio at 5.21, indicating potential overvaluation
- Neutral current ratio and weighted average cost of capital (WACC)
- Fewer favorable financial ratios compared to some peers
Cognizant Technology Solutions Weaknesses
- Unfavorable zero ROE and ROIC indicating poor capital efficiency
- Unavailable WACC data complicates cost of capital analysis
- Weak liquidity ratios with zero current and quick ratios reported
- Unfavorable asset turnover and fixed asset turnover reflect operational inefficiency
Overall, Accenture demonstrates robust profitability and diversified global operations, though valuation metrics suggest caution. Cognizant faces significant challenges in capital efficiency and liquidity, which could constrain its financial flexibility and growth opportunities.
The Moat Duel: Analyzing Competitive Defensibility
A structural moat protects long-term profits from competition’s relentless erosion. Only a genuine moat withstands market pressures and sustains value creation:
Accenture plc: Scale and Diversification Moat
Accenture leverages a diverse global presence and scale, driving high ROIC above WACC. Its broad service portfolio stabilizes margins. Expansion into AI and cloud deepens its moat in 2026.
Cognizant Technology Solutions Corporation: Niche Market Specialization
Cognizant’s moat centers on specialized industry expertise and client relationships, contrasting Accenture’s scale. It delivers strong EBIT margin growth but faces challenges sustaining ROIC trends. New digital healthcare services offer growth potential.
Verdict: Scale and Diversification vs. Niche Expertise
Accenture’s wider moat stems from consistent value creation and geographic reach, despite a slight ROIC decline. Cognizant’s more volatile moat lacks clear ROIC advantage. Accenture is better positioned to defend market share in an intensifying competitive landscape.
Which stock offers better returns?
The past year shows contrasting dynamics: Accenture plc’s stock declined sharply with accelerating losses, while Cognizant Technology Solutions Corporation posted a modest but steady gain.
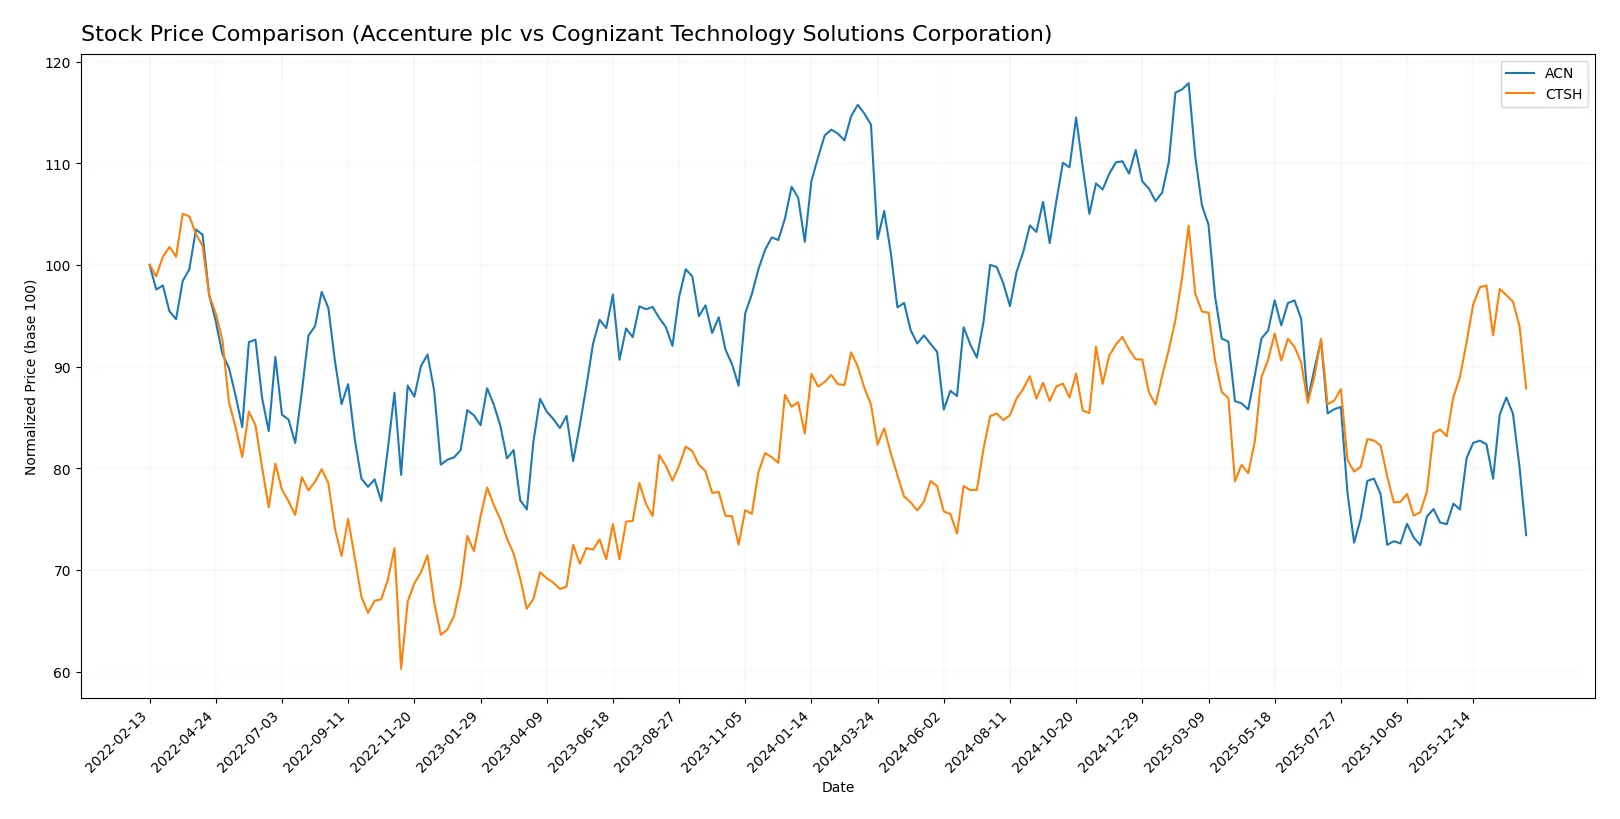
Trend Comparison
Accenture plc’s stock fell 35.49% over the past year, marking a bearish trend with accelerating decline and wide volatility between 238.39 and 388.0. Recent months show a slight negative slope despite buyer dominance.
Cognizant Technology Solutions Corporation’s share price rose 1.83%, showing a bullish but modest acceleration with lower volatility. The recent trend remains positive, supported by steady buyer interest.
Cognizant delivered the highest market performance, outperforming Accenture’s sizable loss in the same period despite both showing buyer dominance in recent trading.
Target Prices
Analysts project solid upside potential across these IT services leaders, reflecting confidence in their strategic positioning.
| Company | Target Low | Target High | Consensus |
|---|---|---|---|
| Accenture plc | 265 | 330 | 302.93 |
| Cognizant Technology Solutions Corporation | 82 | 107 | 94.44 |
The consensus targets for Accenture and Cognizant sit well above current prices, indicating expected growth. Accenture’s 25% upside contrasts with Cognizant’s roughly 23% potential, suggesting attractive entry points for long-term investors.

Don’t Let Luck Decide Your Entry Point
Optimize your entry points with our advanced ProRealTime indicators. You’ll get efficient buy signals with precise price targets for maximum performance. Start outperforming now!
How do institutions grade them?
Here is a comparison of the latest reliable institutional grades for Accenture plc and Cognizant Technology Solutions Corporation:
Accenture plc Grades
The table below shows recent grades and actions from well-known financial institutions for Accenture plc.
| Grading Company | Action | New Grade | Date |
|---|---|---|---|
| Wells Fargo | Maintain | Equal Weight | 2026-01-14 |
| Susquehanna | Maintain | Neutral | 2025-12-19 |
| RBC Capital | Maintain | Outperform | 2025-12-19 |
| UBS | Maintain | Buy | 2025-12-19 |
| Morgan Stanley | Upgrade | Overweight | 2025-12-16 |
| Mizuho | Maintain | Outperform | 2025-09-29 |
| JP Morgan | Maintain | Overweight | 2025-09-26 |
| Guggenheim | Maintain | Buy | 2025-09-26 |
| TD Cowen | Maintain | Buy | 2025-09-26 |
| Baird | Maintain | Outperform | 2025-09-26 |
Cognizant Technology Solutions Corporation Grades
Below are recent grades and actions from reputable grading companies for Cognizant Technology Solutions Corporation.
| Grading Company | Action | New Grade | Date |
|---|---|---|---|
| Guggenheim | Maintain | Buy | 2026-01-28 |
| Citigroup | Maintain | Neutral | 2026-01-22 |
| Wells Fargo | Maintain | Overweight | 2026-01-14 |
| TD Cowen | Maintain | Hold | 2026-01-09 |
| UBS | Maintain | Neutral | 2025-12-08 |
| William Blair | Upgrade | Outperform | 2025-11-21 |
| UBS | Maintain | Neutral | 2025-10-30 |
| Wells Fargo | Maintain | Overweight | 2025-10-30 |
| RBC Capital | Maintain | Sector Perform | 2025-10-30 |
| JP Morgan | Maintain | Overweight | 2025-10-30 |
Which company has the best grades?
Accenture holds stronger grades overall, with multiple “Buy,” “Outperform,” and “Overweight” ratings, including a recent upgrade from Morgan Stanley. Cognizant’s grades lean toward “Neutral” and “Overweight,” with fewer upgrades. Investors may view Accenture’s higher consensus grades as a signal of greater confidence from analysts.
Risks specific to each company
The following categories identify critical pressure points and systemic threats facing both firms in the 2026 market environment:
1. Market & Competition
Accenture plc
- Strong global presence with diversified services, facing intense competition in digital and cloud sectors.
Cognizant Technology Solutions Corporation
- Narrower service scope with reliance on North American markets; competition pressures margins and growth.
2. Capital Structure & Debt
Accenture plc
- Low debt-to-equity ratio (0.26) supports financial flexibility and resilience.
Cognizant Technology Solutions Corporation
- Virtually no debt reported, indicating minimal leverage but possible underutilization of capital structure.
3. Stock Volatility
Accenture plc
- Beta at 1.236 suggests above-market volatility but with potential for higher returns.
Cognizant Technology Solutions Corporation
- Lower beta (0.947) implies less price fluctuation, reflecting stable but slower stock movement.
4. Regulatory & Legal
Accenture plc
- Global operations expose it to complex regulatory environments and compliance costs.
Cognizant Technology Solutions Corporation
- Concentration in US markets limits global regulatory risk but increases exposure to domestic policy changes.
5. Supply Chain & Operations
Accenture plc
- Extensive global delivery model risks disruptions from geopolitical tensions and labor market shifts.
Cognizant Technology Solutions Corporation
- Operational scale smaller but concentrated; supply chain risks tied to key client industries.
6. ESG & Climate Transition
Accenture plc
- Strong sustainability initiatives align with investor demands, but ongoing costs may pressure margins.
Cognizant Technology Solutions Corporation
- ESG efforts less visible, posing potential reputational risk amid rising stakeholder scrutiny.
7. Geopolitical Exposure
Accenture plc
- Significant international footprint heightens exposure to global trade tensions and currency fluctuations.
Cognizant Technology Solutions Corporation
- Primarily US-focused, limiting geopolitical risk but vulnerable to domestic political shifts.
Which company shows a better risk-adjusted profile?
Accenture’s main risk lies in geopolitical and regulatory complexity due to its global scale. Cognizant faces capital structure and operational concentration risks. I see Accenture’s diversified business and stronger financial ratios delivering a better risk-adjusted profile, supported by its 16.99% ROIC versus Cognizant’s missing data, signaling more consistent value creation.
Final Verdict: Which stock to choose?
Accenture’s superpower lies in its unmatched operational efficiency and robust capital returns, consistently creating value above its cost of capital. Its point of vigilance is a slightly declining profitability trend, which could signal emerging competitive pressures. This stock suits portfolios aiming for aggressive growth with a tolerance for cyclical shifts.
Cognizant’s strategic moat is grounded in its strong recurring revenue model and conservative balance sheet, offering steadier cash flow stability compared to Accenture. While its growth metrics lag, its valuation profile suggests a more defensive stance. It fits well within Growth at a Reasonable Price (GARP) portfolios seeking stability amid modest expansion.
If you prioritize dynamic value creation and operational excellence, Accenture outshines due to its superior returns on invested capital and market leadership. However, if you seek better stability and a more conservative risk profile, Cognizant offers a compelling scenario with a steadier cash flow base despite slower growth. Both present distinct analytical cases depending on your investment strategy and risk tolerance.
Disclaimer: Investment carries a risk of loss of initial capital. The past performance is not a reliable indicator of future results. Be sure to understand risks before making an investment decision.
Go Further
I encourage you to read the complete analyses of Accenture plc and Cognizant Technology Solutions Corporation to enhance your investment decisions: