Home > Comparison > Technology > ACN vs CDW
The strategic rivalry between Accenture plc and CDW Corporation shapes the trajectory of the technology services sector. Accenture operates as a global consulting and digital transformation powerhouse, while CDW focuses on IT solutions and hardware distribution across multiple markets. This contrast highlights a battle between broad-scale innovation and targeted IT integration. This analysis aims to identify which model offers superior risk-adjusted returns for a diversified portfolio.

Table of contents
Companies Overview
Accenture plc and CDW Corporation stand as key players in the technology services sector, shaping IT solutions globally.
Accenture plc: Global Leader in Digital Transformation
Accenture dominates the professional services landscape by delivering strategy, consulting, and technology operations worldwide. Its revenue engine relies heavily on digital transformation services, including agile application development, cloud migration, and intelligent automation. In 2026, Accenture’s strategic focus emphasizes expanding AI-driven innovation and sustainable solutions to maintain its competitive edge.
CDW Corporation: Premier IT Solutions Provider
CDW specializes in IT hardware and software distribution combined with integrated solutions across corporate and public sectors in North America and the UK. The company generates revenue primarily through selling technology products and delivering advisory, managed, and implementation services. In 2026, CDW concentrates on enhancing hybrid cloud capabilities and expanding security offerings to deepen customer engagement.
Strategic Collision: Similarities & Divergences
Both companies operate within the information technology services sector but differ in approach. Accenture pursues a broad consulting and innovation-driven model, while CDW centers on product distribution paired with service integration. Their primary battleground lies in cloud and cybersecurity solutions for enterprise clients. These distinct models create unique investment profiles: Accenture as a growth-oriented consultancy, CDW as a solutions integrator focused on operational efficiency.
Income Statement Comparison
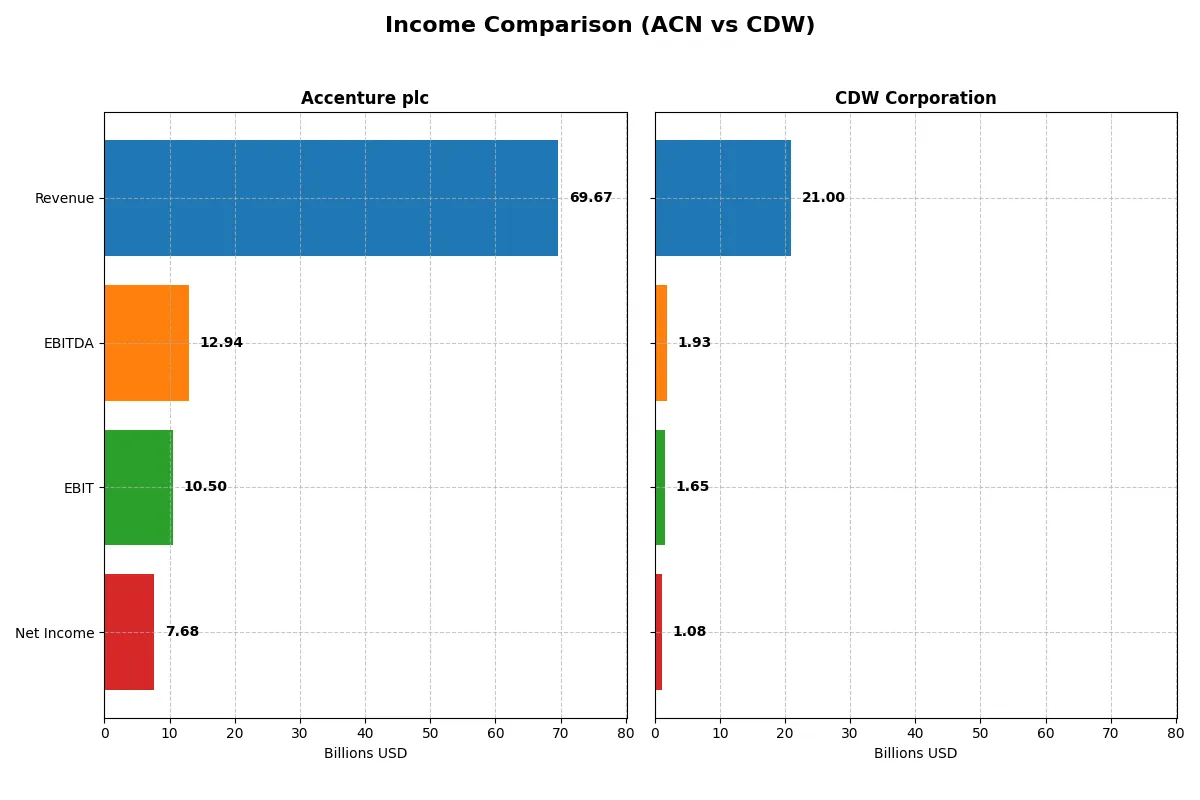
This data dissects the core profitability and scalability of both corporate engines to reveal who dominates the bottom line:
| Metric | Accenture plc (ACN) | CDW Corporation (CDW) |
|---|---|---|
| Revenue | 69.7B | 21.0B |
| Cost of Revenue | 47.4B | 16.4B |
| Operating Expenses | 12.0B | 3.0B |
| Gross Profit | 22.2B | 4.6B |
| EBITDA | 12.9B | 1.9B |
| EBIT | 10.5B | 1.6B |
| Interest Expense | 229M | 215M |
| Net Income | 7.7B | 1.1B |
| EPS | 12.29 | 8.06 |
| Fiscal Year | 2025 | 2024 |
Income Statement Analysis: The Bottom-Line Duel
This comparison will reveal which company converts revenue into profit more efficiently, exposing the strength of each corporate engine.
Accenture plc Analysis
Accenture’s revenue grew steadily from 50.5B in 2021 to 69.7B in 2025, with net income rising from 5.9B to 7.7B. Its gross margin holds strong around 32%, and net margin exceeds 11%, signaling solid cost control. The 2025 fiscal year shows healthy momentum with a 7.4% revenue increase and a favorable 6.2% EPS growth, despite a slight net margin dip.
CDW Corporation Analysis
CDW’s revenue peaked at 23.7B in 2022 but slipped to 21B by 2024, with net income moving from 989M in 2021 to 1.08B in 2024. Gross margin remains modest at 22%, and net margin hovers near 5%. The latest year’s slight declines in revenue, gross profit, and EPS reflect headwinds impacting efficiency and growth momentum.
Margin Strength vs. Revenue Expansion
Accenture outperforms CDW with higher margins and more consistent revenue growth over five years. Its superior gross and net margins underline stronger operational efficiency. For investors, Accenture’s profile offers robust profitability and growth stability, whereas CDW’s lower margins and recent declines suggest a more cautious outlook.
Financial Ratios Comparison
These vital ratios act as a diagnostic tool to expose the underlying fiscal health, valuation premiums, and capital efficiency of the companies compared below:
| Ratios | Accenture plc (ACN) | CDW Corporation (CDW) |
|---|---|---|
| ROE | 24.6% | 45.8% |
| ROIC | 17.0% | 13.1% |
| P/E | 21.2 | 21.6 |
| P/B | 5.21 | 9.90 |
| Current Ratio | 1.42 | 1.35 |
| Quick Ratio | 1.42 | 1.24 |
| D/E (Debt-to-Equity) | 0.26 | 2.55 |
| Debt-to-Assets | 12.5% | 40.8% |
| Interest Coverage | 44.7 | 7.70 |
| Asset Turnover | 1.07 | 1.43 |
| Fixed Asset Turnover | 16.2 | 67.3 |
| Payout Ratio | 48.2% | 30.8% |
| Dividend Yield | 2.28% | 1.43% |
| Fiscal Year | 2025 | 2024 |
Efficiency & Valuation Duel: The Vital Signs
Financial ratios serve as the company’s DNA, unveiling hidden risks and operational excellence that mere numbers alone cannot reveal.
Accenture plc
Accenture demonstrates strong profitability with a 24.6% ROE and an 11.0% net margin, signaling operational efficiency. The P/E ratio of 21.16 marks a neutral valuation, while a high PB ratio of 5.21 appears stretched. Shareholders benefit from a 2.28% dividend yield, reflecting disciplined capital allocation and steady income.
CDW Corporation
CDW posts an impressive 45.8% ROE but a modest 5.1% net margin, indicating high leverage and operational pressure. Its P/E ratio at 21.61 is neutral, yet a 9.9 PB ratio suggests overvaluation. The company shows a lower 1.43% dividend yield amid significant debt, implying a riskier capital structure despite growth potential.
Balanced Profitability vs. Leverage Risk
Accenture offers a more balanced risk-reward profile with solid profitability, moderate valuation, and shareholder returns. CDW’s elevated ROE is offset by higher leverage and valuation concerns. Investors seeking stable income may prefer Accenture, while those tolerating leverage risk might consider CDW’s growth-driven profile.
Which one offers the Superior Shareholder Reward?
I see Accenture (ACN) offers a more attractive shareholder reward than CDW Corporation (CDW) in 2026. ACN’s dividend yield stands at 2.28% with a sustainable payout ratio near 48%, backed by strong free cash flow coverage of 95%. ACN also runs aggressive buybacks, boosting total returns. CDW yields 1.43% with a lower payout ratio around 31%, but its heavy leverage (debt-to-equity over 2.5) threatens dividend sustainability. CDW’s buybacks are modest, constrained by weaker cash flow ratios and high debt costs. I conclude ACN’s balanced dividend and buyback approach delivers superior, more durable shareholder value.
Comparative Score Analysis: The Strategic Profile
The radar chart reveals the core DNA and strategic trade-offs of Accenture plc and CDW Corporation, highlighting their financial strengths and valuation nuances:
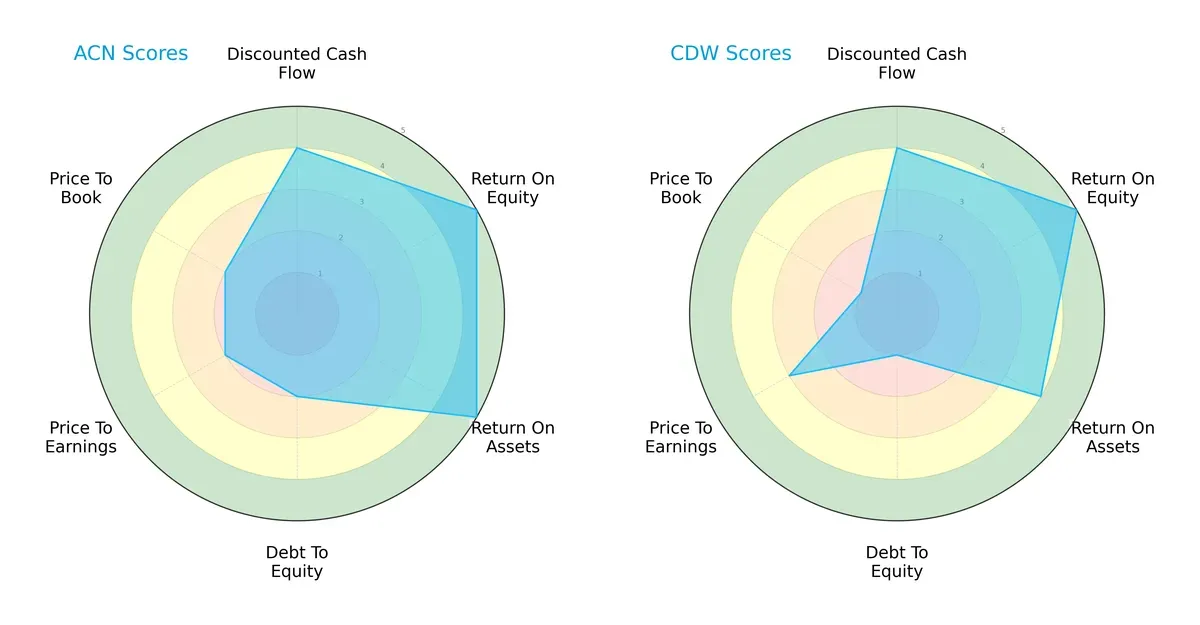
Accenture shows a balanced profile with strong ROE and ROA scores at 5, but moderate leverage and valuation scores (Debt/Equity, P/E, P/B all at 2). CDW matches Accenture’s ROE at 5 but lags slightly on ROA (4) and suffers from weaker debt and valuation metrics, scoring 1 in Debt/Equity and P/B. Accenture’s moderate leverage contrasts with CDW’s higher financial risk, indicating Accenture’s more stable capital structure. CDW’s valuation scores suggest it may be less attractively priced, relying more on operational efficiency as its edge.
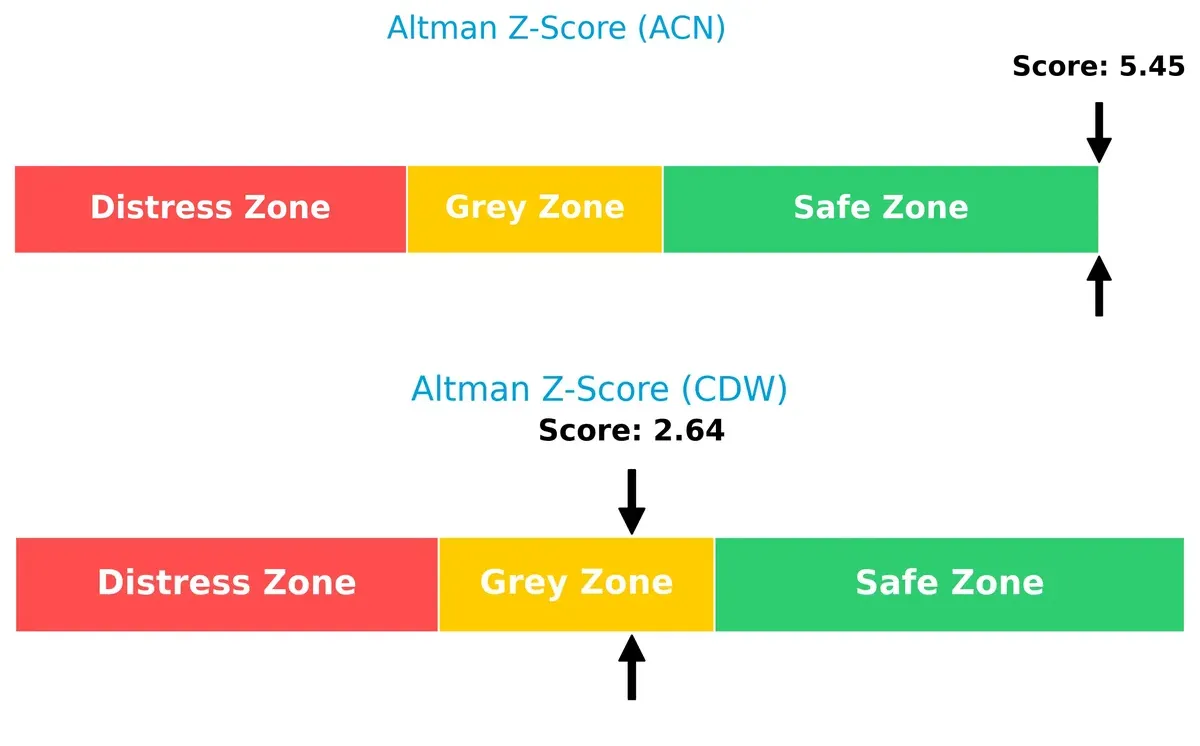
Bankruptcy Risk: Solvency Showdown
Accenture’s Altman Z-Score of 5.45 places it well within the safe zone, signaling robust financial stability. CDW’s score of 2.64 falls in the grey zone, indicating moderate bankruptcy risk in this economic cycle:
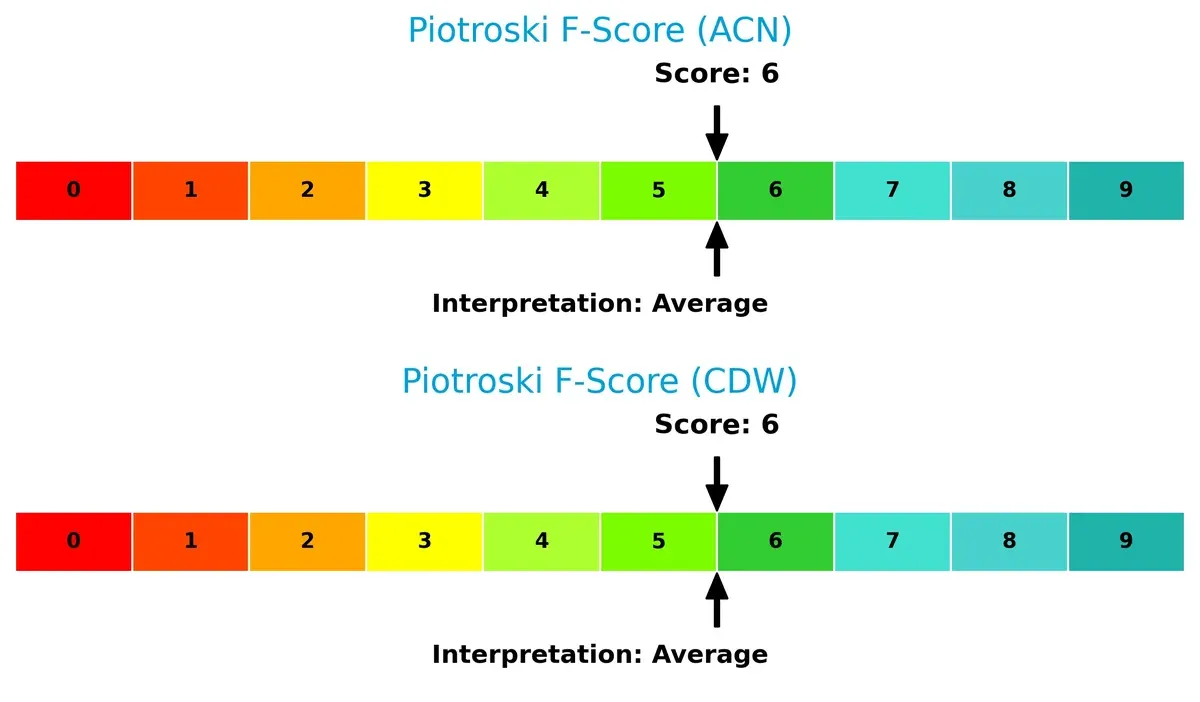
Financial Health: Quality of Operations
Both firms score a 6 on the Piotroski F-Score, reflecting average financial health with no glaring red flags. Neither exhibits peak operational quality, but both maintain solid fundamentals without significant internal weaknesses:
How are the two companies positioned?
This section dissects Accenture and CDW’s operational DNA by comparing their revenue distribution and internal strengths and weaknesses. The goal is to confront their economic moats to reveal which model delivers the most resilient competitive advantage today.
Revenue Segmentation: The Strategic Mix
This visual comparison dissects how Accenture plc and CDW Corporation diversify their income streams and reveals their primary sector bets:
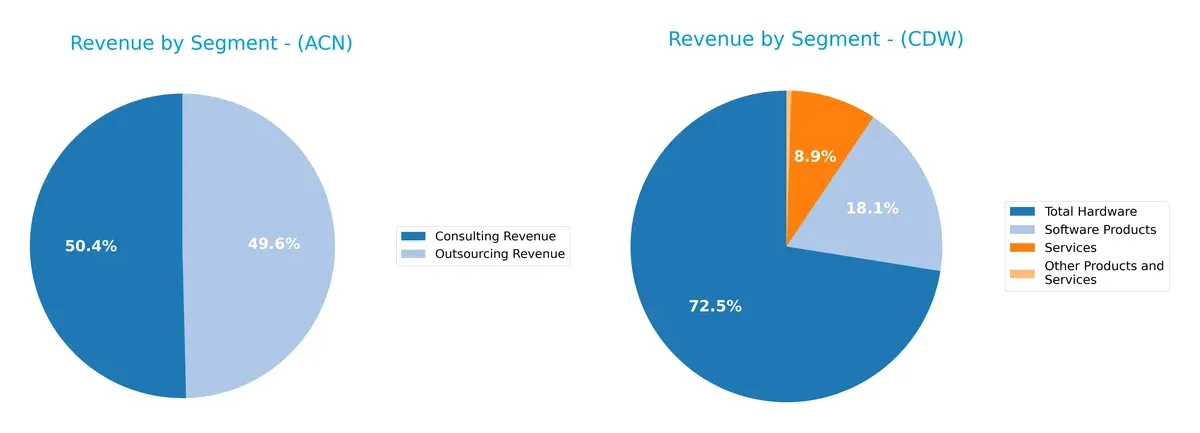
Accenture anchors its revenue in two large segments: Consulting at $35B and Outsourcing near $35B, showing a balanced dual focus. CDW relies heavily on Total Hardware at $15.2B, dwarfing Software Products ($3.8B) and Services ($1.9B). Accenture’s mix reflects strategic consulting and managed services ecosystem lock-in. CDW’s concentration in hardware signals infrastructure dominance but poses concentration risk amid tech shifts.
Strengths and Weaknesses Comparison
This table compares the Strengths and Weaknesses of Accenture plc and CDW Corporation:
Accenture plc Strengths
- Diversified revenue streams across consulting, outsourcing, and multiple industries
- Strong profitability with 11.02% net margin and 24.61% ROE
- Favorable liquidity and low debt levels with 1.42 quick ratio and 12.51% debt-to-assets
- Global presence with significant revenues in North America, Europe, and Growth Markets
- Solid asset turnover ratios indicating efficient use of resources
CDW Corporation Strengths
- High ROE of 45.81% reflecting strong shareholder returns
- Favorable WACC of 7.31% supporting cost-effective capital structure
- Robust asset turnover and fixed asset turnover ratios indicating operational efficiency
- Market presence concentrated in hardware, software, and services with strong US sales
- Favorable interest coverage ratio ensuring debt serviceability
Accenture plc Weaknesses
- Price-to-book ratio unfavorable at 5.21, suggesting potential overvaluation
- Neutral current ratio at 1.42 could limit short-term flexibility
- Moderate PE ratio of 21.16 indicating neutral market valuation
- Relatively lower dividend yield compared to some peers
CDW Corporation Weaknesses
- Lower net margin at 5.13% compared to industry leaders
- High debt-to-equity ratio at 2.55, increasing financial risk
- Price-to-book ratio unfavorable at 9.9, reflecting possible overvaluation
- Dividend yield neutral at 1.43%, less attractive for income investors
Accenture’s strengths lie in its diversified business model and strong profitability metrics, which support its global strategy. CDW’s high ROE and operational efficiency highlight focused capital use but carry higher leverage risks, affecting financial prudence.
The Moat Duel: Analyzing Competitive Defensibility
A structural moat is the only thing protecting a company’s long-term profits from relentless competition erosion. Let’s dissect the moats of two IT service leaders:
Accenture plc: Intangible Asset Fortress
Accenture’s moat stems from its intangible assets — brand reputation, proprietary methodologies, and deep client relationships. This shows in strong 15% EBIT margins and stable revenue growth. In 2026, digital transformation and AI consulting could further deepen this moat.
CDW Corporation: Cost and Distribution Edge
CDW relies on cost advantage and extensive distribution networks, differentiating it from Accenture’s asset-heavy moat. Its lower 7.9% EBIT margin highlights thinner profitability but efficient capital use. Expansion into cloud and hybrid IT markets may boost its competitive stance in 2026.
Intangible Assets vs. Cost Leadership: Who Guards the Future Better?
Both firms create value with ROIC above WACC, yet Accenture’s intangible asset moat is wider and more resilient. I see Accenture better equipped to defend and grow market share amid evolving technology demands.
Which stock offers better returns?
The past year reveals contrasting dynamics: Accenture’s price fell sharply but accelerated upward recently, while CDW experienced a deeper decline with slowing losses.
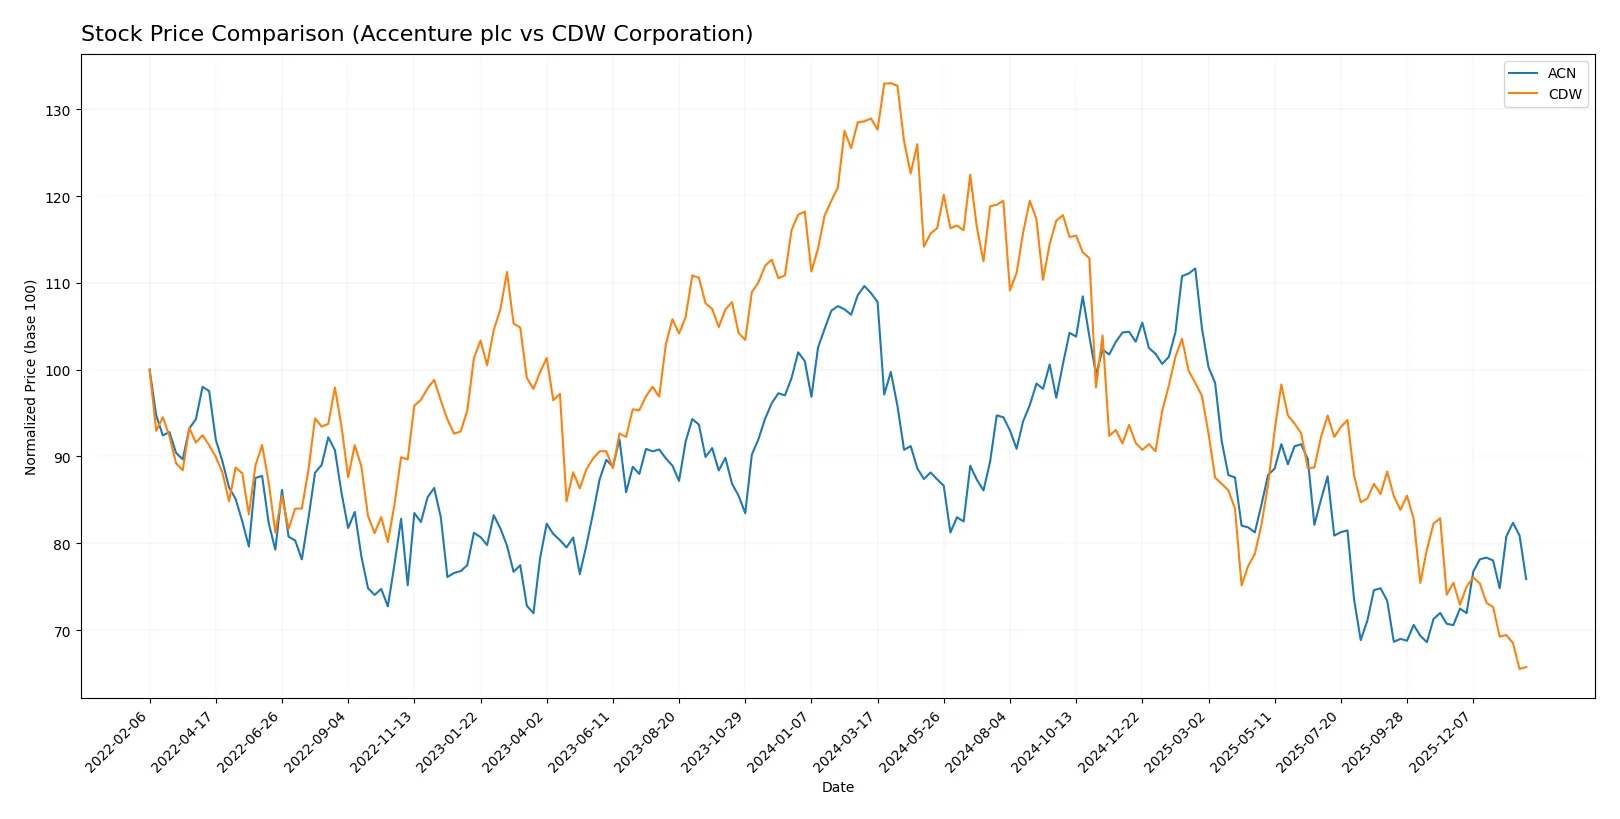
Trend Comparison
Accenture’s stock declined 30.29% over the past 12 months, showing a bearish trend with accelerating momentum and high volatility (std dev 41.98). A recent 7.52% rally signals a possible rebound.
CDW’s stock dropped 49.03% over the past year, reflecting a bearish trend with decelerating losses and moderate volatility (std dev 34.02). The recent trend weakened further with a 12.88% decline.
Accenture outperformed CDW in market performance, registering a smaller overall loss and showing recent bullish recovery against CDW’s continued weakening.
Target Prices
Analysts present a cautiously optimistic consensus for these technology service leaders.
| Company | Target Low | Target High | Consensus |
|---|---|---|---|
| Accenture plc | 265 | 330 | 302.93 |
| CDW Corporation | 141 | 190 | 168.8 |
The consensus target prices for Accenture and CDW sit well above their current prices of 264 and 126, indicating expected upside reflecting strong operational momentum and market positioning.

Don’t Let Luck Decide Your Entry Point
Optimize your entry points with our advanced ProRealTime indicators. You’ll get efficient buy signals with precise price targets for maximum performance. Start outperforming now!
How do institutions grade them?
Here is a comparison of institutional grades for Accenture plc and CDW Corporation:
Accenture plc Grades
The following table summarizes recent grades from established financial institutions for Accenture plc.
| Grading Company | Action | New Grade | Date |
|---|---|---|---|
| Wells Fargo | Maintain | Equal Weight | 2026-01-14 |
| UBS | Maintain | Buy | 2025-12-19 |
| Susquehanna | Maintain | Neutral | 2025-12-19 |
| RBC Capital | Maintain | Outperform | 2025-12-19 |
| Morgan Stanley | Upgrade | Overweight | 2025-12-16 |
| Mizuho | Maintain | Outperform | 2025-09-29 |
| Evercore ISI Group | Maintain | Outperform | 2025-09-26 |
| BMO Capital | Maintain | Market Perform | 2025-09-26 |
| TD Cowen | Maintain | Buy | 2025-09-26 |
| Goldman Sachs | Maintain | Buy | 2025-09-26 |
CDW Corporation Grades
The following table summarizes recent grades from established financial institutions for CDW Corporation.
| Grading Company | Action | New Grade | Date |
|---|---|---|---|
| Citigroup | Maintain | Neutral | 2026-01-20 |
| Morgan Stanley | Downgrade | Equal Weight | 2026-01-20 |
| Morgan Stanley | Maintain | Overweight | 2025-12-17 |
| Raymond James | Upgrade | Strong Buy | 2025-11-25 |
| UBS | Maintain | Buy | 2025-11-05 |
| Barclays | Maintain | Equal Weight | 2025-11-05 |
| Evercore ISI Group | Maintain | Outperform | 2025-10-20 |
| Barclays | Maintain | Equal Weight | 2025-08-07 |
| UBS | Maintain | Buy | 2025-08-07 |
| JP Morgan | Maintain | Neutral | 2025-07-17 |
Which company has the best grades?
Accenture displays a consistent mix of Buy, Outperform, and an upgrade to Overweight from Morgan Stanley. CDW shows a Strong Buy upgrade from Raymond James but also recent downgrades. Accenture’s grades suggest steadier institutional confidence, which may appeal to risk-conscious investors.
Risks specific to each company
The following categories identify critical pressure points and systemic threats facing both firms in the 2026 market environment:
1. Market & Competition
Accenture plc
- Dominates global IT services with diversified offerings and strong innovation. Faces intense competition in digital transformation space.
CDW Corporation
- Competes in IT solutions with focus on hardware/software distribution; faces margin pressure from commoditized products.
2. Capital Structure & Debt
Accenture plc
- Maintains conservative leverage with debt-to-equity of 0.26 and strong interest coverage of 45.94.
CDW Corporation
- High debt-to-equity at 2.55 raises financial risk despite manageable interest coverage of 7.69.
3. Stock Volatility
Accenture plc
- Beta of 1.25 indicates moderate volatility aligned with tech sector norms.
CDW Corporation
- Slightly lower beta of 1.07 suggests marginally lower market risk exposure.
4. Regulatory & Legal
Accenture plc
- Global operations expose it to complex regulatory environments, especially data privacy and cybersecurity laws.
CDW Corporation
- US-centric focus limits regulatory complexity but increases dependency on domestic policy stability.
5. Supply Chain & Operations
Accenture plc
- Operates with strong service delivery model; less impacted by physical supply chain disruptions.
CDW Corporation
- Heavily reliant on hardware supply chains, vulnerable to component shortages and logistics delays.
6. ESG & Climate Transition
Accenture plc
- Proactive in sustainability consulting; integrates ESG in strategy, enhancing brand and client trust.
CDW Corporation
- ESG efforts improving but less mature; supply chain emissions and waste management remain challenges.
7. Geopolitical Exposure
Accenture plc
- Broad international footprint entails exposure to geopolitical tensions and currency fluctuations.
CDW Corporation
- Primarily North American market limits geopolitical risk but may miss growth from emerging regions.
Which company shows a better risk-adjusted profile?
Accenture’s strongest risk is geopolitical and regulatory complexity but is offset by conservative leverage and robust profitability. CDW’s largest risk lies in its high debt and supply chain vulnerabilities. Accenture’s Altman Z-Score of 5.45 (safe zone) versus CDW’s 2.64 (grey zone) confirms a superior risk-adjusted profile for Accenture. The recent surge in CDW’s debt-to-equity ratio to 2.55 signals heightened financial risk, reinforcing my caution.
Final Verdict: Which stock to choose?
Accenture plc’s superpower lies in its unmatched operational efficiency and consistent value creation through a strong ROIC above WACC. Its main point of vigilance is a slightly declining profitability trend, suggesting investors watch margin pressures closely. This stock fits well in an Aggressive Growth portfolio seeking durable competitive advantages.
CDW Corporation’s strategic moat is its robust return on equity supported by effective capital use, despite carrying higher debt levels. Compared to Accenture, it offers a slightly riskier but financially resilient profile backed by solid revenue growth over the longer term. CDW suits a GARP portfolio, blending growth potential with reasonable valuation.
If you prioritize operational excellence and stable value creation, Accenture outshines due to its superior efficiency and healthier balance sheet. However, if you seek growth with a tolerance for leverage, CDW offers better upside potential supported by strong equity returns. Both stocks present analytical scenarios for distinct investor profiles balancing risk and growth.
Disclaimer: Investment carries a risk of loss of initial capital. The past performance is not a reliable indicator of future results. Be sure to understand risks before making an investment decision.
Go Further
I encourage you to read the complete analyses of Accenture plc and CDW Corporation to enhance your investment decisions: