Home > Comparison > Technology > ACN vs AI
The strategic rivalry between Accenture plc and C3.ai, Inc. shapes the future of the technology sector. Accenture operates as a capital-intensive global consulting and technology services powerhouse. In contrast, C3.ai focuses on high-margin, specialized enterprise AI software solutions. This head-to-head represents a clash between diversified service scale and niche innovation. This analysis will identify which business model delivers superior risk-adjusted returns for a well-rounded portfolio.

Table of contents
Companies Overview
Accenture and C3.ai stand as key players reshaping enterprise technology landscapes.
Accenture plc: Global Consulting and Technology Powerhouse
Accenture commands the professional services market with a broad portfolio in strategy, consulting, and technology operations. Its core revenue derives from delivering agile transformation, cloud infrastructure, and intelligent automation services worldwide. In 2026, Accenture sharpens its focus on digital innovation and sustainability, integrating AI and cybersecurity to future-proof client enterprises.
C3.ai, Inc.: Enterprise AI Software Innovator
C3.ai leads in enterprise artificial intelligence software, offering an AI application platform and specialized solutions for industries like oil & gas and financial services. Its revenue engine centers on subscription-based AI applications that optimize inventory, supply chains, and predictive maintenance. The company’s 2026 strategy emphasizes expanding AI adoption through strategic partnerships and enhancing industry-specific AI capabilities.
Strategic Collision: Similarities & Divergences
Accenture and C3.ai both prioritize technology-driven transformation, yet Accenture operates a broad consulting ecosystem while C3.ai focuses narrowly on AI software platforms. Their primary battleground is enterprise digitalization, with Accenture providing end-to-end services and C3.ai delivering specialized AI tools. These distinctions create contrasting investment profiles: Accenture offers scale and diversification, whereas C3.ai presents a high-growth, niche AI play.
Income Statement Comparison
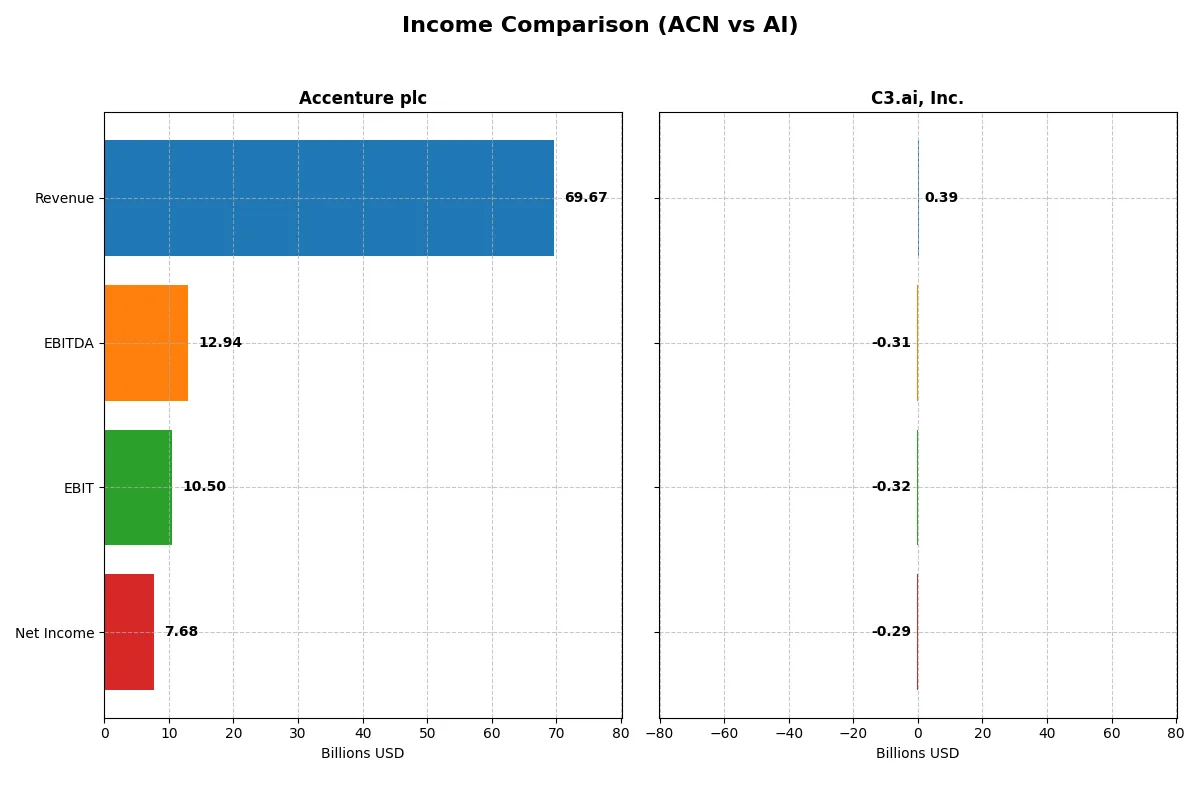
This data dissects the core profitability and scalability of both corporate engines to reveal who dominates the bottom line:
| Metric | Accenture plc (ACN) | C3.ai, Inc. (AI) |
|---|---|---|
| Revenue | 69.7B | 389M |
| Cost of Revenue | 47.4B | 153M |
| Operating Expenses | 12.0B | 560M |
| Gross Profit | 22.2B | 236M |
| EBITDA | 12.9B | -312M |
| EBIT | 10.5B | -324M |
| Interest Expense | 229M | 0 |
| Net Income | 7.7B | -289M |
| EPS | 12.29 | -2.24 |
| Fiscal Year | 2025 | 2025 |
Income Statement Analysis: The Bottom-Line Duel
This income statement comparison reveals the true efficiency and profitability of Accenture plc and C3.ai, Inc. as corporate engines powering growth and shareholder value.
Accenture plc Analysis
Accenture’s revenue climbed steadily from $50.5B in 2021 to $69.7B in 2025, growing 38% over five years. Net income followed, rising from $5.9B to $7.7B, reflecting solid operational control. Its gross margin held firm near 32%, while net margin hovered above 11%, demonstrating strong cost discipline and efficient capital allocation. The 2025 fiscal year showed favorable momentum with 7.4% revenue growth and expanding EBIT.
C3.ai, Inc. Analysis
C3.ai’s revenue grew aggressively from $183M in 2021 to $389M in 2025, a 112% increase. However, net losses widened from -$56M to -$289M, reflecting ongoing investment and operational challenges. Despite a robust 61% gross margin, negative EBIT margins near -83% indicate high expenses eroding profitability. The 2025 fiscal year showed revenue acceleration but persistent net losses, signaling a growth-at-a-cost profile.
Margin Power vs. Revenue Scale
Accenture delivers a clear fundamental advantage with sustained profitability and margin strength alongside steady revenue growth. C3.ai shows impressive top-line momentum but remains unprofitable due to heavy spending. For investors prioritizing reliable earnings and margin stability, Accenture’s profile stands out as more attractive in 2026’s market environment.
Financial Ratios Comparison
These vital ratios act as a diagnostic tool to expose the underlying fiscal health, valuation premiums, and capital efficiency of the companies compared below:
| Ratios | Accenture plc (ACN) | C3.ai, Inc. (AI) |
|---|---|---|
| ROE | 24.6% | -34.4% |
| ROIC | 17.0% | -36.1% |
| P/E | 21.2 | -9.8 |
| P/B | 5.21 | 3.39 |
| Current Ratio | 1.42 | 6.86 |
| Quick Ratio | 1.42 | 6.86 |
| D/E (Debt-to-Equity) | 0.26 | 0.006 |
| Debt-to-Assets | 12.5% | 0.47% |
| Interest Coverage | 44.7 | 0 |
| Asset Turnover | 1.07 | 0.38 |
| Fixed Asset Turnover | 16.18 | 4.91 |
| Payout ratio | 48.2% | 0 |
| Dividend yield | 2.28% | 0 |
| Fiscal Year | 2025 | 2025 |
Efficiency & Valuation Duel: The Vital Signs
Financial ratios act as the company’s DNA, revealing hidden risks and operational excellence that raw numbers alone cannot expose.
Accenture plc
Accenture posts a strong 24.6% ROE and solid 11% net margin, signaling robust profitability. Its P/E of 21.2 is fairly valued, while a P/B of 5.2 appears stretched. The company distributes a 2.28% dividend yield, rewarding shareholders while maintaining operational efficiency and steady capital allocation.
C3.ai, Inc.
C3.ai struggles with a negative 34.4% ROE and a severe -74.2% net margin, reflecting ongoing losses. Despite a negative P/E, its P/B of 3.4 and high current ratio suggest financial caution. The firm reinvests heavily in R&D, evidenced by high expenses, but offers no dividends or buybacks, heightening risk.
Proven Profitability vs. Growth Uncertainty
Accenture’s ratios demonstrate a favorable balance of profitability, valuation, and shareholder returns. C3.ai exhibits unfavorable financial health and valuation metrics, reflecting early-stage growth pains. Investors favoring stability should consider Accenture, while risk-tolerant profiles may watch C3.ai’s innovation play.
Which one offers the Superior Shareholder Reward?
I observe Accenture plc (ACN) delivers a consistent dividend yield around 2.2% with a sustainable payout ratio near 48%. Its free cash flow comfortably covers dividends and buybacks, which remain robust and support total shareholder returns. C3.ai, Inc. (AI) pays no dividends and reports persistent losses with negative margins and negative free cash flow. AI focuses on aggressive reinvestment in R&D and growth, but its lack of shareholder distributions and weak cash flows raise sustainability concerns. For 2026, I conclude Accenture offers the superior total return profile due to its balanced, reliable distributions and strong cash generation.
Comparative Score Analysis: The Strategic Profile
The radar chart reveals the fundamental DNA and trade-offs of Accenture plc and C3.ai, Inc., highlighting their financial strengths and valuation challenges:
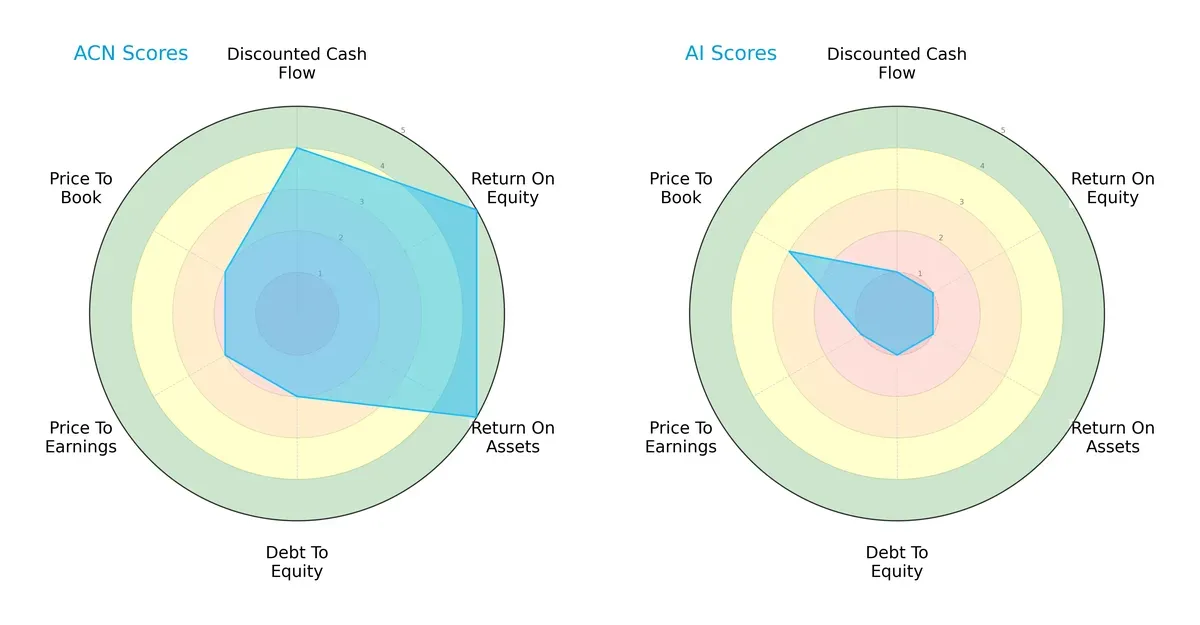
Accenture shows a balanced profile with strong ROE and ROA (both rated 5), indicating excellent profitability and asset efficiency. Its moderate debt-to-equity and valuation scores (both rated 2) suggest disciplined leverage but some premium pricing. Conversely, C3.ai scores very low (1) across DCF, ROE, ROA, debt-to-equity, and P/E metrics, signaling weak operational performance and financial risk. Its only relative strength is a moderate P/B score (3), implying some asset value support. Overall, Accenture dominates with a well-rounded financial profile, while C3.ai relies on a niche valuation edge.
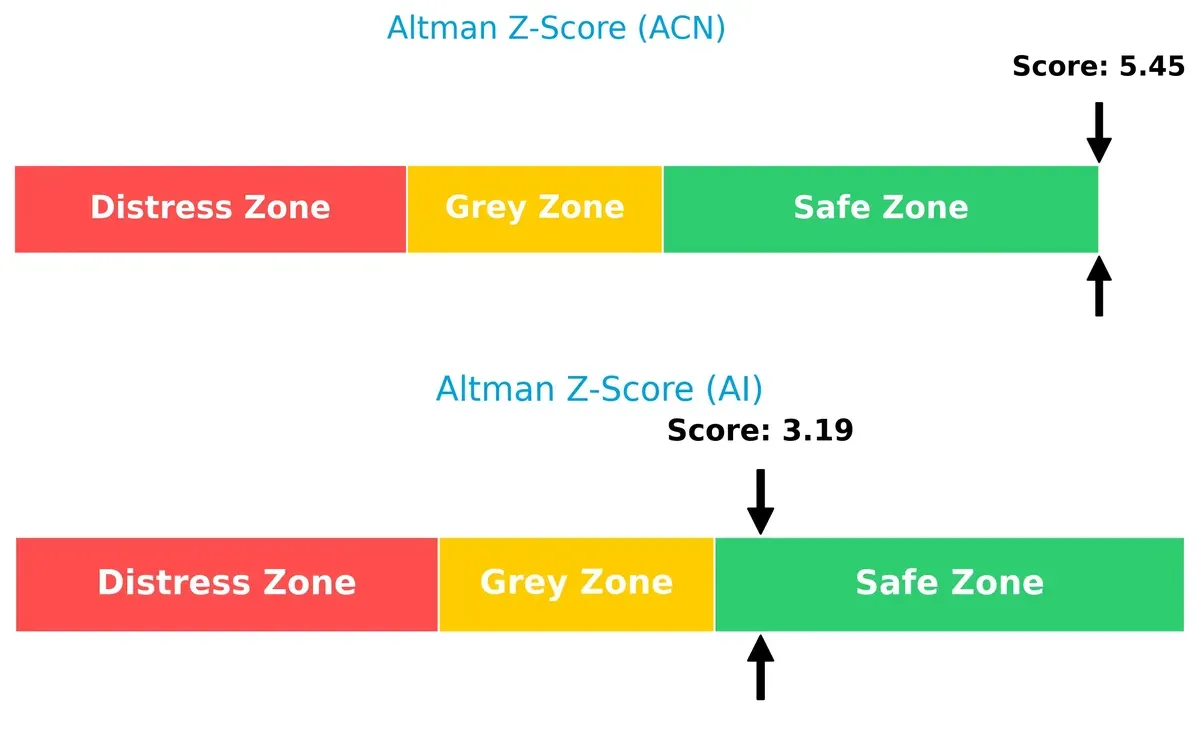
Bankruptcy Risk: Solvency Showdown
Accenture’s Altman Z-Score of 5.45 significantly exceeds C3.ai’s 3.19, placing both in the safe zone but confirming Accenture’s superior financial resilience in this cycle:
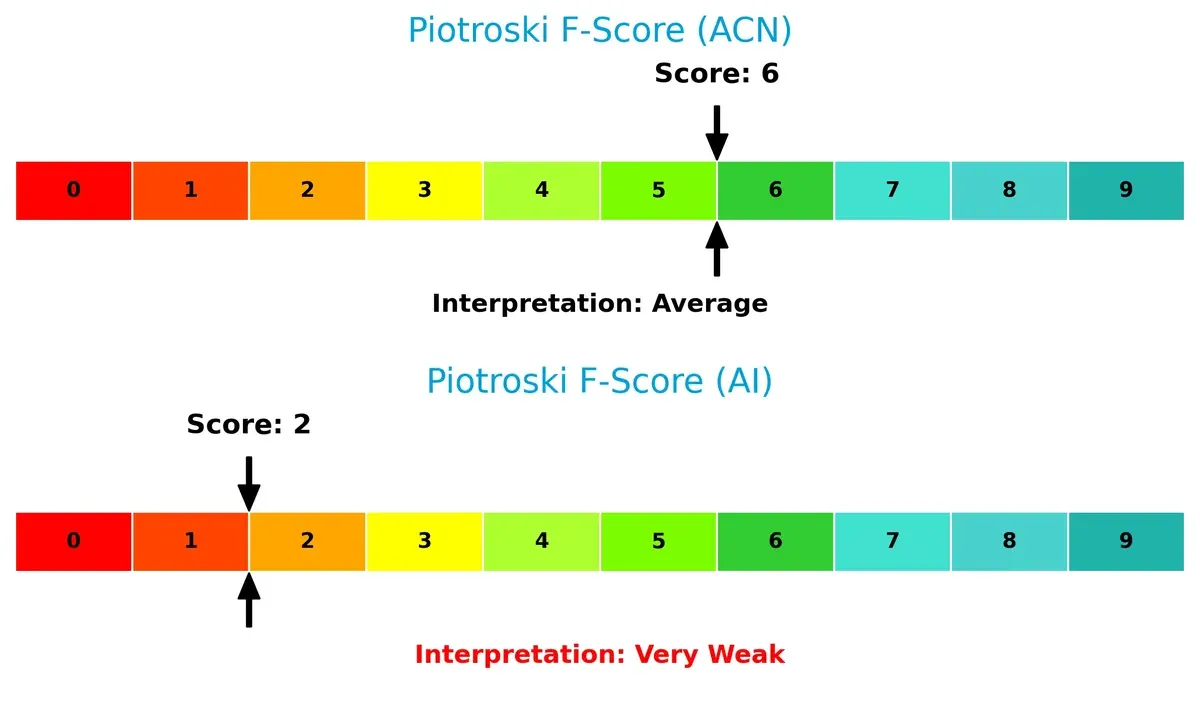
Financial Health: Quality of Operations
Accenture’s Piotroski F-Score of 6 signals solid financial health, while C3.ai’s score of 2 flags potential operational red flags and weaker fundamentals:
How are the two companies positioned?
This section dissects the operational DNA of Accenture and C3.ai by comparing their revenue distribution and internal dynamics. The goal is to confront their economic moats to identify which model offers the most resilient competitive advantage today.
Revenue Segmentation: The Strategic Mix
This visual comparison dissects how Accenture plc and C3.ai, Inc. diversify their income streams and where their primary sector bets lie:
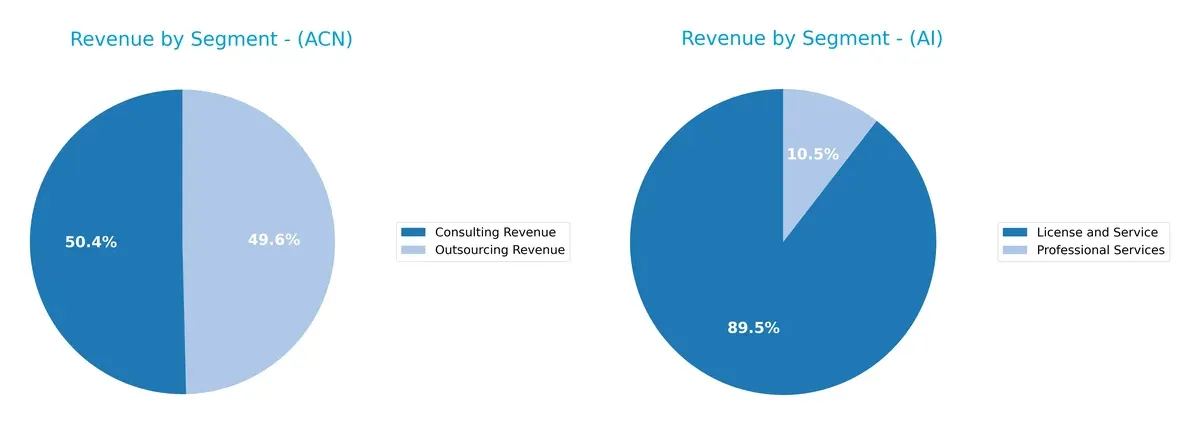
Accenture anchors its revenue in two massive streams: Consulting at $35B and Outsourcing at $34.6B, showcasing a balanced, dual-engine model. In contrast, C3.ai pivots heavily on License and Service at $278M, with Professional Services trailing at $32M, signaling concentration risk. Accenture’s diverse mega-segments foster ecosystem lock-in and infrastructure dominance, while C3.ai’s narrow base increases vulnerability to market shifts and client dependency.
Strengths and Weaknesses Comparison
This table compares the strengths and weaknesses of Accenture plc and C3.ai, Inc. based on diversification, profitability, financials, innovation, global presence, and market share:
Accenture plc Strengths
- Diverse revenue streams across consulting, outsourcing, and multiple industries
- Strong profitability with favorable net margin and ROE
- Solid financial health with low debt and high interest coverage
- Significant global presence in North America, Europe, and Growth Markets
- Leading market share in consulting and outsourcing sectors
C3.ai, Inc. Strengths
- Favorable quick ratio and low debt levels support liquidity and financial flexibility
- Innovation focus in AI and professional services
- Presence in North America, EMEA, and Asia Pacific markets
- Niche market position in AI licensing and services
Accenture plc Weaknesses
- Unfavorable price-to-book ratio may indicate overvaluation risk
- Neutral current ratio suggests moderate liquidity
- Limited growth exposure compared to emerging tech sectors
C3.ai, Inc. Weaknesses
- Negative profitability metrics with large net margin and ROIC losses
- Unfavorable WACC and interest coverage raise financing concerns
- Limited revenue scale and geographic diversification compared to peers
- No dividend yield limits income appeal
Accenture’s broad diversification and strong profitability underpin its market leadership and financial stability. C3.ai faces significant profitability and financial risks but leverages innovation and niche positioning to pursue growth opportunities.
The Moat Duel: Analyzing Competitive Defensibility
A structural moat is the only true shield protecting long-term profits from relentless competition and market disruption:
Accenture plc: Diversified Consulting & Technology Moat
Accenture’s moat rests on intangible assets and deep client relationships, reflected in a 7.6% ROIC premium over WACC. Its margin stability signals efficient capital use. Expansion in cloud and AI services in 2026 may deepen this advantage.
C3.ai, Inc.: Emerging AI Platform Moat
C3.ai relies on proprietary AI software platforms, a narrower moat than Accenture’s broad service portfolio. Despite 60% gross margins, negative EBIT and ROIC trends show weak capital efficiency. Growth in enterprise AI adoption could offer future opportunities but profitability remains elusive.
Moat Strength: Diversified Stability vs. Tech Disruption
Accenture’s wider moat combines scale, client stickiness, and diversified offerings, sustaining value creation despite some ROIC decline. C3.ai’s moat is narrower and currently value-destructive, risking market share unless profitability improves. Accenture stands better poised to defend its turf in 2026.
Which stock offers better returns?
The past year reveals contrasting trajectories: Accenture plc shows a significant overall decline with recent recovery, while C3.ai, Inc. faces persistent steep losses and decelerating decline.
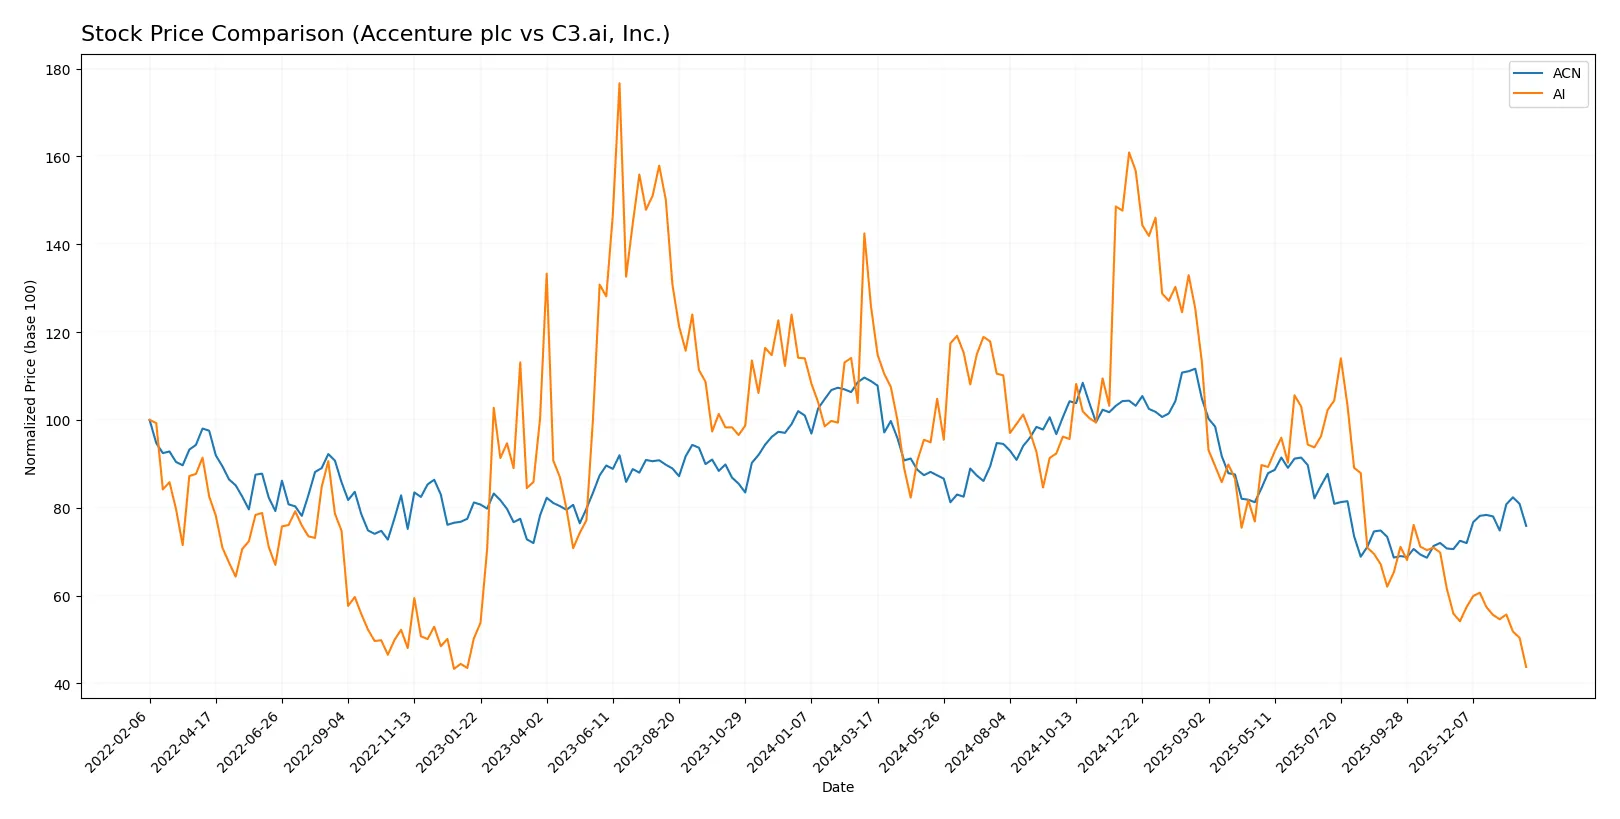
Trend Comparison
Accenture plc’s stock fell 30.29% over the past year, marking a bearish trend with accelerating decline. It reached a high of 388.0 and a low of 238.39, but recent weeks show a 7.52% rebound.
C3.ai, Inc. declined 65.27% over the same period, confirming a bearish trend with decelerating loss. Its price ranged between 40.52 and 11.01, with recent months showing further 21.75% drop.
Comparing both, Accenture’s stock has outperformed C3.ai by a wide margin, displaying less severe losses and a recent upward trend.
Target Prices
Analysts present a cautiously optimistic consensus on Accenture plc and C3.ai, Inc. target prices.
| Company | Target Low | Target High | Consensus |
|---|---|---|---|
| Accenture plc | 265 | 330 | 303 |
| C3.ai, Inc. | 10 | 16 | 12.33 |
Accenture’s consensus target of 303 exceeds its current 264 price, signaling moderate upside potential. C3.ai’s consensus at 12.33 slightly exceeds its current 11, reflecting cautious optimism amid volatility.

Don’t Let Luck Decide Your Entry Point
Optimize your entry points with our advanced ProRealTime indicators. You’ll get efficient buy signals with precise price targets for maximum performance. Start outperforming now!
How do institutions grade them?
Accenture plc Grades
The following table summarizes recent grades from reputable financial institutions for Accenture plc:
| Grading Company | Action | New Grade | Date |
|---|---|---|---|
| Wells Fargo | Maintain | Equal Weight | 2026-01-14 |
| UBS | Maintain | Buy | 2025-12-19 |
| Susquehanna | Maintain | Neutral | 2025-12-19 |
| RBC Capital | Maintain | Outperform | 2025-12-19 |
| Morgan Stanley | Upgrade | Overweight | 2025-12-16 |
| Mizuho | Maintain | Outperform | 2025-09-29 |
| Evercore ISI Group | Maintain | Outperform | 2025-09-26 |
| BMO Capital | Maintain | Market Perform | 2025-09-26 |
| TD Cowen | Maintain | Buy | 2025-09-26 |
| Goldman Sachs | Maintain | Buy | 2025-09-26 |
C3.ai, Inc. Grades
The following table summarizes recent grades from reputable financial institutions for C3.ai, Inc.:
| Grading Company | Action | New Grade | Date |
|---|---|---|---|
| Wedbush | Maintain | Outperform | 2025-12-04 |
| DA Davidson | Maintain | Underperform | 2025-12-04 |
| Canaccord Genuity | Maintain | Hold | 2025-12-04 |
| Needham | Maintain | Hold | 2025-12-04 |
| UBS | Maintain | Neutral | 2025-09-12 |
| Morgan Stanley | Maintain | Underweight | 2025-09-09 |
| Canaccord Genuity | Maintain | Hold | 2025-09-05 |
| Keybanc | Maintain | Underweight | 2025-09-04 |
| UBS | Maintain | Neutral | 2025-09-04 |
| Needham | Maintain | Hold | 2025-09-04 |
Which company has the best grades?
Accenture plc consistently receives higher grades, including multiple “Buy” and “Outperform” ratings, and even an “Overweight” upgrade. C3.ai, Inc. shows more cautious sentiment with mostly “Hold,” “Neutral,” and “Underperform” grades. Investors may interpret Accenture’s stronger grades as a sign of greater confidence from institutions.
Risks specific to each company
The following categories identify critical pressure points and systemic threats facing Accenture plc and C3.ai, Inc. in the 2026 market environment:
1. Market & Competition
Accenture plc
- Dominates the IT services market with diversified offerings and strong client base.
C3.ai, Inc.
- Faces intense competition in AI software with limited scale and high exposure to tech disruption.
2. Capital Structure & Debt
Accenture plc
- Maintains a conservative debt-to-equity ratio of 0.26, signaling financial stability.
C3.ai, Inc.
- Extremely low debt levels (0.01) but interest coverage is zero, indicating no earnings to cover interest.
3. Stock Volatility
Accenture plc
- Beta of 1.25 suggests moderate volatility relative to the market.
C3.ai, Inc.
- High beta of 1.96 reflects elevated stock volatility and investor uncertainty.
4. Regulatory & Legal
Accenture plc
- Operates globally with exposure to data protection and consulting compliance risks.
C3.ai, Inc.
- Faces regulatory scrutiny in AI ethics and data privacy, increasing compliance costs.
5. Supply Chain & Operations
Accenture plc
- Benefits from robust global operational infrastructure and diversified supply chain.
C3.ai, Inc.
- Relies heavily on partnerships and cloud providers, creating dependency risks.
6. ESG & Climate Transition
Accenture plc
- Strong sustainability initiatives embedded in services and operations.
C3.ai, Inc.
- ESG efforts less mature, with potential reputational risks in energy-intensive AI operations.
7. Geopolitical Exposure
Accenture plc
- Global footprint exposes it to geopolitical tensions but with risk-mitigation strategies.
C3.ai, Inc.
- Concentrated US exposure heightens vulnerability to domestic policy shifts.
Which company shows a better risk-adjusted profile?
Accenture’s most impactful risk lies in geopolitical exposure due to its global reach. C3.ai’s chief risk is financial instability from negative margins and zero interest coverage. Accenture’s favorable Altman Z-score (5.45) and solid profitability make it distinctly less risky. C3.ai’s high volatility and weak Piotroski score (2) underscore its precarious financial footing, signaling a riskier investment. Recent data reveal Accenture’s stable capital structure contrasts sharply with C3.ai’s inability to cover interest expenses, justifying caution on the latter.
Final Verdict: Which stock to choose?
Accenture’s superpower lies in its consistent ability to generate strong returns on invested capital well above its cost of capital. It operates as a cash machine with robust profitability and a resilient business model. A point of vigilance is its slightly declining ROIC trend, which calls for monitoring. It suits a portfolio focused on steady, long-term growth and income.
C3.ai’s strategic moat centers on its niche in AI-driven software with high gross margins and rapid revenue growth. However, it currently struggles with profitability and value destruction, reflecting its early-stage, high-risk profile. Compared to Accenture, it offers less financial safety but could fit an aggressive growth or speculative segment willing to tolerate volatility.
If you prioritize reliable value creation and income stability, Accenture outshines with its proven capital efficiency and favorable financial health. However, if you seek high-growth potential and can accept significant risk, C3.ai offers superior exposure to transformative AI trends despite its current financial challenges. Both scenarios require careful risk management aligned with your investment horizon.
Disclaimer: Investment carries a risk of loss of initial capital. The past performance is not a reliable indicator of future results. Be sure to understand risks before making an investment decision.
Go Further
I encourage you to read the complete analyses of Accenture plc and C3.ai, Inc. to enhance your investment decisions: