Home > Comparison > Technology > ACN vs G
The strategic rivalry between Accenture plc and Genpact Limited defines the current trajectory of the Technology sector. Accenture operates as a global professional services powerhouse with a broad portfolio spanning consulting, technology, and operations. Genpact, by contrast, focuses on business process outsourcing and IT services with a strong presence in financial and operational domains. This analysis aims to identify which company’s operational model offers a superior risk-adjusted return for a diversified portfolio.

Table of contents
Companies Overview
Accenture and Genpact stand as pivotal players in the global Information Technology Services sector, influencing digital transformation and outsourcing markets.
Accenture plc: Global Digital Transformation Leader
Accenture dominates as a professional services powerhouse, generating revenue through strategy, consulting, and technology integration. Its competitive advantage lies in agile transformation, intelligent automation, and cloud services. In 2026, Accenture sharpens its focus on advanced AI, cybersecurity, and sustainable digital innovation to maintain industry leadership.
Genpact Limited: Specialist in Business Process Outsourcing
Genpact excels in business process outsourcing and IT services across multiple industries including banking and healthcare. Its core revenue stems from finance, supply chain, and transformation services. In 2026, Genpact emphasizes ESG solutions, digital analytics, and finance advisory to deepen client engagement and operational efficiency.
Strategic Collision: Similarities & Divergences
Both firms prioritize digital services but diverge in business philosophy: Accenture offers a broad technology ecosystem while Genpact zeroes in on process outsourcing and niche consulting. Their primary battleground is enterprise digital transformation, where Accenture leads in scale and innovation, and Genpact focuses on specialized operational excellence. These distinctions shape contrasting investment profiles: Accenture as a diversified tech leader, Genpact as a focused outsourcing specialist.
Income Statement Comparison
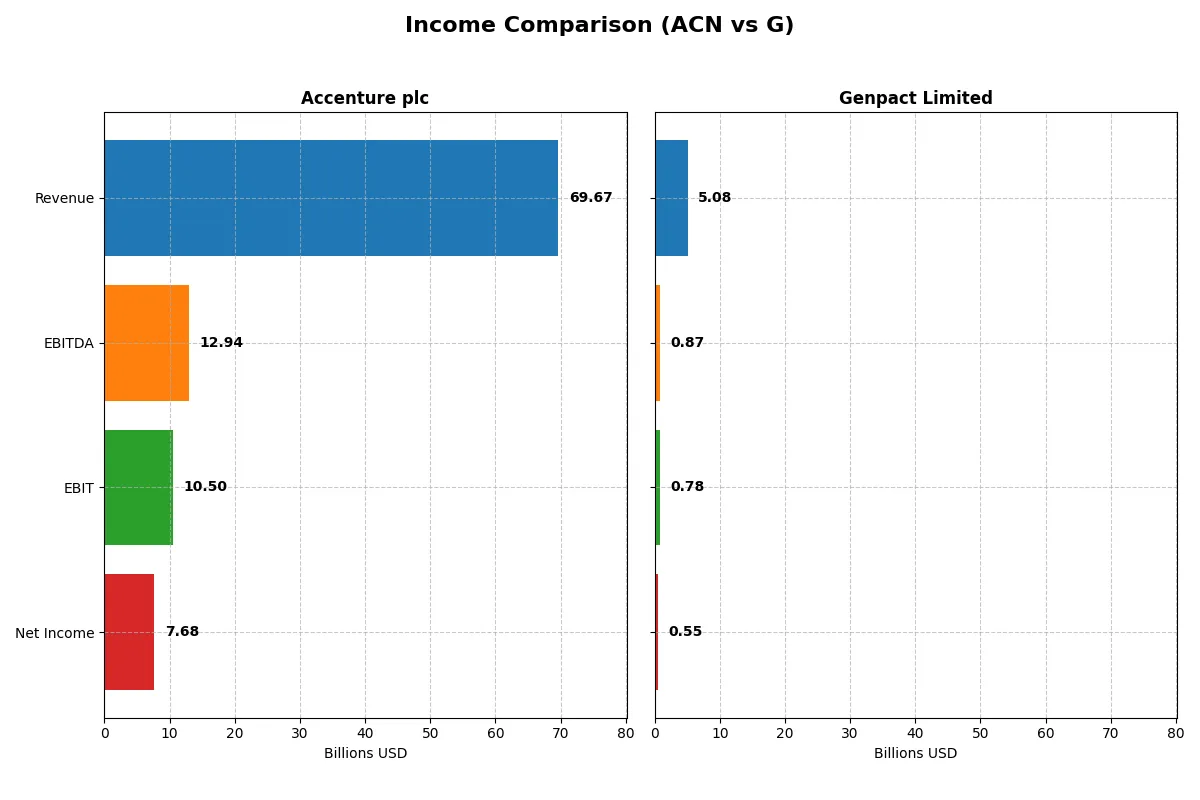
This data dissects the core profitability and scalability of both corporate engines to reveal who dominates the bottom line:
| Metric | Accenture plc (ACN) | Genpact Limited (G) |
|---|---|---|
| Revenue | 69.7B | 5.1B |
| Cost of Revenue | 47.4B | 3.2B |
| Operating Expenses | 12.0B | 1.0B |
| Gross Profit | 22.2B | 1.8B |
| EBITDA | 12.9B | 875M |
| EBIT | 10.5B | 780M |
| Interest Expense | 229M | 50M |
| Net Income | 7.7B | 552M |
| EPS | 12.29 | 3.18 |
| Fiscal Year | 2025 | 2025 |
Income Statement Analysis: The Bottom-Line Duel
This income statement comparison exposes which company converts revenue into profit most efficiently, revealing the strength of their business engines.
Accenture plc Analysis
Accenture’s revenue climbed steadily from $50.5B in 2021 to $69.7B in 2025, reflecting a 38% growth over five years. Net income rose nearly 30% to $7.7B by 2025. Gross margin remains robust near 32%, supporting a healthy net margin around 11%. The latest year shows solid momentum with operating expenses well-controlled and EBIT growing 7.6%, signaling operational efficiency.
Genpact Limited Analysis
Genpact increased revenue from $4.0B in 2021 to $5.1B in 2025, a 26% gain over the period. Net income surged 50% to $552M, showing strong bottom-line leverage. Gross margin improved to 36%, slightly outpacing Accenture, while net margin holds near 11%. The latest year’s moderate EBIT growth of 3.1% and EPS rise of nearly 10% indicate steady profitability expansion.
Margin Strength vs. Growth Scale
Accenture outpaces Genpact in absolute revenue and net income scale, delivering consistent margin quality and stronger EBIT growth. Genpact boasts higher margin percentages and faster net income growth but from a smaller base. For investors, Accenture’s scale and efficiency suit those favoring stability, while Genpact appeals to those seeking sharper margin expansion and earnings momentum.
Financial Ratios Comparison
These vital ratios act as a diagnostic tool to expose the underlying fiscal health, valuation premiums, and capital efficiency of the companies compared below:
| Ratios | Accenture plc (ACN) | Genpact Limited (G) |
|---|---|---|
| ROE | 24.6% | 21.7% |
| ROIC | 17.0% | 12.3% |
| P/E | 21.2 | 14.7 |
| P/B | 5.21 | 3.19 |
| Current Ratio | 1.42 | 1.66 |
| Quick Ratio | 1.42 | 1.66 |
| D/E (Debt-to-Equity) | 0.26 | 0.23 |
| Debt-to-Assets | 12.5% | 9.9% |
| Interest Coverage | 44.7 | 15.3 |
| Asset Turnover | 1.07 | 0.87 |
| Fixed Asset Turnover | 16.2 | 13.6 |
| Payout Ratio | 48.2% | 21.3% |
| Dividend Yield | 2.28% | 1.45% |
| Fiscal Year | 2025 | 2025 |
Efficiency & Valuation Duel: The Vital Signs
Ratios act like a company’s DNA, revealing hidden risks and operational strengths that define its market standing and shareholder value.
Accenture plc
Accenture delivers strong profitability with a 24.6% ROE and an 11.0% net margin, signaling operational excellence. Its P/E of 21.2 is neutral, suggesting fair valuation amid robust returns. The stock offers a solid 2.3% dividend yield, reflecting balanced capital allocation between rewarding shareholders and reinvesting in growth.
Genpact Limited
Genpact posts a decent 21.7% ROE and a 10.9% net margin, showing efficient operations at a leaner scale. With a P/E of 14.7, the stock appears attractively valued. Dividend yield stands modest at 1.5%, indicating some shareholder return alongside focused reinvestment to sustain its favorable 12.3% ROIC.
Balanced Profitability vs. Value Appeal
Accenture excels in profitability and shareholder returns but trades at a higher multiple. Genpact offers a more attractive valuation with slightly lower returns. Investors seeking operational strength may lean toward Accenture, while value-focused investors might prefer Genpact’s favorable price metrics.
Which one offers the Superior Shareholder Reward?
I observe Accenture plc (ACN) delivers a 2.28% dividend yield with a 48% payout ratio, backed by strong free cash flow coverage (2.67x). Its buybacks are aggressive, enhancing total returns sustainably. Genpact Limited (G) yields 1.45% with a 21% payout ratio, reflecting a conservative distribution and modest buybacks. Genpact’s lower payout supports reinvestment, but weaker free cash flow coverage (4.15x dividend+capex) and higher debt raise concerns. Historically in consulting, consistent dividends plus robust buybacks like ACN’s generate superior shareholder rewards. I conclude ACN offers a more attractive and sustainable total return profile in 2026.
Comparative Score Analysis: The Strategic Profile
The radar chart reveals the fundamental DNA and trade-offs of Accenture plc and Genpact Limited, highlighting their strategic financial strengths and vulnerabilities:
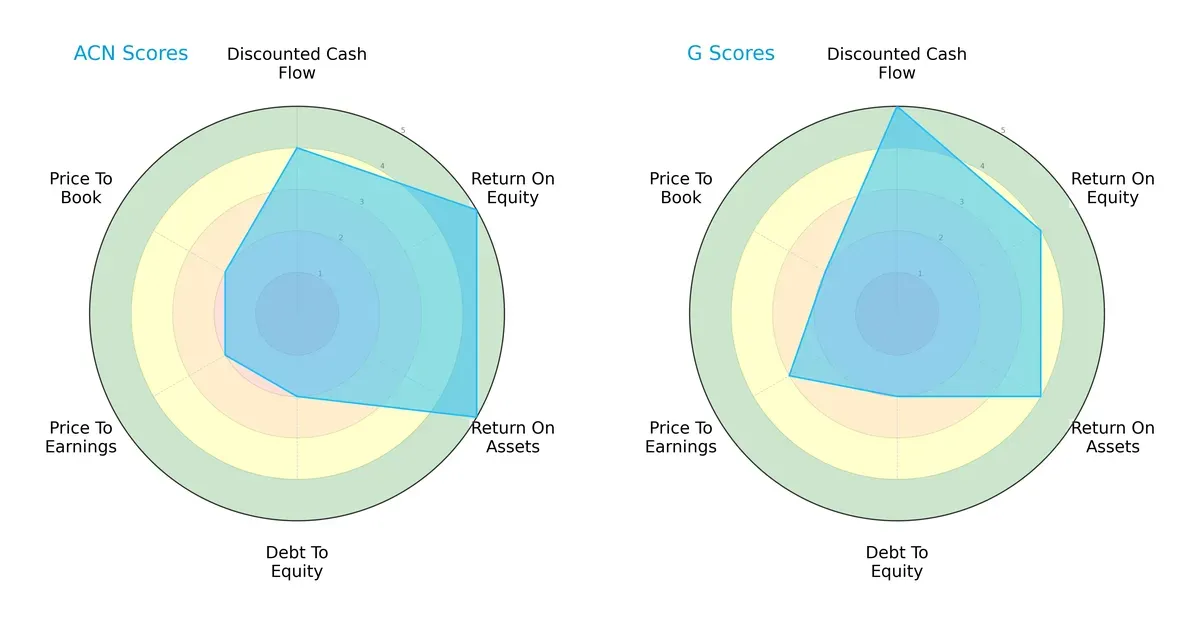
Accenture excels in return on equity (5) and assets (5), reflecting superior operational efficiency. Genpact leads in discounted cash flow (5) and holds a moderate valuation edge with a better P/E score (3). Both share weak debt-to-equity scores (2), signaling balance sheet leverage concerns. Accenture’s profile is more skewed towards profitability metrics, while Genpact shows a slightly more balanced valuation and cash flow stance.
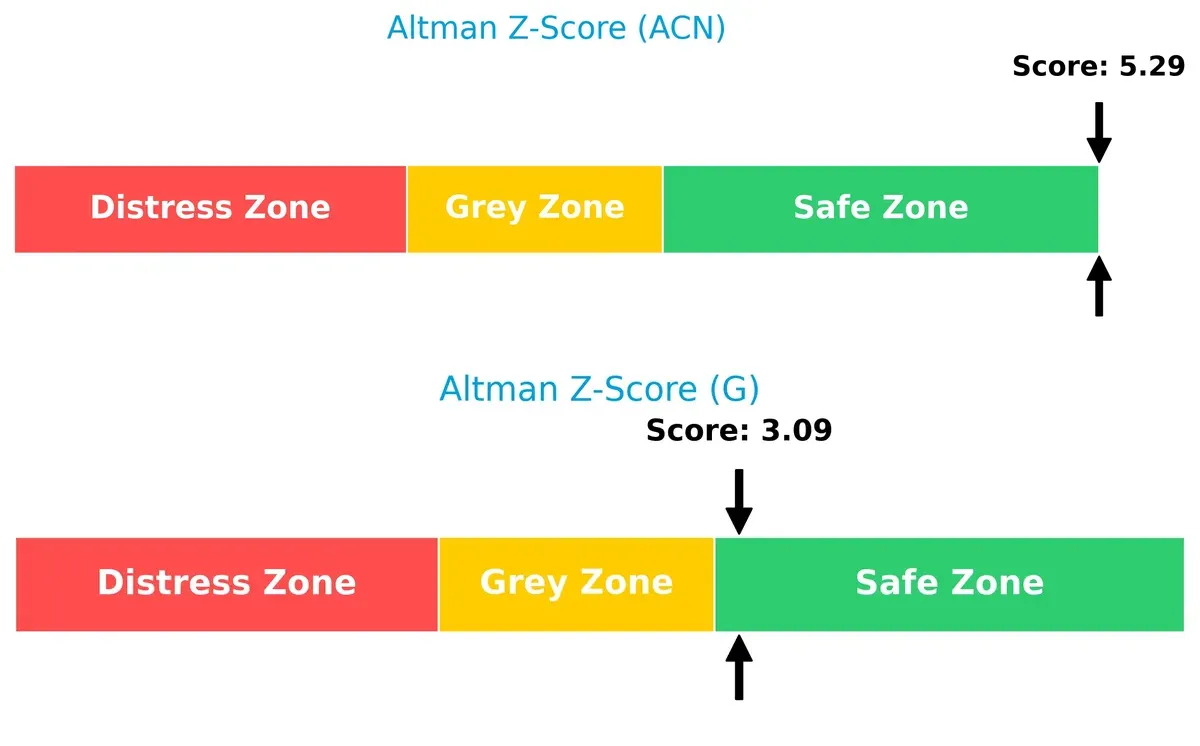
Bankruptcy Risk: Solvency Showdown
Accenture’s Altman Z-Score (5.29) surpasses Genpact’s (3.09), both securely in the safe zone. This gap underscores Accenture’s stronger buffer against financial distress in volatile cycles:
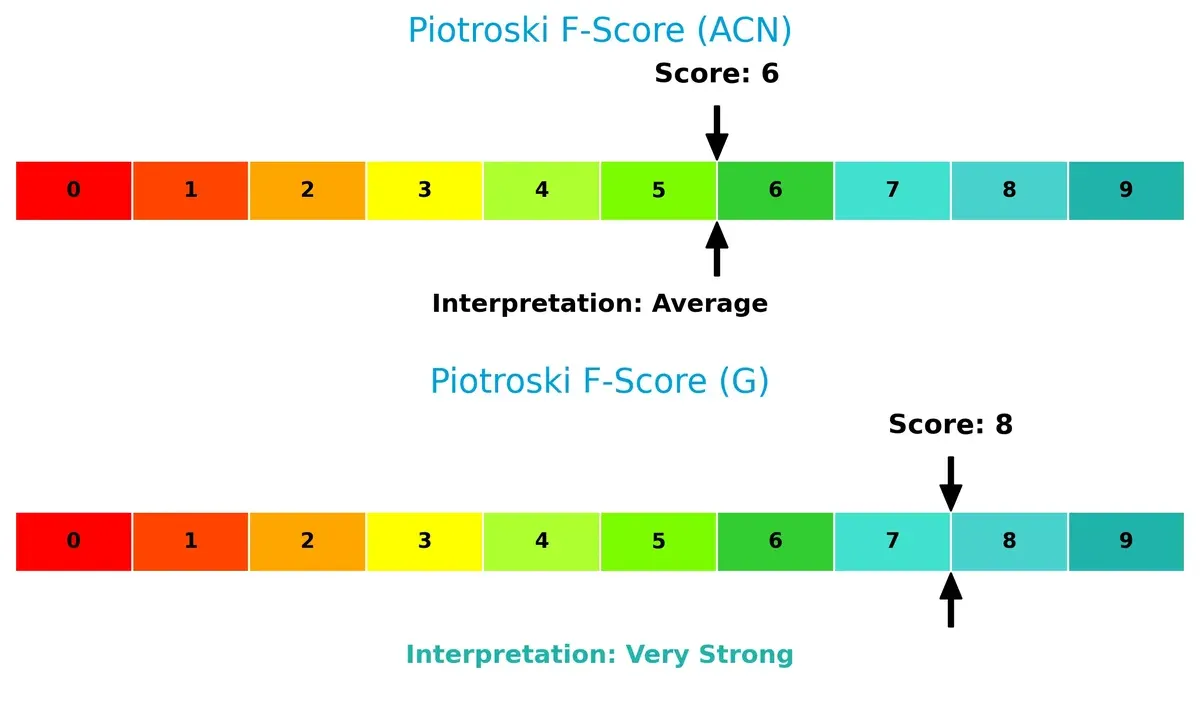
Financial Health: Quality of Operations
Genpact’s Piotroski F-Score of 8 indicates robust financial health, outperforming Accenture’s average score of 6. This suggests Genpact maintains stronger internal metrics and fewer red flags:
How are the two companies positioned?
This section dissects ACN and G’s operational DNA by comparing their revenue distribution and internal strengths and weaknesses. The goal is to confront their economic moats to reveal which model delivers the most resilient competitive advantage in today’s market.
Revenue Segmentation: The Strategic Mix
This comparison dissects how Accenture plc and Genpact Limited diversify their income streams and highlights their primary sector bets:
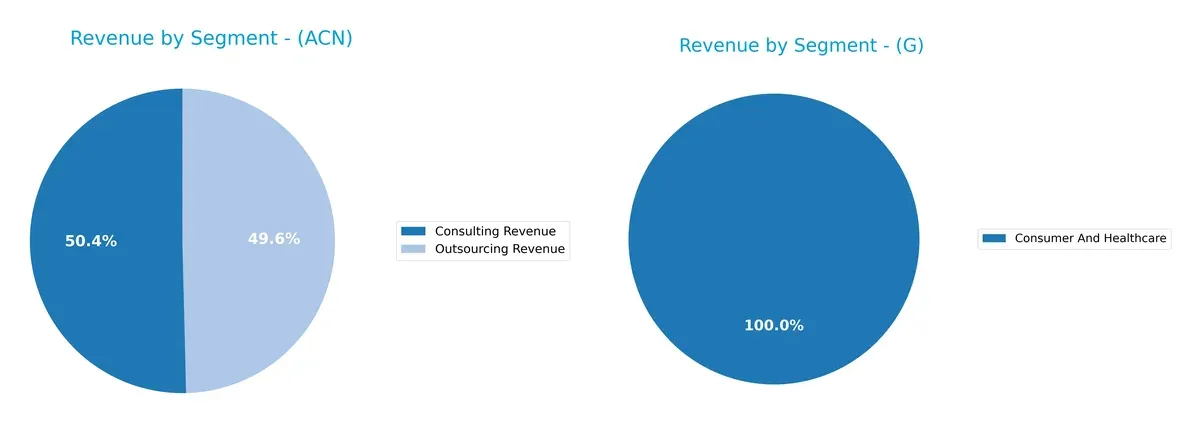
Accenture pivots on two massive segments: Consulting at $35.1B and Outsourcing near $34.6B, reflecting a balanced dual-engine model. Genpact, in contrast, relies heavily on Consumer and Healthcare at $1.7B, showing less diversification. Accenture’s wide sector coverage anchors its ecosystem lock-in and infrastructure dominance. Genpact’s concentration in a niche exposes it to sector-specific risks but allows focused specialization.
Strengths and Weaknesses Comparison
This table compares the strengths and weaknesses of Accenture plc and Genpact Limited:
Accenture plc Strengths
- Highly diversified across consulting, outsourcing, and product segments
- Strong global presence with major revenue from North America and Europe
- Superior profitability metrics including ROE (24.6%) and ROIC (17.0%)
- Favorable leverage with low debt-to-assets (12.5%) and high interest coverage (45.9)
Genpact Limited Strengths
- Focused business model in business process outsourcing and IT services
- Very favorable cost of capital with WACC at 7.2%
- Strong profitability with ROE (21.7%) and solid net margin (10.9%)
- Higher liquidity ratios (current and quick at 1.66) than peer
- Very favorable overall financial ratios (78.6% favorable)
Accenture plc Weaknesses
- Less favorable price-to-book ratio (5.21) indicates premium valuation
- Moderate current ratio (1.42) may limit short-term flexibility
- Limited disclosure on innovation and market share specifics
Genpact Limited Weaknesses
- Less diversified geographically with strong concentration in India
- Asset turnover below peer (0.87 vs 1.07) may indicate lower efficiency
- Dividend yield (1.45%) is neutral, less attractive for income investors
Both companies show solid profitability and financial health. Accenture’s diversification and global scale contrast with Genpact’s focused model and cost efficiency. Each faces distinct valuation and operational trade-offs impacting their strategic positioning.
The Moat Duel: Analyzing Competitive Defensibility
A structural moat is the only true shield protecting long-term profits from relentless competition erosion. Let’s dissect the defenses of two industry players:
Accenture plc: Diversified Expertise and Scale Moat
Accenture’s moat stems from its broad consulting expertise and global scale, delivering stable 15% EBIT margins. Its declining ROIC trend signals margin pressure but new digital services may reinforce resilience in 2026.
Genpact Limited: Process Excellence and Growth Moat
Genpact leverages process specialization and evolving digital capabilities, maintaining a slightly higher EBIT margin than Accenture. Its rising ROIC trend and strong margin growth position it well for expansion in emerging markets.
Verdict: Scale and Expertise vs. Process Innovation
Accenture holds a wider moat with vast scale and diversified service lines, but its eroding ROIC warns of margin challenges. Genpact’s sharper ROIC improvement gives it a deeper moat trajectory. I see Genpact better equipped to sustain and grow market share in 2026.
Which stock offers better returns?
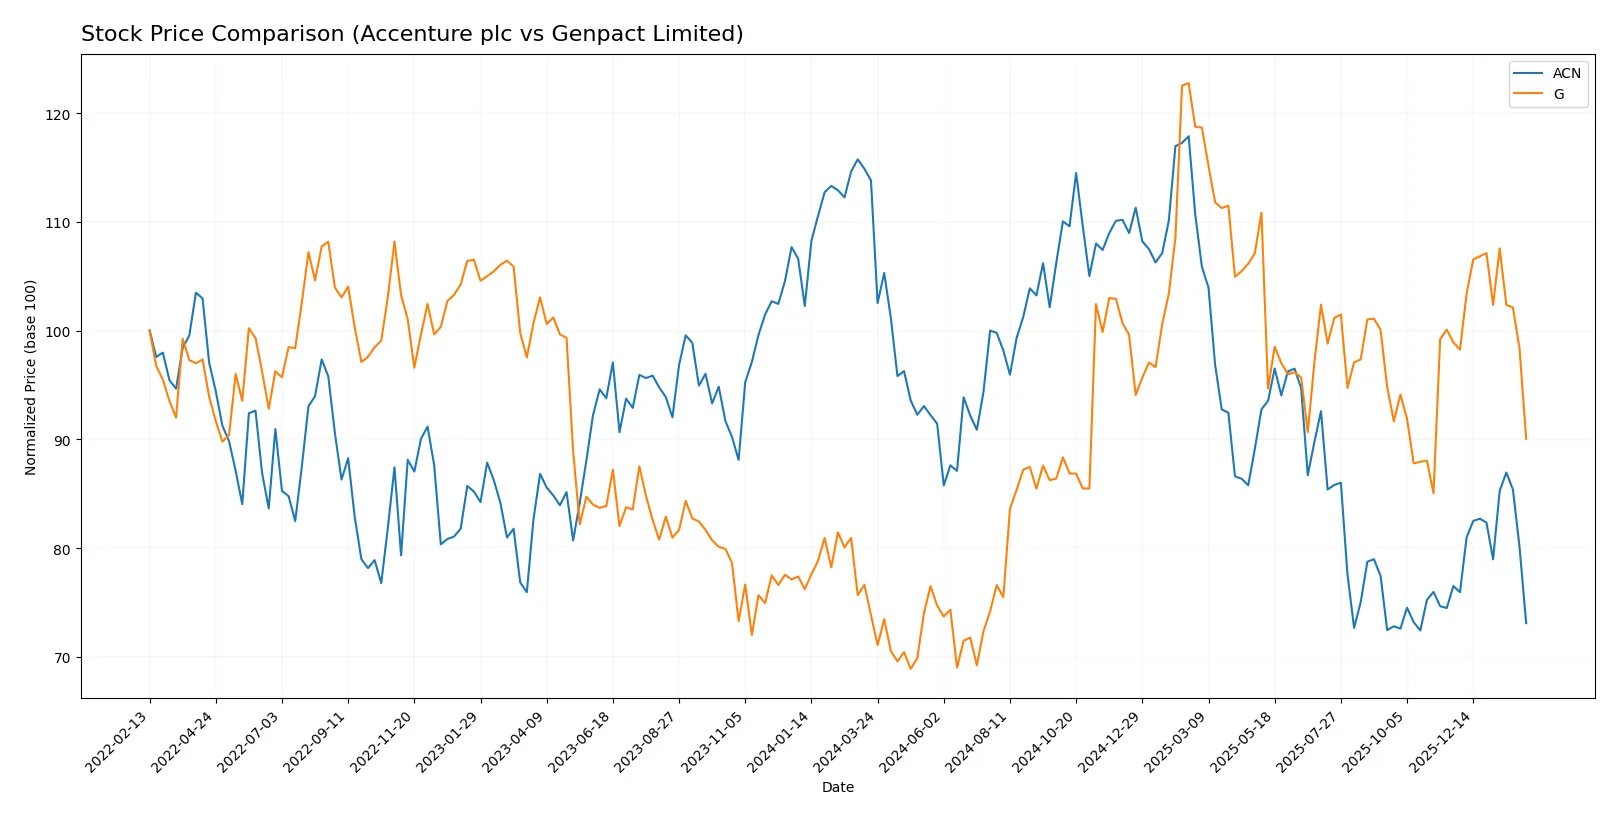
The past year shows contrasting price dynamics: Accenture’s stock fell sharply, while Genpact posted a solid gain with slowing momentum in recent months.
Trend Comparison
Accenture’s stock declined 35.77% over the past year, marking a bearish trend with accelerating losses and high volatility. It hit a high of 388.0 and a low of 238.39.
Genpact’s stock rose 21.95%, reflecting a bullish trend with decelerating growth and low volatility. It reached a high of 55.05 and a low of 30.9 during this period.
Genpact outperformed Accenture significantly, delivering positive market returns versus Accenture’s substantial decline over the last 12 months.
Target Prices
Analysts present a confident upward target consensus for both Accenture plc and Genpact Limited.
| Company | Target Low | Target High | Consensus |
|---|---|---|---|
| Accenture plc | 265 | 330 | 302.93 |
| Genpact Limited | 42 | 50 | 46 |
Accenture’s target consensus at $303 significantly exceeds its current price of $241, signaling strong growth expectations. Genpact’s consensus of $46 also comfortably surpasses its $40 current price, indicating moderate upside potential.

Don’t Let Luck Decide Your Entry Point
Optimize your entry points with our advanced ProRealTime indicators. You’ll get efficient buy signals with precise price targets for maximum performance. Start outperforming now!
How do institutions grade them?
Accenture plc Grades
The following table summarizes recent institutional grades for Accenture plc:
| Grading Company | Action | New Grade | Date |
|---|---|---|---|
| Wells Fargo | Maintain | Equal Weight | 2026-01-14 |
| UBS | Maintain | Buy | 2025-12-19 |
| RBC Capital | Maintain | Outperform | 2025-12-19 |
| Susquehanna | Maintain | Neutral | 2025-12-19 |
| Morgan Stanley | Upgrade | Overweight | 2025-12-16 |
| Mizuho | Maintain | Outperform | 2025-09-29 |
| Goldman Sachs | Maintain | Buy | 2025-09-26 |
| BMO Capital | Maintain | Market Perform | 2025-09-26 |
| Evercore ISI Group | Maintain | Outperform | 2025-09-26 |
| TD Cowen | Maintain | Buy | 2025-09-26 |
Genpact Limited Grades
The following table summarizes recent institutional grades for Genpact Limited:
| Grading Company | Action | New Grade | Date |
|---|---|---|---|
| Needham | Maintain | Buy | 2026-02-06 |
| JP Morgan | Maintain | Neutral | 2025-08-20 |
| Needham | Maintain | Buy | 2025-08-08 |
| Mizuho | Maintain | Neutral | 2025-07-01 |
| Needham | Maintain | Buy | 2025-06-30 |
| TD Cowen | Maintain | Buy | 2025-06-27 |
| Needham | Maintain | Buy | 2025-05-08 |
| Baird | Maintain | Neutral | 2025-05-08 |
| Mizuho | Maintain | Neutral | 2025-02-10 |
| Needham | Maintain | Buy | 2025-02-07 |
Which company has the best grades?
Accenture exhibits a broader range of grades, including multiple “Outperform” and an “Overweight” upgrade, indicating stronger institutional confidence. Genpact’s grades cluster around “Buy” and “Neutral,” reflecting steadier but less bullish sentiment. This divergence may influence investor perception of growth potential and risk.
Risks specific to each company
The following categories identify the critical pressure points and systemic threats facing both firms in the 2026 market environment:
1. Market & Competition
Accenture plc
- Operates globally in IT services with strong brand and diversified offerings, facing intense competition from tech giants and consulting firms.
Genpact Limited
- Focuses on business process outsourcing with niche expertise but competes heavily with larger global IT and consulting firms.
2. Capital Structure & Debt
Accenture plc
- Maintains low debt-to-equity ratio (0.26) and strong interest coverage (46x), indicating solid financial stability.
Genpact Limited
- Also has low debt-to-equity (0.23) but lower interest coverage (16x), slightly higher financial risk in downturns.
3. Stock Volatility
Accenture plc
- Beta at 1.24 suggests higher sensitivity to market swings, implying more volatility than the market average.
Genpact Limited
- Beta at 0.74 indicates lower volatility and more defensive stock behavior versus the market.
4. Regulatory & Legal
Accenture plc
- Faces complex regulatory environments globally, including data privacy and cybersecurity regulations.
Genpact Limited
- Exposed to regulatory risks primarily in outsourcing jurisdictions with evolving labor and data laws.
5. Supply Chain & Operations
Accenture plc
- Diverse global operations with strong technology infrastructure but exposed to geopolitical supply chain disruptions.
Genpact Limited
- Relies heavily on offshore delivery centers, vulnerable to operational disruptions and outsourcing policy changes.
6. ESG & Climate Transition
Accenture plc
- Leading in sustainability consulting, with growing emphasis on ESG services enhancing competitive moat.
Genpact Limited
- Provides ESG advisory but lags slightly in integrating climate transition strategies across operations.
7. Geopolitical Exposure
Accenture plc
- Global footprint subjects it to risks from trade tensions, sanctions, and geopolitical instability.
Genpact Limited
- Concentrated offshore presence exposes it to risks from regional political shifts and regulatory changes.
Which company shows a better risk-adjusted profile?
Accenture’s most impactful risk lies in market competition and stock volatility, given its size and beta above 1. Genpact’s primary risk is supply chain and geopolitical exposure due to offshore concentration. Despite higher volatility, Accenture’s robust capital structure and ESG leadership give it a stronger risk-adjusted profile. Genpact’s superior Piotroski score (8 vs. 6) shows financial strength but its operational concentration raises caution. Accenture’s Altman Z-score above 5 confirms its safe zone status, underscoring resilience amid competitive pressures.
Final Verdict: Which stock to choose?
Accenture’s superpower is its unmatched operational efficiency and strong capital allocation, consistently creating value above its cost of capital. Its main point of vigilance lies in a slightly declining ROIC trend, signaling the need to monitor profitability erosion. It fits well in an aggressive growth portfolio seeking industry leaders.
Genpact’s strategic moat stems from its growing ROIC and sustainable competitive advantage, reflected in improving profitability and a robust balance sheet. It offers a safer profile compared to Accenture, with a lower valuation multiple and stronger recent earnings growth. It suits a GARP (Growth at a Reasonable Price) portfolio focused on stable expansion.
If you prioritize operational excellence and industry dominance, Accenture is the compelling choice due to its scale and efficiency. However, if you seek improving profitability with better stability and valuation appeal, Genpact offers a very favorable moat and growth trajectory. Each stock serves distinct investor profiles amid evolving market conditions.
Disclaimer: Investment carries a risk of loss of initial capital. The past performance is not a reliable indicator of future results. Be sure to understand risks before making an investment decision.
Go Further
I encourage you to read the complete analyses of Accenture plc and Genpact Limited to enhance your investment decisions: