Home > Comparison > Healthcare > ABBV vs PFE
The strategic rivalry between AbbVie Inc. and Pfizer Inc. shapes the global healthcare landscape. AbbVie operates as a specialty pharmaceutical innovator with a strong focus on immunology and oncology. Pfizer, a diversified biopharmaceutical giant, spans vaccines, biologics, and sterile injectables. This clash highlights a contest between focused innovation and broad therapeutic reach. This analysis aims to identify which company presents a superior risk-adjusted profile for diversified portfolios in the evolving healthcare sector.
Table of contents
Companies Overview
AbbVie and Pfizer stand as titans in global pharmaceuticals, shaping healthcare with innovative therapies.
AbbVie Inc.: Specialty Pharma Powerhouse
AbbVie leads as a specialty pharmaceutical company focused on autoimmune, oncology, and neuroscience treatments. Its core revenue derives from flagship drugs like HUMIRA and SKYRIZI, targeting chronic conditions. In 2026, AbbVie emphasizes expanding its immunology portfolio while leveraging R&D collaborations to sustain its competitive edge.
Pfizer Inc.: Diversified Biopharma Giant
Pfizer operates as a broad-spectrum biopharmaceutical firm with a diversified product lineup spanning vaccines, oncology, and rare diseases. It generates revenue through innovative medicines and mass-market vaccines, including its COVID-19 portfolio. Pfizer’s 2026 strategy highlights advancing its pipeline across multiple therapeutic areas while strengthening global manufacturing capabilities.
Strategic Collision: Similarities & Divergences
Both companies share a commitment to innovative drug development but diverge in focus: AbbVie pursues specialty niches, while Pfizer opts for broad therapeutic reach. They primarily clash in immunology and oncology markets. AbbVie’s concentrated portfolio offers depth; Pfizer’s scale delivers resilience—each presents distinct risk and growth profiles for investors.
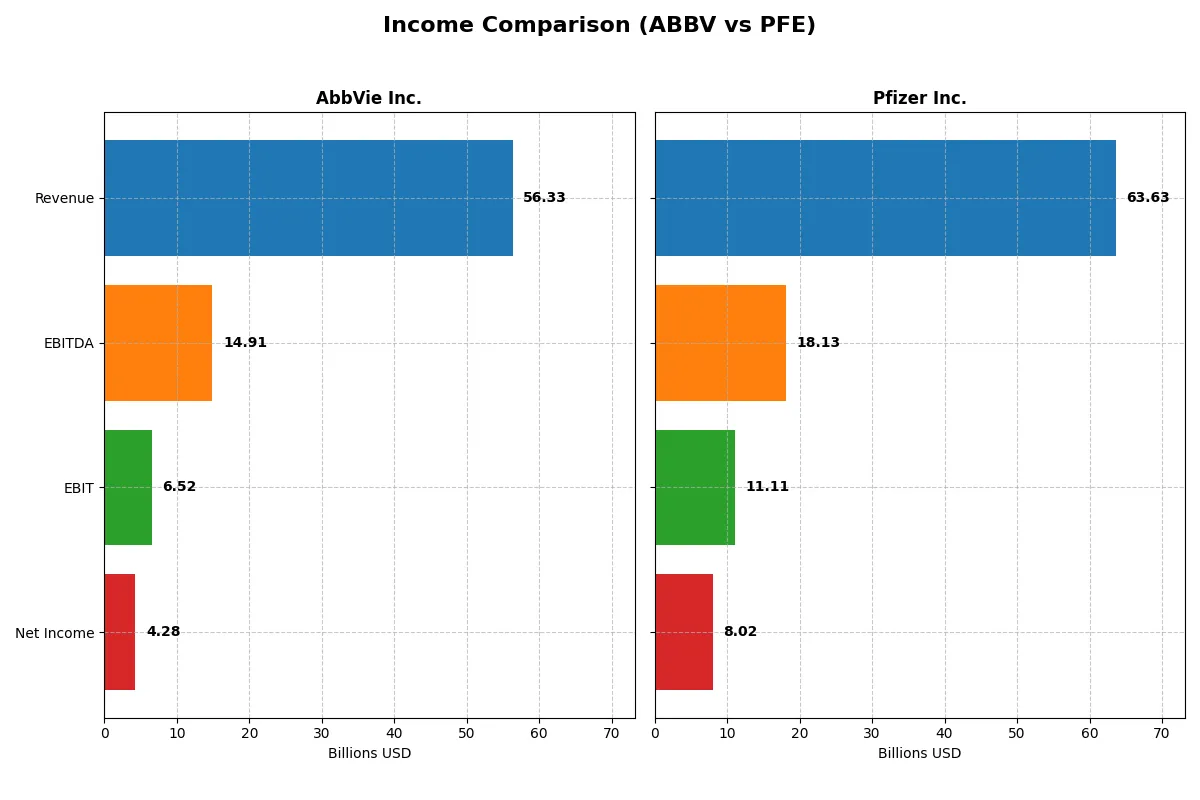
Income Statement Comparison
This data dissects the core profitability and scalability of both corporate engines to reveal who dominates the bottom line:
| Metric | AbbVie Inc. (ABBV) | Pfizer Inc. (PFE) |
|---|---|---|
| Revenue | 56.3B | 63.6B |
| Cost of Revenue | 16.9B | 21.8B |
| Operating Expenses | 30.3B | 25.4B |
| Gross Profit | 39.4B | 41.8B |
| EBITDA | 14.9B | 18.1B |
| EBIT | 6.5B | 11.1B |
| Interest Expense | 2.8B | 3.1B |
| Net Income | 4.3B | 8.0B |
| EPS | 2.40 | 1.42 |
| Fiscal Year | 2024 | 2024 |
Income Statement Analysis: The Bottom-Line Duel
This income statement comparison exposes the true efficiency and momentum driving AbbVie Inc. and Pfizer Inc.’s profit engines through recent years.
AbbVie Inc. Analysis
AbbVie’s revenue climbs steadily, reaching $56.3B in 2024, though net income shrinks to $4.28B, signaling margin pressure. Its gross margin remains robust near 70%, but net margin contracts to 7.6%, reflecting higher expenses and declining EBIT (-23% year-over-year). The latest year reveals efficiency challenges despite solid top-line growth.
Pfizer Inc. Analysis
Pfizer posts higher revenue at $63.6B in 2024, with net income rebounding sharply to $8.02B after prior dips. Its gross margin stands at a healthy 65.8%, with a strong net margin of 12.6%. Pfizer’s EBIT surges 240% year-over-year, showcasing operational leverage and momentum that significantly outpaces AbbVie’s recent profitability trends.
Momentum and Margin: Pfizer’s Operational Edge vs. AbbVie’s Margin Strain
Pfizer’s income statement demonstrates stronger operational momentum and margin expansion, outpacing AbbVie’s slower revenue growth and margin compression. While AbbVie maintains a healthy gross margin, its net income and EBIT declines raise concerns. Pfizer’s profile appeals more to investors seeking improving efficiency and profit growth in 2026.
Financial Ratios Comparison
These vital ratios act as a diagnostic tool to expose the underlying fiscal health, valuation premiums, and capital efficiency of the companies compared below:
| Ratios | AbbVie Inc. (ABBV) | Pfizer Inc. (PFE) |
|---|---|---|
| ROE | 1.29 | 0.09 |
| ROIC | 0.09 | 0.09 |
| P/E | 73.5 | 18.7 |
| P/B | 94.5 | 1.7 |
| Current Ratio | 0.66 | 1.17 |
| Quick Ratio | 0.55 | 0.92 |
| D/E | 20.4 | 0.76 |
| Debt-to-Assets | 0.50 | 0.31 |
| Interest Coverage | 3.25 | 5.33 |
| Asset Turnover | 0.42 | 0.30 |
| Fixed Asset Turnover | 10.97 | 3.46 |
| Payout Ratio | 2.58 | 1.19 |
| Dividend Yield | 3.51% | 6.33% |
| Fiscal Year | 2024 | 2024 |
Efficiency & Valuation Duel: The Vital Signs
Financial ratios act as a company’s DNA, unveiling hidden risks and operational strengths invisible in headline figures.
AbbVie Inc.
AbbVie posts a stellar ROE at 128.7%, signaling strong profitability, but its P/E of 73.5 marks the stock as expensive. The net margin at 7.6% remains neutral, reflecting moderate efficiency. Despite a weak current ratio of 0.66, AbbVie supports shareholders with a 3.5% dividend yield, balancing valuation concerns with steady returns.
Pfizer Inc.
Pfizer shows a modest ROE of 9.1%, underperforming on profitability but maintains a reasonable P/E of 18.7, suggesting fair valuation. Its net margin of 12.6% is favorable, indicating operational efficiency. Pfizer’s current ratio of 1.17 is healthier, and a 6.3% dividend yield highlights a shareholder-friendly approach with reliable income.
Premium Valuation vs. Operational Safety
AbbVie commands a premium valuation fueled by exceptional ROE but struggles with liquidity and leverage. Pfizer offers a safer liquidity profile and attractive dividends, though with lower profitability. Investors seeking growth may lean toward AbbVie, while risk-averse profiles may prefer Pfizer’s balanced metrics.
Which one offers the Superior Shareholder Reward?
AbbVie pays a 3.5% dividend with a payout ratio above 250%, signaling unsustainable dividends despite strong free cash flow (FCF) of 10B+. Its buybacks are significant but leveraged, as debt-to-equity exceeds 20x. Pfizer yields 6.3% with a modest 119% payout, backed by steady FCF (1.7B) and manageable debt (debt/equity ~0.76). Pfizer’s buyback activity is less aggressive but more sustainable. I conclude Pfizer offers a superior total return profile in 2026, balancing yield, capital allocation, and long-term value preservation.
Comparative Score Analysis: The Strategic Profile
The radar chart reveals the fundamental DNA and trade-offs of both firms, highlighting their financial strengths and weaknesses across key metrics:
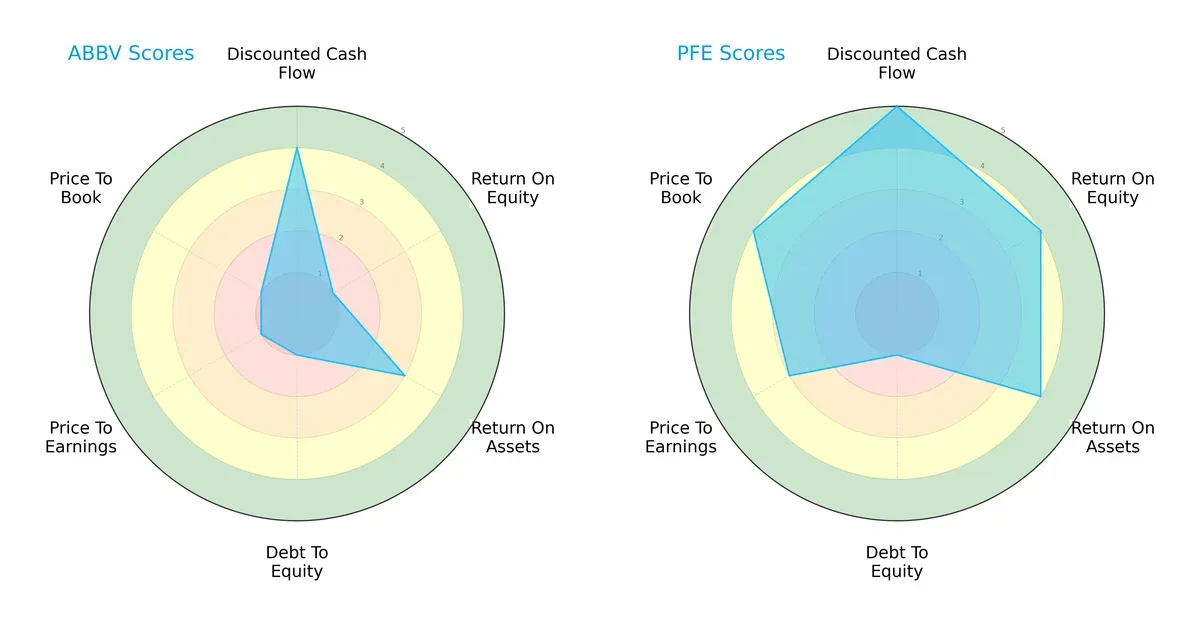
Pfizer Inc. (PFE) exhibits a more balanced profile with high scores in discounted cash flow (5), return on equity (4), and return on assets (4). AbbVie Inc. (ABBV) leans heavily on discounted cash flow (4) but trails in profitability and valuation metrics, with very unfavorable scores in ROE (1), debt/equity (1), and valuation ratios (PE/PB: 1 each). Pfizer’s diversified strengths offer a more robust investment case, while AbbVie relies mainly on cash flow advantages amid financial risk concerns.
Bankruptcy Risk: Solvency Showdown
The Altman Z-Scores place both companies in the grey zone, signaling moderate bankruptcy risk in this cycle:
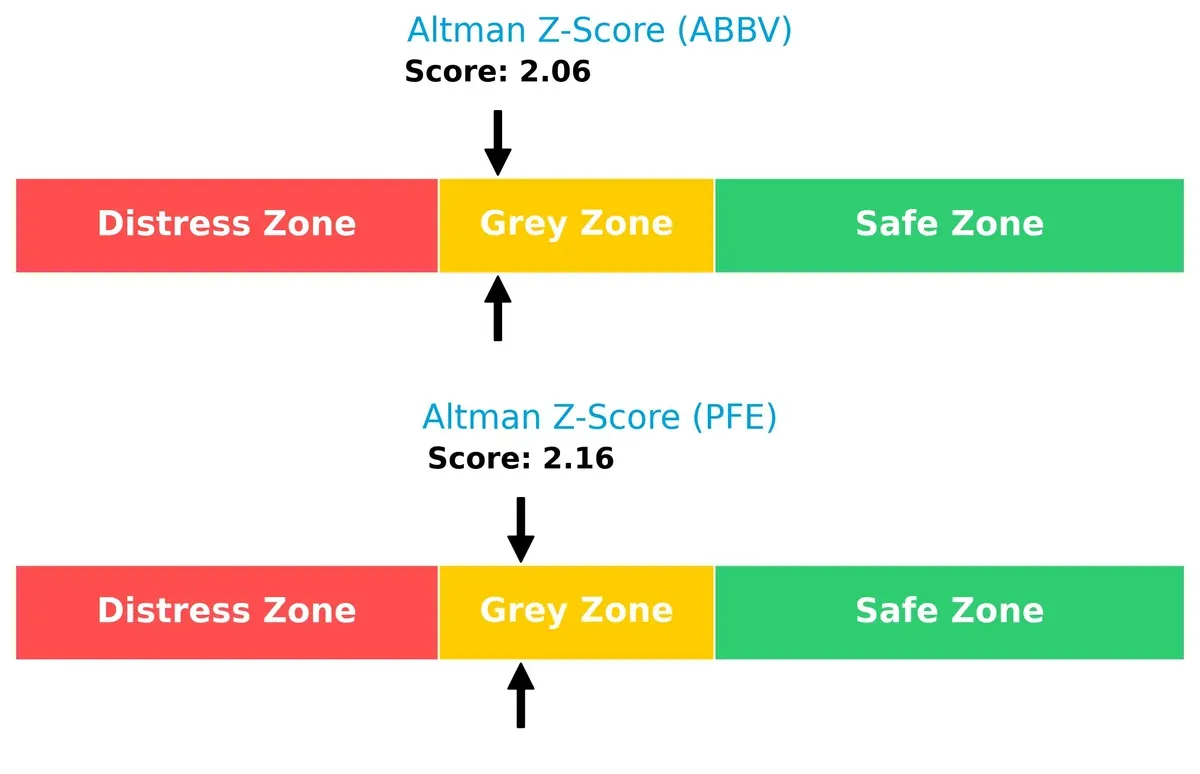
Pfizer’s score of 2.16 slightly exceeds AbbVie’s 2.06, indicating marginally stronger solvency. Historically in pharmaceuticals, sustaining a Z-score above 2 helps navigate market cycles, but both firms must reinforce liquidity to avoid distress under economic stress.
Financial Health: Quality of Operations
Piotroski F-Scores show Pfizer (7) in strong financial health, outperforming AbbVie’s average score of 6:
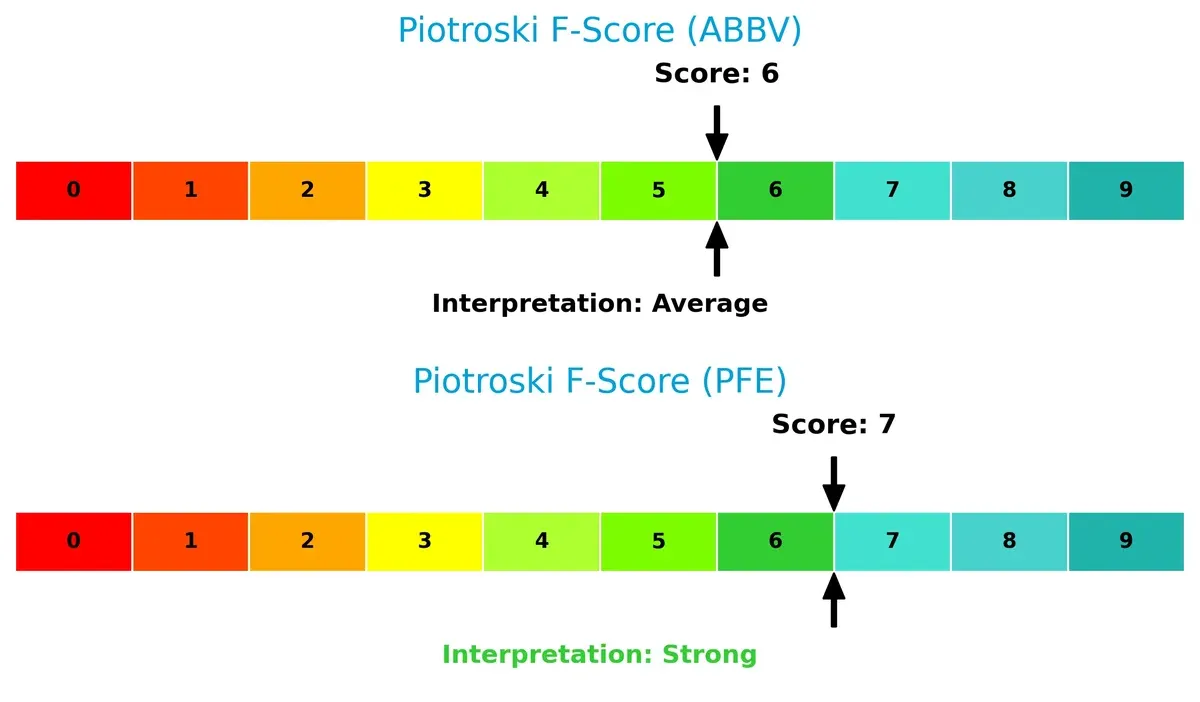
Pfizer’s higher score reflects better profitability, leverage, and operational efficiency. AbbVie’s lower score suggests potential red flags in internal metrics, warranting cautious scrutiny of its financial resilience compared to Pfizer’s more robust fundamentals.
How are the two companies positioned?
This section dissects AbbVie and Pfizer’s operational DNA by comparing their revenue distribution and internal dynamics—strengths and weaknesses. The goal is to confront their economic moats to identify which model offers the most resilient, sustainable competitive advantage today.
Revenue Segmentation: The Strategic Mix
This visual comparison dissects how AbbVie Inc. and Pfizer Inc. diversify their income streams and highlights their primary sector bets:
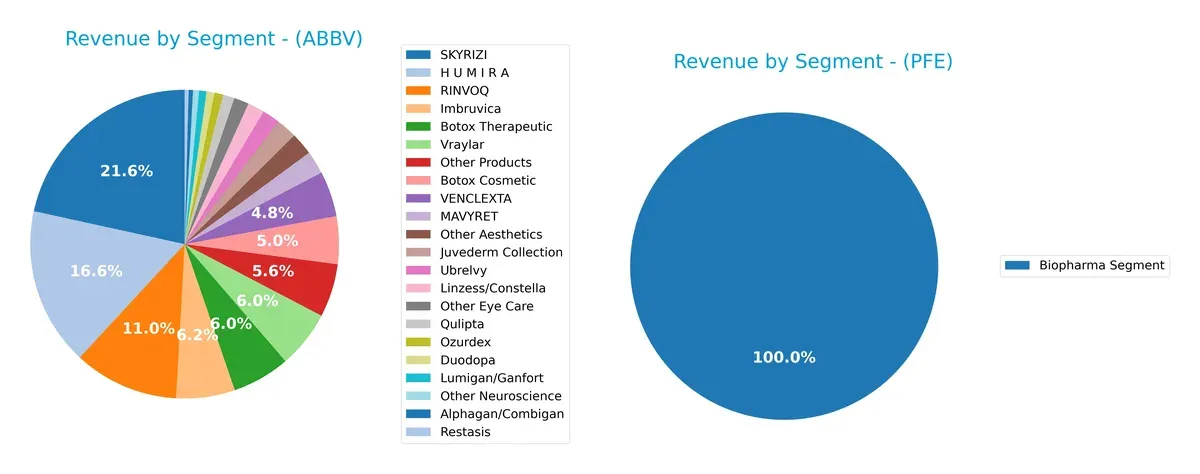
AbbVie leans heavily on specialty drugs, with SKYRIZI at $11.7B and HUMIRA at $9B anchoring its portfolio. Its diverse aesthetics and neuroscience lines, each in the $1B+ range, show broad exposure. Pfizer, meanwhile, pivots almost entirely on its Biopharma Segment, generating $62.4B in 2024, signaling concentration risk. AbbVie’s mix fosters ecosystem lock-in, while Pfizer’s dominance suggests infrastructure scale but less product diversity.
Strengths and Weaknesses Comparison
This table compares the Strengths and Weaknesses of AbbVie Inc. and Pfizer Inc.:
AbbVie Strengths
- Diversified revenue across aesthetics, neuroscience, and immunology
- Strong US market presence with $43B revenue
- Favorable ROE (128.66%) and WACC (5.17%)
- High fixed asset turnover (10.97)
- Dividend yield at 3.51%
Pfizer Strengths
- Large global footprint with $39B US and $25B international revenue
- Favorable net margin (12.6%) and WACC (5.45%)
- Moderate P/E (18.74) and P/B (1.7) ratios
- Neutral current and quick ratios indicating liquidity balance
- Favorable fixed asset turnover (3.46)
AbbVie Weaknesses
- High debt levels with debt-to-assets at 50.19%
- Low current (0.66) and quick (0.55) ratios signal liquidity risk
- Unfavorable P/E (73.48) and P/B (94.54) ratios
- Asset turnover low at 0.42
- Net margin only neutral (7.59%)
Pfizer Weaknesses
- ROE low at 9.09%, below sector average
- Asset turnover weak at 0.3
- Dividend yield neutral at 6.33%
- Some revenue concentration in Biopharma segment
- Neutral liquidity ratios may limit flexibility
AbbVie exhibits strengths in profitability metrics and fixed asset efficiency but faces concerns over high leverage and liquidity. Pfizer shows more balanced financial ratios and a stronger global revenue base but registers lower returns on equity and asset utilization. These contrasts highlight differing strategic priorities and financial structures.
The Moat Duel: Analyzing Competitive Defensibility
A structural moat protects long-term profits from relentless competition erosion. It defines which companies sustain superior returns over decades:
AbbVie Inc.: Intangible Assets and Product Pipeline Moat
AbbVie’s moat stems from its patented drugs and strong R&D, reflected in stable gross margins near 70%. However, EBIT and net margins face pressure in 2026 from patent cliffs and competition. New immunology therapies could deepen its moat if successful.
Pfizer Inc.: Innovation and Global Scale Moat
Pfizer leverages broad vaccine and therapeutic portfolios, outperforming AbbVie with a growing ROIC and higher EBIT margin of 17.5%. Its expanding emerging markets footprint and mRNA tech pipeline boost its competitive position. Pfizer’s 2026 outlook benefits from product diversification and scale advantages.
Patent Protection vs. Global Innovation Scale
Pfizer’s moat is wider and deepening, driven by innovation and geographic expansion. AbbVie holds a narrower but stable moat reliant on key drugs. Pfizer is better positioned to defend and grow market share amid evolving industry dynamics.
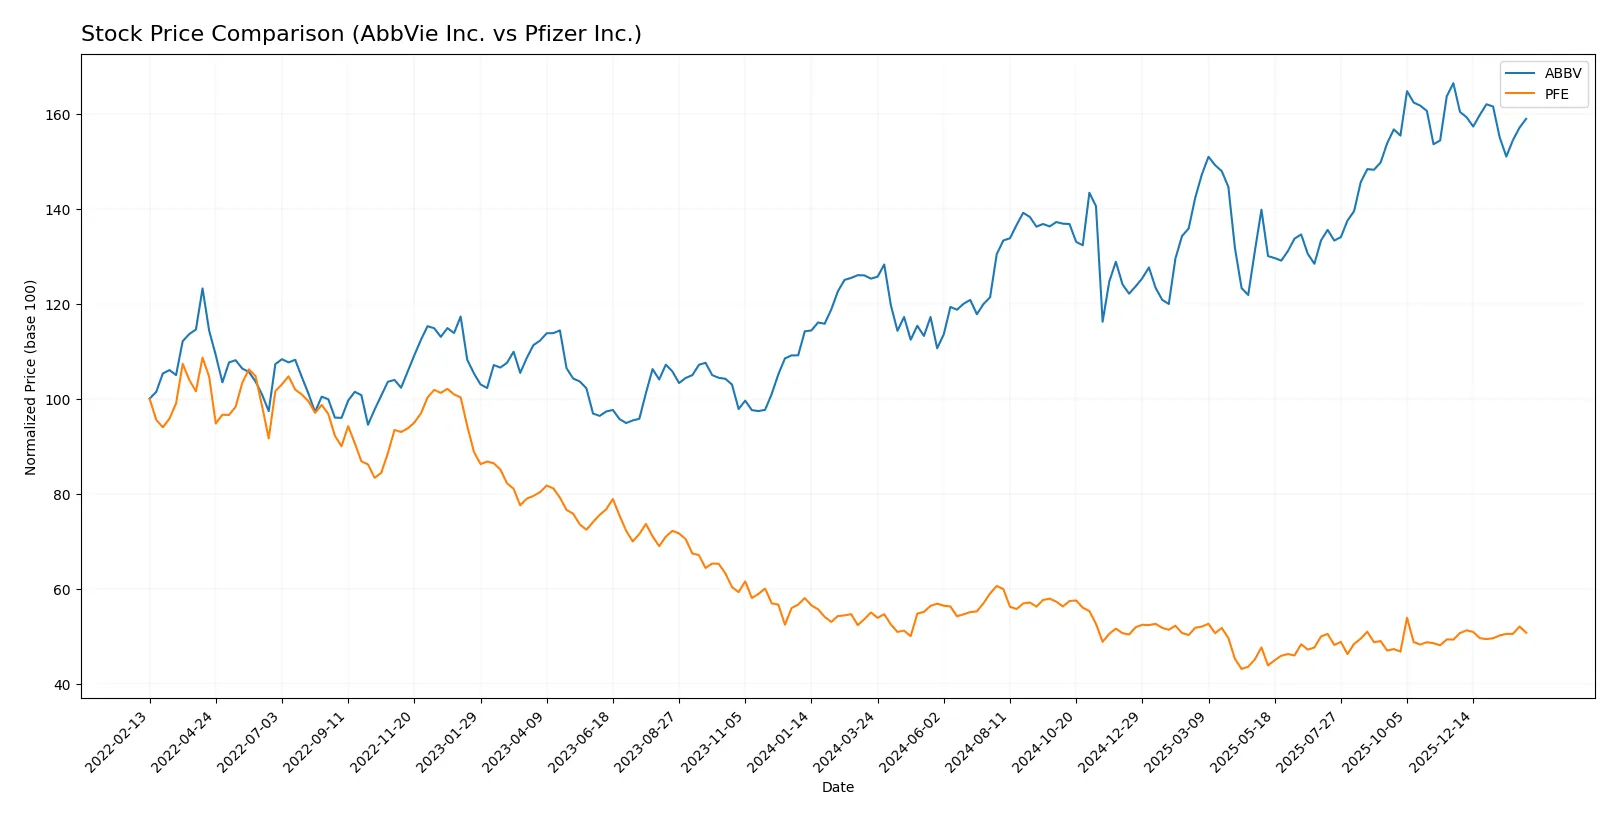
Which stock offers better returns?
The past year shows AbbVie’s stock rising sharply before slowing, while Pfizer’s price declines overall but gains modestly in recent months.
Trend Comparison
AbbVie’s stock price increased 26.84% over the past 12 months, indicating a bullish trend with decelerating momentum and high volatility.
Pfizer’s stock fell 7.77% over the same period, showing a bearish trend with accelerating decline but a slight recent rebound of 2.92%.
AbbVie outperformed Pfizer with stronger overall gains despite recent slowing; Pfizer’s modest recovery has yet to offset its year-long losses.
Target Prices
Analysts present a clear target price consensus for AbbVie Inc. and Pfizer Inc., reflecting moderate upside potential.
| Company | Target Low | Target High | Consensus |
|---|---|---|---|
| AbbVie Inc. | 223 | 289 | 256.7 |
| Pfizer Inc. | 24 | 35 | 28 |
AbbVie’s consensus target of 256.7 suggests a 14% upside from the current 225.63 price. Pfizer’s target consensus of 28 indicates an 8.6% gain potential versus its 25.77 price.

Don’t Let Luck Decide Your Entry Point
Optimize your entry points with our advanced ProRealTime indicators. You’ll get efficient buy signals with precise price targets for maximum performance. Start outperforming now!
How do institutions grade them?
AbbVie Inc. Grades
The following table summarizes recent institutional grades for AbbVie Inc.:
| Grading Company | Action | New Grade | Date |
|---|---|---|---|
| Citigroup | Maintain | Neutral | 2026-01-27 |
| Wolfe Research | Downgrade | Peer Perform | 2026-01-08 |
| Morgan Stanley | Maintain | Overweight | 2025-12-12 |
| HSBC | Upgrade | Buy | 2025-12-10 |
| UBS | Maintain | Neutral | 2025-11-07 |
| Piper Sandler | Maintain | Overweight | 2025-11-05 |
| Citigroup | Maintain | Neutral | 2025-11-03 |
| JP Morgan | Maintain | Overweight | 2025-11-03 |
| Guggenheim | Maintain | Buy | 2025-10-20 |
| Raymond James | Maintain | Outperform | 2025-10-17 |
Pfizer Inc. Grades
The following table summarizes recent institutional grades for Pfizer Inc.:
| Grading Company | Action | New Grade | Date |
|---|---|---|---|
| Cantor Fitzgerald | Maintain | Neutral | 2026-01-27 |
| Morgan Stanley | Maintain | Equal Weight | 2025-12-17 |
| B of A Securities | Maintain | Neutral | 2025-12-15 |
| Morgan Stanley | Maintain | Equal Weight | 2025-12-12 |
| Guggenheim | Maintain | Buy | 2025-11-24 |
| Morgan Stanley | Maintain | Equal Weight | 2025-10-10 |
| B of A Securities | Maintain | Neutral | 2025-10-03 |
| B of A Securities | Maintain | Neutral | 2025-08-06 |
| Morgan Stanley | Maintain | Equal Weight | 2025-08-06 |
| Citigroup | Maintain | Neutral | 2025-08-06 |
Which company has the best grades?
AbbVie consistently receives higher ratings, including multiple Buy and Overweight grades, unlike Pfizer, which mainly holds Neutral and Equal Weight ratings. This suggests stronger institutional confidence in AbbVie’s near-term prospects, potentially influencing investor sentiment accordingly.
Risks specific to each company
The following categories outline critical pressure points and systemic threats facing AbbVie Inc. and Pfizer Inc. in the 2026 market environment:
1. Market & Competition
AbbVie Inc.
- Faces intense competition in specialty pharmaceuticals; high P/E and P/B ratios suggest valuation concerns.
Pfizer Inc.
- Strong presence in vaccines and biopharma; more diversified portfolio but faces generic competition risks.
2. Capital Structure & Debt
AbbVie Inc.
- High debt-to-equity ratio at 20.4 with 50% debt to assets signals financial leverage risk.
Pfizer Inc.
- Moderate debt levels; debt-to-equity at 0.76 and 31% debt to assets indicate healthier balance sheet.
3. Stock Volatility
AbbVie Inc.
- Low beta of 0.334 implies lower market volatility and defensive stock characteristics.
Pfizer Inc.
- Slightly higher beta at 0.441, reflecting moderate sensitivity to market swings.
4. Regulatory & Legal
AbbVie Inc.
- Exposure to patent cliffs and regulatory scrutiny on blockbuster drugs like HUMIRA.
Pfizer Inc.
- Faces ongoing regulatory challenges globally, especially around vaccine approvals and pricing.
5. Supply Chain & Operations
AbbVie Inc.
- Dependency on biologics manufacturing with potential supply chain disruptions.
Pfizer Inc.
- Extensive contract manufacturing network enhances flexibility but also adds complexity.
6. ESG & Climate Transition
AbbVie Inc.
- Moderate ESG risk; pressure to improve sustainability in operations and product lifecycle.
Pfizer Inc.
- Greater focus on ESG initiatives; stronger climate transition plans relative to peers.
7. Geopolitical Exposure
AbbVie Inc.
- Primarily US-based with limited geopolitical risks but vulnerable to trade and tariff changes.
Pfizer Inc.
- More global footprint increases geopolitical risks but also diversifies revenue sources.
Which company shows a better risk-adjusted profile?
AbbVie’s most significant risk is its elevated leverage and stretched valuation metrics, which could amplify financial distress in downturns. Pfizer’s key risk lies in regulatory and competitive pressures in vaccines and biopharma, though its balanced capital structure offers stability. Pfizer demonstrates a better risk-adjusted profile, supported by a stronger Piotroski score of 7 versus AbbVie’s 6, reflecting superior financial health. The recent surge in Pfizer’s contract manufacturing volume evidences operational resilience, justifying my confidence despite market headwinds.
Final Verdict: Which stock to choose?
AbbVie’s superpower lies in its ability to generate strong returns on invested capital well above its cost of capital, reflecting a durable economic moat. However, its stretched balance sheet and weak liquidity ratios serve as a point of vigilance. This stock might suit investors seeking aggressive growth with a tolerance for financial leverage.
Pfizer stands out for its strategic moat rooted in a steadily growing ROIC and a more balanced financial profile, including healthier liquidity and moderate valuation multiples. Its safety cushion relative to AbbVie aligns well with investors favoring GARP (Growth at a Reasonable Price) strategies focused on stability and sustainable profitability.
If you prioritize high return on capital and can tolerate higher financial risk, AbbVie emerges as a compelling choice due to its value creation and growth potential. However, if you seek better financial stability and a more moderate valuation, Pfizer offers superior safety and a durable competitive advantage, appealing to more risk-averse growth investors.
Disclaimer: Investment carries a risk of loss of initial capital. The past performance is not a reliable indicator of future results. Be sure to understand risks before making an investment decision.
Go Further
I encourage you to read the complete analyses of AbbVie Inc. and Pfizer Inc. to enhance your investment decisions: