Home > Comparison > Healthcare > ABBV vs MRK
The strategic rivalry between AbbVie Inc. and Merck & Co., Inc. shapes the competitive landscape of the global healthcare sector. AbbVie operates as a focused pharmaceutical innovator specializing in immunology and oncology therapies, while Merck combines broad pharmaceutical offerings with an expansive animal health division. This analysis explores their contrasting operational models and growth strategies to determine which company presents a superior risk-adjusted opportunity for a balanced investment portfolio.
Table of contents
Companies Overview
AbbVie and Merck stand as titans in the global pharmaceutical arena, shaping healthcare with extensive drug portfolios.
AbbVie Inc.: Specialty Pharmaceuticals Leader
AbbVie dominates as a specialty pharmaceutical developer, generating revenue primarily through immunology and oncology drugs like HUMIRA and IMBRUVICA. In 2026, the company prioritizes innovation in autoimmune therapies and oncology pipelines, leveraging its strong patent protections to sustain growth and defend market share.
Merck & Co., Inc.: Diversified Healthcare Innovator
Merck operates as a broad-spectrum healthcare provider with a dual focus on human pharmaceuticals and animal health. Its core revenue streams include vaccines and treatments across oncology, immunology, and infectious diseases. Merck’s 2026 strategy emphasizes expanding vaccine accessibility and advancing collaborative R&D in HIV and other chronic conditions.
Strategic Collision: Similarities & Divergences
Both firms excel in drug innovation but diverge in business models: AbbVie leans on a specialty drug portfolio, while Merck pursues a diversified healthcare approach including animal health. They directly compete in oncology and immunology markets. AbbVie’s concentrated product moat contrasts with Merck’s broader, partnership-driven pipeline, defining unique risk and growth profiles for investors.
Income Statement Comparison
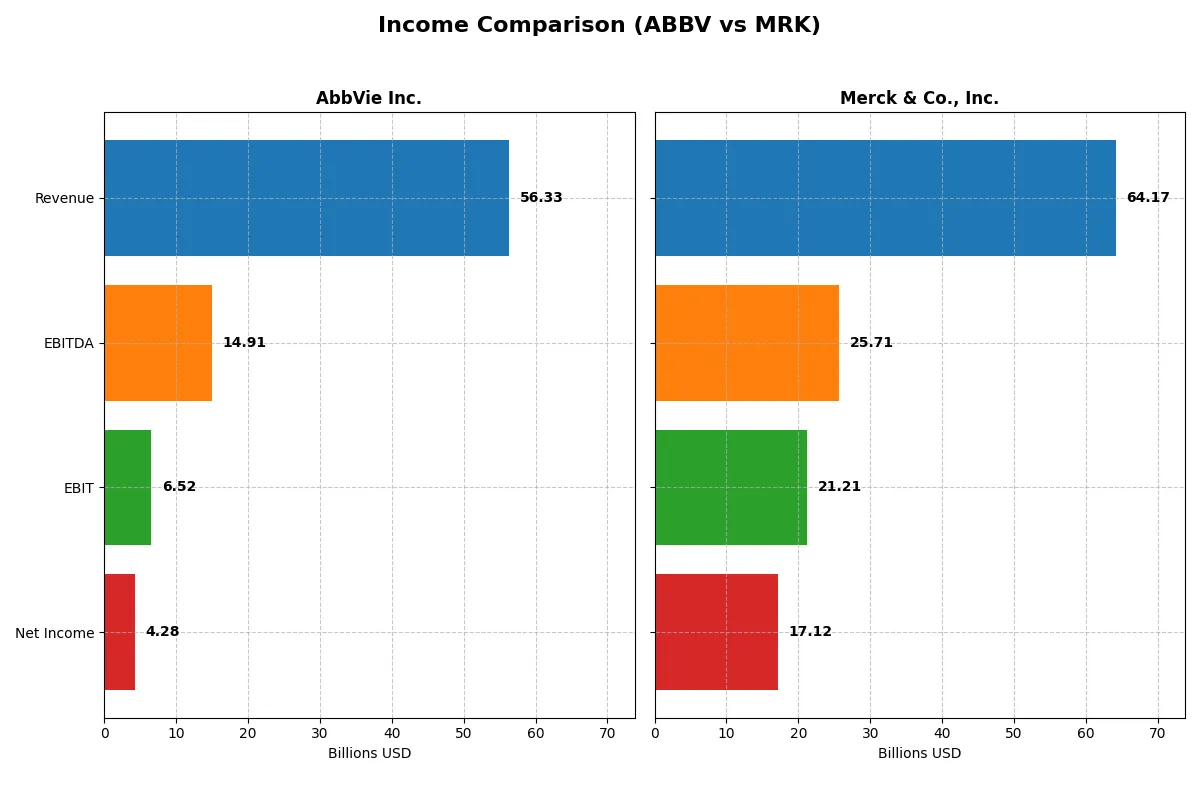
This data dissects the core profitability and scalability of both corporate engines to reveal who dominates the bottom line in the most recent fiscal year:
| Metric | AbbVie Inc. (ABBV) | Merck & Co., Inc. (MRK) |
|---|---|---|
| Revenue | 56.3B | 64.2B |
| Cost of Revenue | 16.9B | 15.2B |
| Operating Expenses | 30.3B | 28.8B |
| Gross Profit | 39.4B | 48.9B |
| EBITDA | 14.9B | 25.7B |
| EBIT | 6.5B | 21.2B |
| Interest Expense | 2.8B | 1.3B |
| Net Income | 4.3B | 17.1B |
| EPS | 2.40 | 6.76 |
| Fiscal Year | 2024 | 2024 |
Income Statement Analysis: The Bottom-Line Duel
This income statement comparison reveals which company drives superior profitability and operational efficiency in a competitive pharmaceutical landscape.
AbbVie Inc. Analysis
AbbVie’s revenue grew modestly to $56.3B in 2024, up 3.7% year-over-year. However, net income declined to $4.28B, reflecting margin pressure. Its gross margin remains solid near 70%, but net margin slid to 7.6%, signaling rising costs and weaker bottom-line momentum. Efficiency challenges surfaced as EBIT fell by 23%, indicating operational headwinds.
Merck & Co., Inc. Analysis
Merck posted robust revenue growth to $64.2B in 2024, a 6.7% rise, with net income surging to $17.1B. Gross margin expanded to 76.3%, while net margin soared to 26.7%. EBIT skyrocketed nearly sixfold, demonstrating exceptional operational leverage. Merck’s strong cost control and margin expansion reflect a powerful earnings rebound and superior income quality.
Margin Strength vs. Earnings Momentum
Merck clearly outpaces AbbVie in both revenue growth and profitability, boasting higher margins and a dramatic net income surge. AbbVie’s shrinking earnings and compressed margins expose operational strains despite steady top-line growth. For investors, Merck’s profile suggests a more attractive blend of growth and margin expansion in the current market cycle.
Financial Ratios Comparison
These vital ratios act as a diagnostic tool to expose the underlying fiscal health, valuation premiums, and capital efficiency of the companies analyzed:
| Ratios | AbbVie Inc. (ABBV) | Merck & Co., Inc. (MRK) |
|---|---|---|
| ROE | 129% | 37% |
| ROIC | 8.9% | 19.0% |
| P/E | 73.5x | 14.7x |
| P/B | 94.5x | 5.44x |
| Current Ratio | 0.66 | 1.36 |
| Quick Ratio | 0.55 | 1.15 |
| D/E | 20.4 | 0.83 |
| Debt-to-Assets | 50.2% | 32.7% |
| Interest Coverage | 3.25x | 15.91x |
| Asset Turnover | 0.42 | 0.55 |
| Fixed Asset Turnover | 10.97 | 2.70 |
| Payout ratio | 258% | 46% |
| Dividend yield | 3.51% | 3.11% |
| Fiscal Year | 2024 | 2024 |
Efficiency & Valuation Duel: The Vital Signs
Financial ratios act as a company’s DNA, uncovering hidden risks and revealing operational excellence essential for investment decisions.
AbbVie Inc.
AbbVie shows an exceptionally high ROE at 129%, signaling strong shareholder profitability despite a modest net margin of 7.6%. However, its valuation appears stretched with a P/E of 73.5 and a P/B of 94.5. The firm supports shareholders with a solid 3.5% dividend yield, balancing reinvestment in R&D.
Merck & Co., Inc.
Merck delivers balanced profitability with a 37% ROE and a strong net margin of 26.7%. Its valuation remains reasonable at a P/E of 14.7 but shows a slightly elevated P/B of 5.4. Merck combines a 3.1% dividend yield with efficient capital use, reflected in its favorable ROIC of 19%.
Valuation Discipline vs. Profitability Strength
Merck offers a better balance of valuation and profitability metrics, with more favorable ratios and lower financial risk. AbbVie’s high ROE is offset by stretched valuation and leverage risks. Investors seeking stable operational efficiency may prefer Merck’s profile, while those targeting high profitability must weigh AbbVie’s valuation premium.
Which one offers the Superior Shareholder Reward?
I compare AbbVie and Merck’s payout models, dividend yields, payout ratios, and buyback intensity. AbbVie delivers a 3.5% yield with a payout ratio around 258%, heavily supported by strong free cash flow of 10B. Merck yields 3.1% with a conservative 46% payout ratio but less free cash flow at 7.1B. AbbVie’s aggressive buybacks and higher yield promise more immediate returns but come with higher leverage risks (debt-to-equity 20x vs. Merck’s 0.8x). Merck’s prudent capital allocation, lower leverage, and stable dividends suggest a sustainable long-term model. I favor AbbVie for total return in 2026, but cautious investors may prefer Merck’s stability.
Comparative Score Analysis: The Strategic Profile
The radar chart reveals the fundamental DNA and trade-offs of AbbVie Inc. and Merck & Co., Inc., highlighting their financial strengths and vulnerabilities:
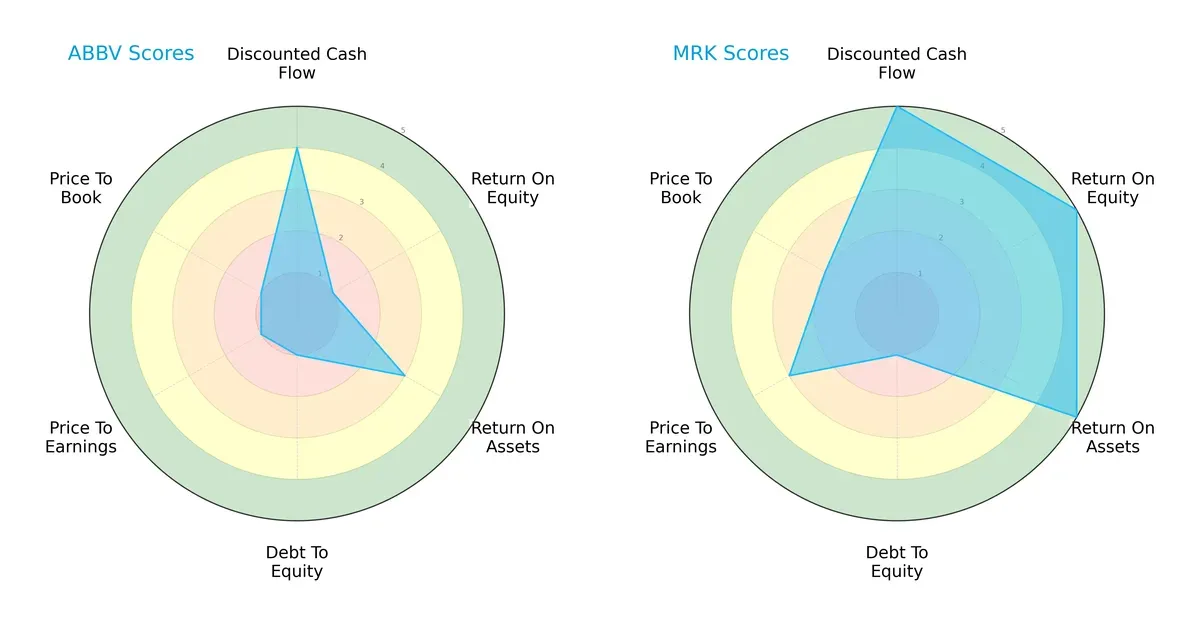
Merck dominates with very favorable scores in DCF (5), ROE (5), and ROA (5), reflecting superior profitability and asset efficiency. AbbVie shows moderate DCF (4) but weak ROE (1) and debt management (1), signaling reliance on cash flow rather than operational efficiency. Both struggle with debt-to-equity (1), but AbbVie’s valuation scores (PE/PB at 1) lag Merck’s moderate levels, indicating potential overvaluation. Merck presents a more balanced and robust profile, while AbbVie depends heavily on discounted cash flow strength.
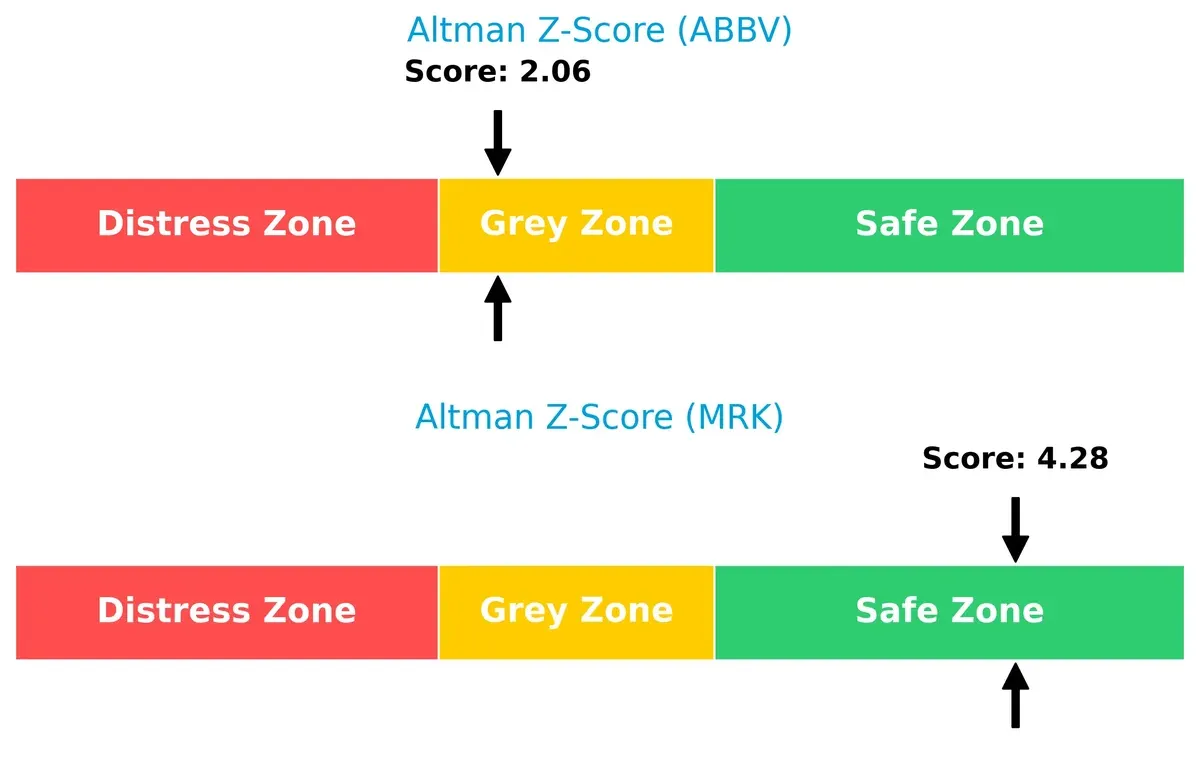
Bankruptcy Risk: Solvency Showdown
Merck’s Altman Z-Score of 4.28 places it comfortably in the safe zone, implying strong long-term survival prospects. AbbVie’s 2.06 sits in the grey zone, signaling moderate bankruptcy risk that warrants caution:
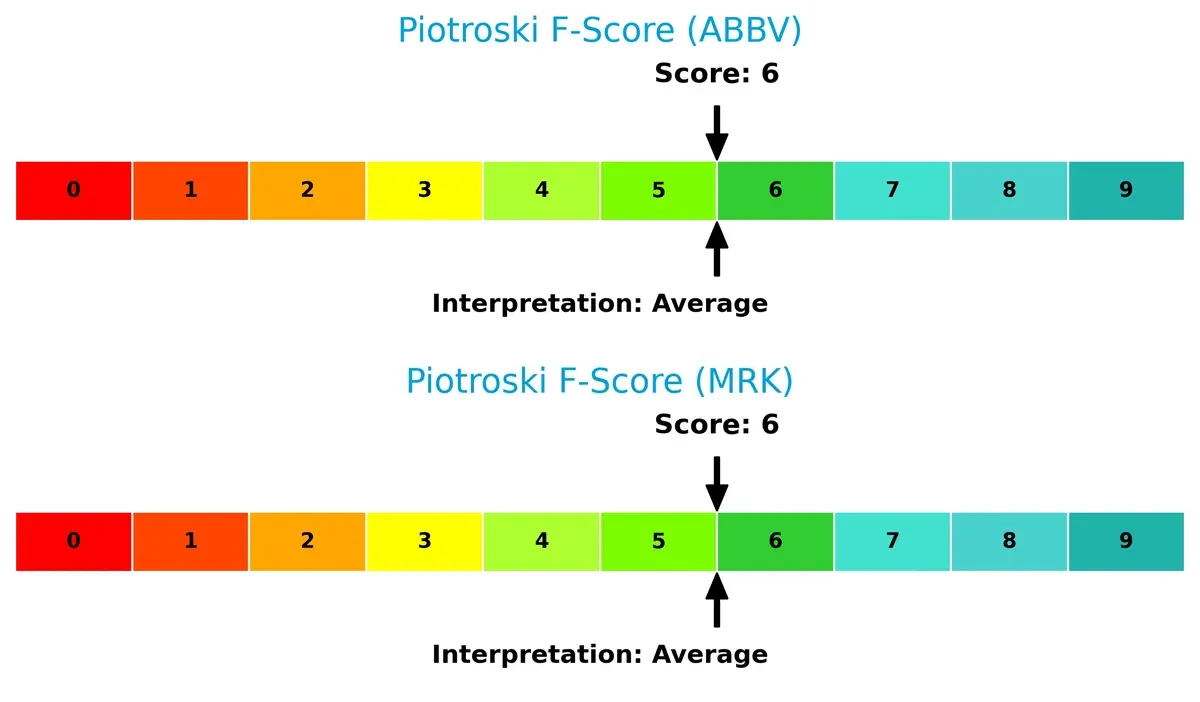
Financial Health: Quality of Operations
Both companies score a 6 on the Piotroski F-Score, indicating average financial health. Neither firm raises immediate red flags, but neither displays peak operational strength:
How are the two companies positioned?
This section dissects AbbVie and Merck’s operational DNA by comparing revenue distribution and internal dynamics. The goal is to confront their economic moats and identify which model delivers the most resilient competitive advantage today.
Revenue Segmentation: The Strategic Mix
This visual comparison dissects how AbbVie Inc. and Merck & Co., Inc. diversify their income streams and where their primary sector bets lie:
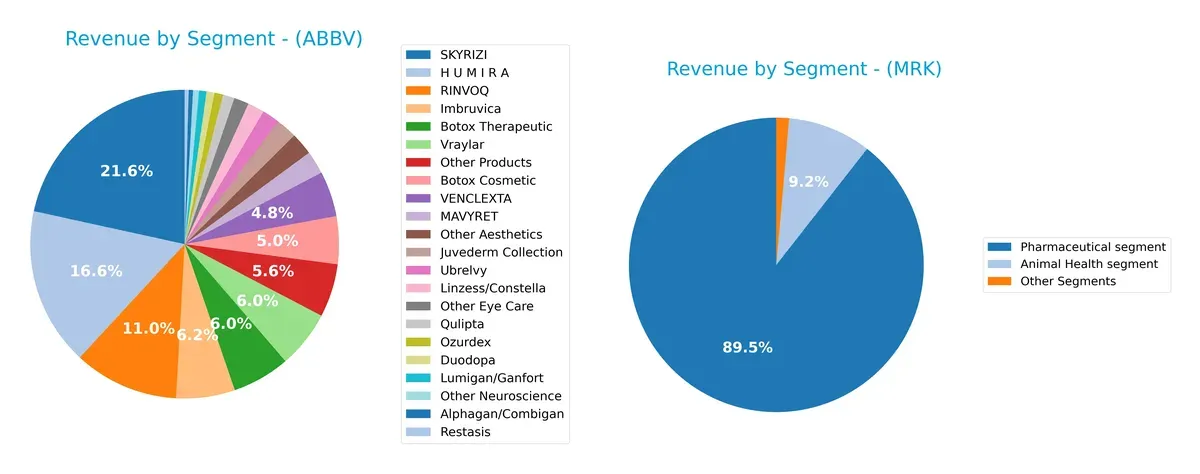
AbbVie relies heavily on its flagship immunology drugs like SKYRIZI ($11.7B) and HUMIRA ($9B), anchoring revenue in a few dominant segments. Merck, by contrast, pivots around its Pharmaceutical segment ($57.4B) but balances with a sizable Animal Health business ($5.9B), reflecting more diversification. AbbVie’s concentration risks contrast with Merck’s ecosystem lock-in across human and animal health markets. This strategic mix influences resilience amid sector cycles.
Strengths and Weaknesses Comparison
This table compares the strengths and weaknesses of AbbVie Inc. and Merck & Co., Inc. based on diversification, profitability, financial health, innovation, global presence, and market share:
AbbVie Strengths
- Strong revenue from diverse products like SKYRIZI and HUMIRA
- Favorable ROE (128.66%) and WACC (5.17%) indicating efficient capital use
- High fixed asset turnover (10.97) shows operational efficiency
- Solid dividend yield (3.51%) appealing to income investors
Merck Strengths
- High net margin (26.68%) and ROIC (18.97%) indicating robust profitability
- Favorable PE (14.72) suggests reasonable valuation
- Strong interest coverage (16.69) reflects solid debt service capacity
- Diversified revenue streams with large pharmaceutical and animal health segments
AbbVie Weaknesses
- Unfavorable high debt-to-equity (20.4) and debt-to-assets (50.19%) ratios
- Low current (0.66) and quick ratios (0.55) raise liquidity concerns
- Unfavorable PE (73.48) and PB (94.54) imply overvaluation risk
- Lower net margin (7.59%) and asset turnover (0.42) signal efficiency challenges
Merck Weaknesses
- Unfavorable PB (5.44) and moderate current ratio (1.36) limit financial flexibility
- Neutral debt ratios and asset turnover indicate average leverage and efficiency
- Reliance on pharmaceutical segment may limit diversification compared to broader product mix
AbbVie shows operational efficiency and strong capital returns but faces liquidity and valuation challenges. Merck demonstrates robust profitability and more balanced financial health but has moderate diversification risks. Both must manage these factors carefully to sustain competitive advantage.
The Moat Duel: Analyzing Competitive Defensibility
A structural moat protects long-term profits from relentless competition erosion. Let’s explore how AbbVie and Merck defend their turf:
AbbVie Inc.: Intangible Assets and Portfolio Diversification
AbbVie’s moat stems from its strong drug patents and diversified portfolio. Its stable ROIC above WACC confirms value creation, though margin pressures signal challenges in 2026.
Merck & Co., Inc.: Innovation and Expanding Product Ecosystem
Merck relies on innovation-driven moats with growing ROIC far exceeding WACC. Its accelerating profitability and broad therapeutic reach reinforce a durable competitive edge over AbbVie.
Innovation Excellence vs. Patent Fortification
Merck’s rapidly growing ROIC and expanding margins create a wider moat than AbbVie’s stable but pressured profitability. Merck is better positioned to defend and grow market share through innovation.
Which stock offers better returns?
Over the past year, AbbVie Inc. showed strong gains with a bullish trend, while Merck & Co., Inc. experienced a bearish overall trend despite recent price recovery and volume shifts.
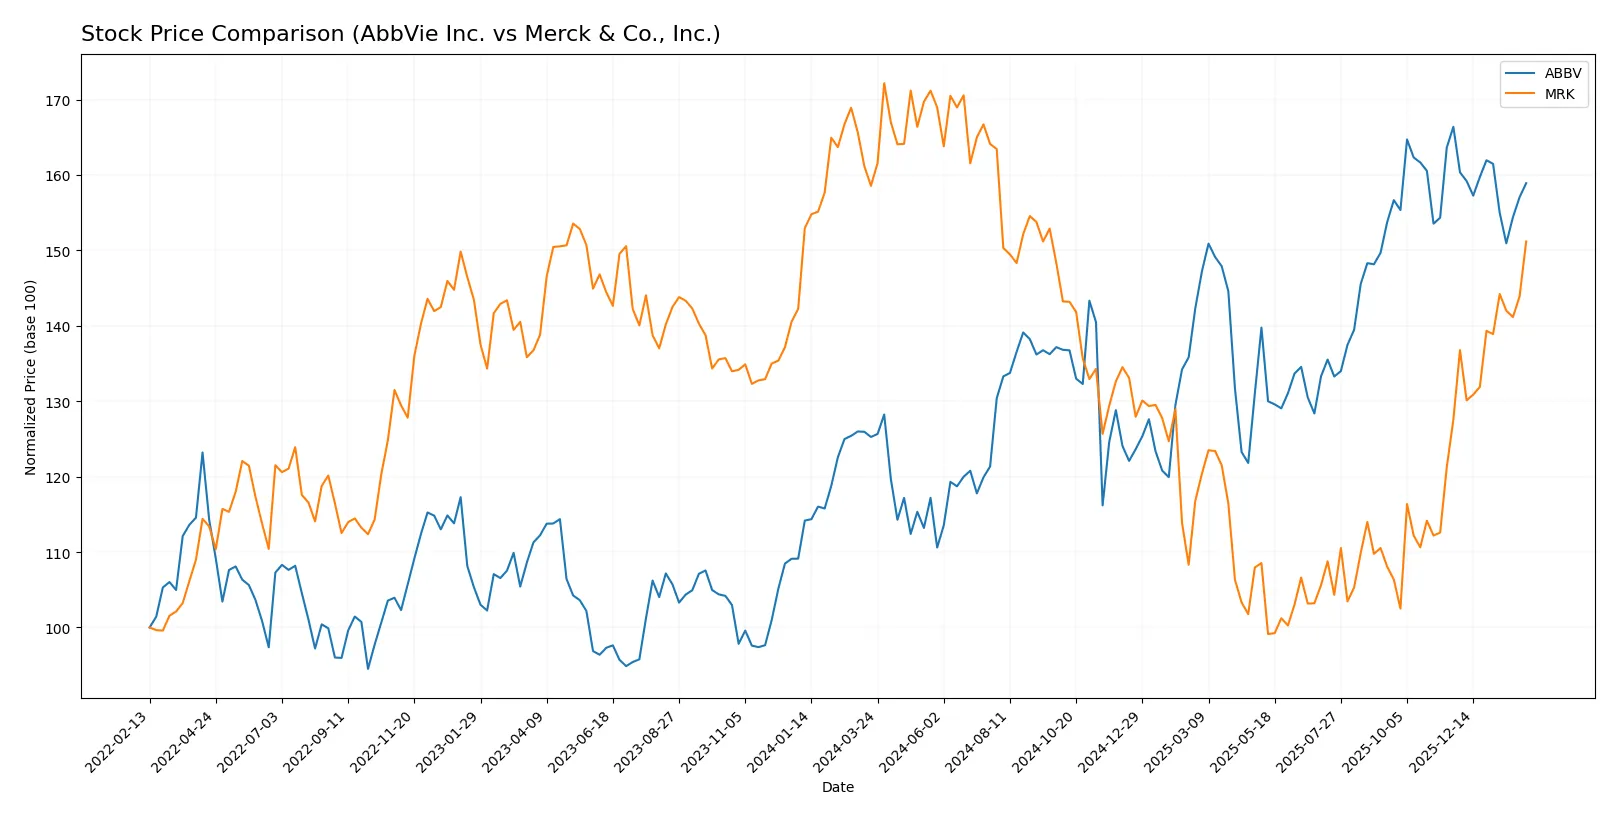
Trend Comparison
AbbVie’s stock climbed 26.86% over 12 months, indicating a bullish trend with decelerating momentum and a high volatility level (21.04 std deviation).
Merck’s stock fell 4.66% over the same period, marking a bearish trend but showed acceleration with a recent 18.51% price rise and moderately lower volatility (17.41 std deviation).
AbbVie outperformed Merck with a significant positive return, despite recent short-term weakness in AbbVie’s price and strong buyer dominance in Merck’s recent volume.
Target Prices
Analysts present a bullish consensus for AbbVie Inc. and Merck & Co., projecting solid upside potential.
| Company | Target Low | Target High | Consensus |
|---|---|---|---|
| AbbVie Inc. | 223 | 289 | 256.7 |
| Merck & Co., Inc. | 90 | 136 | 120.1 |
AbbVie’s consensus target sits roughly 14% above its current 226 price, signaling moderate growth expectations. Merck’s consensus target implies a 4% upside from its 116 price, reflecting cautious optimism.

Don’t Let Luck Decide Your Entry Point
Optimize your entry points with our advanced ProRealTime indicators. You’ll get efficient buy signals with precise price targets for maximum performance. Start outperforming now!
How do institutions grade them?
This section compares the latest institutional grades assigned to AbbVie Inc. and Merck & Co., Inc.:
AbbVie Inc. Grades
Below is a summary of recent grades from reputable financial institutions for AbbVie Inc.:
| Grading Company | Action | New Grade | Date |
|---|---|---|---|
| Citigroup | Maintain | Neutral | 2026-01-27 |
| Wolfe Research | Downgrade | Peer Perform | 2026-01-08 |
| Morgan Stanley | Maintain | Overweight | 2025-12-12 |
| HSBC | Upgrade | Buy | 2025-12-10 |
| UBS | Maintain | Neutral | 2025-11-07 |
| Piper Sandler | Maintain | Overweight | 2025-11-05 |
| Citigroup | Maintain | Neutral | 2025-11-03 |
| JP Morgan | Maintain | Overweight | 2025-11-03 |
| Guggenheim | Maintain | Buy | 2025-10-20 |
| Raymond James | Maintain | Outperform | 2025-10-17 |
Merck & Co., Inc. Grades
The following table presents recent grades from institutional analysts for Merck & Co., Inc.:
| Grading Company | Action | New Grade | Date |
|---|---|---|---|
| Citigroup | Maintain | Neutral | 2026-01-27 |
| TD Cowen | Maintain | Hold | 2026-01-20 |
| Wolfe Research | Upgrade | Outperform | 2026-01-08 |
| Citigroup | Maintain | Neutral | 2026-01-07 |
| UBS | Maintain | Buy | 2026-01-07 |
| BMO Capital | Upgrade | Outperform | 2025-12-18 |
| B of A Securities | Maintain | Buy | 2025-12-15 |
| Morgan Stanley | Maintain | Equal Weight | 2025-12-12 |
| Scotiabank | Maintain | Sector Outperform | 2025-12-04 |
| Goldman Sachs | Maintain | Buy | 2025-12-02 |
Which company has the best grades?
Merck & Co., Inc. generally receives higher and more frequent upgrades, including multiple “Outperform” and “Buy” ratings. AbbVie Inc.’s grades are more mixed, with several “Neutral” and “Overweight” ratings but fewer clear upgrades. This disparity may influence investor perception and risk assessment.
Risks specific to each company
The following categories identify the critical pressure points and systemic threats facing both firms in the 2026 market environment:
1. Market & Competition
AbbVie Inc.
- Faces pressure from biosimilar competition on HUMIRA, requiring pipeline innovation.
Merck & Co., Inc.
- Benefits from diversified portfolio and collaborations, maintaining strong competitive positioning.
2. Capital Structure & Debt
AbbVie Inc.
- High debt-to-assets ratio at 50.2% signals financial risk and leverage concerns.
Merck & Co., Inc.
- More conservative debt profile with a 32.7% debt-to-assets ratio and strong interest coverage.
3. Stock Volatility
AbbVie Inc.
- Low beta of 0.33 indicates defensive stock with limited price swings.
Merck & Co., Inc.
- Even lower beta at 0.30 reflects very stable stock with minimal volatility.
4. Regulatory & Legal
AbbVie Inc.
- Vulnerable to regulatory scrutiny on drug pricing and patent expirations.
Merck & Co., Inc.
- Faces regulatory risks but diversified vaccine and oncology portfolio mitigates impact.
5. Supply Chain & Operations
AbbVie Inc.
- Complex biologics manufacturing exposes supply chain to disruption risks.
Merck & Co., Inc.
- Integrated supply chain with animal health segment provides operational resilience.
6. ESG & Climate Transition
AbbVie Inc.
- Moderate ESG progress; pressure to improve sustainability in operations.
Merck & Co., Inc.
- Stronger ESG initiatives and commitments enhance long-term risk management.
7. Geopolitical Exposure
AbbVie Inc.
- Significant US market reliance; geopolitical tensions could disrupt pricing and access.
Merck & Co., Inc.
- More global diversification reduces single-market geopolitical risk.
Which company shows a better risk-adjusted profile?
Merck faces fewer financial risks with a stronger balance sheet and more favorable profitability metrics. AbbVie’s high leverage and weaker liquidity ratios heighten its vulnerability. Merck’s diversified pipeline and operational resilience also reduce systemic risks. AbbVie’s most impactful risk is its heavy debt load, while Merck’s is moderate regulatory and market competition. Merck’s Altman Z-Score places it safely above distress zones, confirming a superior risk-adjusted profile.
Final Verdict: Which stock to choose?
AbbVie’s superpower lies in its robust cash generation and focused capital allocation that sustains a stable competitive edge. However, its high leverage and weak liquidity ratios stand as points of vigilance. It suits investors with an appetite for aggressive growth who can tolerate balance sheet risks.
Merck commands a durable moat driven by strong profitability and efficient capital use, supported by a safer balance sheet and consistent margin expansion. Its profile fits well in a GARP portfolio seeking steady growth with a margin of safety and lower financial risk.
If you prioritize aggressive growth fueled by cash flow strength and can navigate leverage risks, AbbVie presents a compelling scenario. However, if you seek a blend of solid profitability, improving returns, and better financial stability, Merck offers a superior choice for more risk-averse investors.
Disclaimer: Investment carries a risk of loss of initial capital. The past performance is not a reliable indicator of future results. Be sure to understand risks before making an investment decision.
Go Further
I encourage you to read the complete analyses of AbbVie Inc. and Merck & Co., Inc. to enhance your investment decisions: