Home > Comparison > Healthcare > JNJ vs ABBV
The strategic rivalry between Johnson & Johnson and AbbVie Inc. defines the current trajectory of the healthcare sector. Johnson & Johnson operates as a diversified healthcare giant with strong MedTech and innovative medicine segments. AbbVie focuses on specialty pharmaceuticals with a high-margin, innovation-driven model. This head-to-head pits broad diversification against concentrated expertise. This analysis will determine which corporate trajectory offers the superior risk-adjusted outlook for a diversified portfolio.
Table of contents
Companies Overview
Johnson & Johnson and AbbVie Inc. stand as titans in the global healthcare sector, shaping drug manufacturing and innovation.
Johnson & Johnson: Healthcare Innovator with Broad Reach
Johnson & Johnson dominates as a diversified healthcare giant, generating revenue from Innovative Medicines and MedTech. It strategically exited Consumer Health in 2023 to sharpen focus on prescription drugs for complex diseases and advanced medical devices. This pivot emphasizes high-growth, innovation-driven segments serving hospitals and healthcare professionals worldwide.
AbbVie Inc.: Specialty Pharma Powerhouse
AbbVie operates as a specialized pharmaceutical leader, earning revenue through blockbuster therapies like HUMIRA and SKYRIZI targeting autoimmune and chronic diseases. Its 2026 strategy centers on expanding its immunology and oncology pipeline while leveraging collaborations to sustain growth. AbbVie’s product portfolio addresses complex conditions with a strong focus on innovation in specialty medicines.
Strategic Collision: Similarities & Divergences
Both firms prioritize innovative pharmaceuticals, but Johnson & Johnson balances this with MedTech, while AbbVie concentrates purely on specialty drugs. Their primary battleground lies in autoimmune and oncology treatments, where pipeline strength and patent protection matter most. Johnson & Johnson offers broader healthcare exposure, whereas AbbVie presents a concentrated bet on specialty pharma innovation and patent-driven growth.
Income Statement Comparison
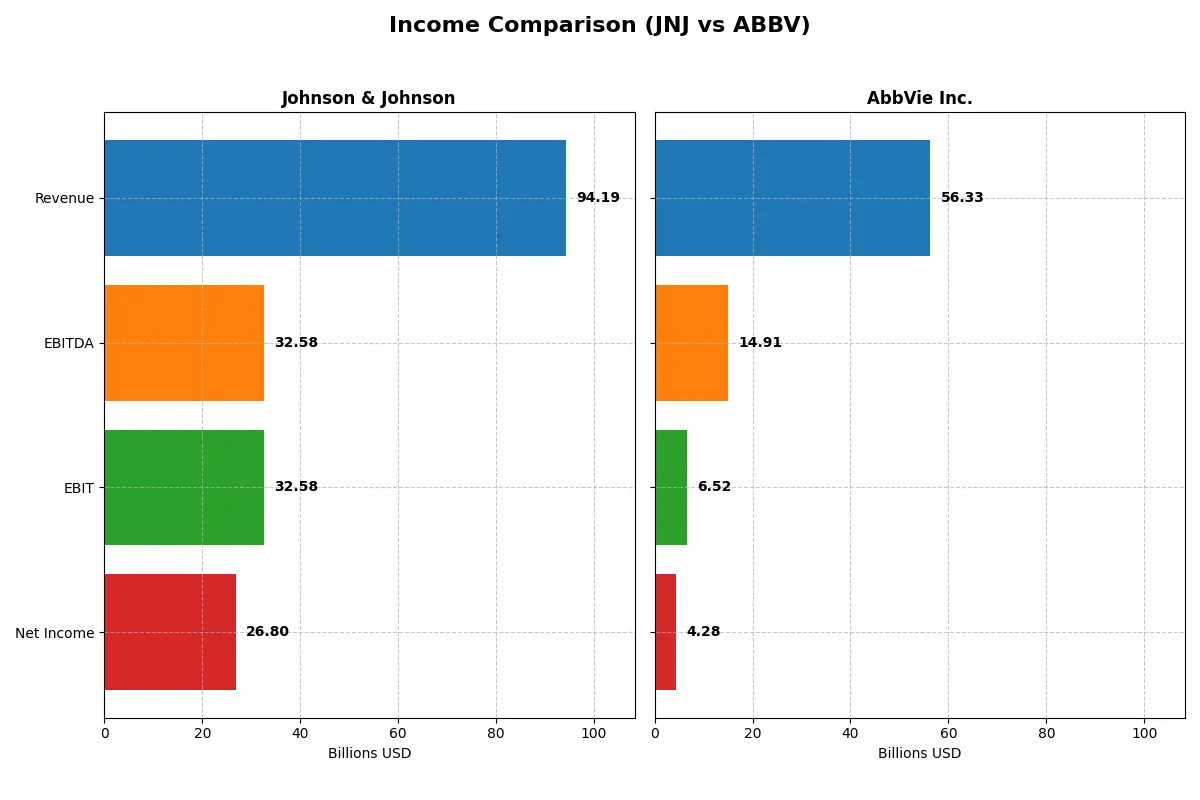
This data dissects the core profitability and scalability of both corporate engines to reveal who dominates the bottom line:
| Metric | Johnson & Johnson (JNJ) | AbbVie Inc. (ABBV) |
|---|---|---|
| Revenue | 94.2B | 56.3B |
| Cost of Revenue | 25.6B | 16.9B |
| Operating Expenses | 42.9B | 30.3B |
| Gross Profit | 68.6B | 39.4B |
| EBITDA | 32.6B | 14.9B |
| EBIT | 32.6B | 6.5B |
| Interest Expense | 0 | 2.8B |
| Net Income | 26.8B | 4.3B |
| EPS (Diluted) | 11.03 | 2.39 |
| Fiscal Year | 2025 | 2024 |
Income Statement Analysis: The Bottom-Line Duel
This income statement comparison reveals which company drives superior profitability and operational efficiency in their respective markets.
Johnson & Johnson Analysis
Johnson & Johnson’s revenue rose steadily from 79.0B in 2021 to 94.2B in 2025, with net income climbing from 20.9B to 26.8B. Its gross margin remains robust at 72.8%, while net margin stands at a strong 28.5%. The 2025 results highlight remarkable EBIT growth (+86.8%) and a near doubling of EPS, signaling accelerating operational efficiency and margin expansion.
AbbVie Inc. Analysis
AbbVie’s revenue increased from 45.8B in 2020 to 56.3B in 2024, but net income declined from 11.5B to 4.3B over five years. Gross margin is solid at 70.0%, yet net margin shrank sharply to 7.6%. The latest year shows a 23% drop in EBIT and a 15% net margin contraction, indicating margin pressures and weakening profitability despite modest revenue growth.
Margin Dominance vs. Revenue Resilience
Johnson & Johnson delivers superior margin expansion and net income growth, reflecting strong operational leverage and capital efficiency. AbbVie’s revenue growth masks deteriorating profitability and shrinking margins. For investors prioritizing consistent profit generation and margin health, Johnson & Johnson’s profile offers a clearer fundamental advantage.
Financial Ratios Comparison
These vital ratios act as a diagnostic tool to expose the underlying fiscal health, valuation premiums, and capital efficiency of the companies compared below:
| Ratios | Johnson & Johnson (JNJ) | AbbVie Inc. (ABBV) |
|---|---|---|
| ROE | 19.7% (2024) | 128.7% (2024) |
| ROIC | 13.8% (2024) | 8.9% (2024) |
| P/E | 24.5 (2024) | 73.5 (2024) |
| P/B | 4.83 (2024) | 94.5 (2024) |
| Current Ratio | 1.11 (2024) | 0.66 (2024) |
| Quick Ratio | 0.86 (2024) | 0.55 (2024) |
| D/E | 0.51 (2024) | 20.4 (2024) |
| Debt-to-Assets | 20.3% (2024) | 50.2% (2024) |
| Interest Coverage | 29.3 (2024) | 3.25 (2024) |
| Asset Turnover | 0.49 (2024) | 0.42 (2024) |
| Fixed Asset Turnover | 4.33 (2024) | 10.97 (2024) |
| Payout ratio | 46.6% (2025) | 258% (2024) |
| Dividend yield | 2.48% (2025) | 3.51% (2024) |
| Fiscal Year | 2025 | 2024 |
Efficiency & Valuation Duel: The Vital Signs
Ratios act as a company’s DNA, uncovering hidden risks and operational strengths that shape investment outcomes.
Johnson & Johnson
Johnson & Johnson shows strong profitability with a favorable 28.46% net margin but an unusual zero ROE and ROIC, signaling potential reporting gaps or restructuring. The stock trades at a neutral P/E of 18.75, reflecting fair valuation. A 2.48% dividend yield offers steady shareholder returns, supported by solid capital allocation.
AbbVie Inc.
AbbVie delivers an exceptional 128.66% ROE but a modest 7.59% net margin, indicating high leverage and potential volatility. Its valuation appears stretched with a steep P/E of 73.48 and a high P/B of 94.54. The 3.51% dividend yield compensates for risks, though heavy debt weighs on balance sheet resilience.
Premium Valuation vs. Operational Safety
AbbVie’s high ROE and dividend come at a cost of elevated leverage and stretched valuation. Johnson & Johnson balances profitability with prudent valuation and a stable dividend. Risk-averse investors may prefer Johnson & Johnson’s safer profile, while those seeking yield might consider AbbVie’s aggressive stance.
Which one offers the Superior Shareholder Reward?
Johnson & Johnson yields 2.48% with a 46.6% payout ratio, balancing dividends and share repurchases for sustainable returns. AbbVie offers a higher 3.51% yield but pays out over 250% of earnings, heavily reliant on debt. AbbVie’s buyback intensity is consistent but risks financial leverage; J&J’s moderate payout and steady buybacks signal durable capital allocation. I favor Johnson & Johnson for a superior, sustainable total shareholder return in 2026.
Comparative Score Analysis: The Strategic Profile
The radar chart reveals the fundamental DNA and trade-offs of Johnson & Johnson and AbbVie Inc., highlighting their distinct financial strengths and weaknesses:
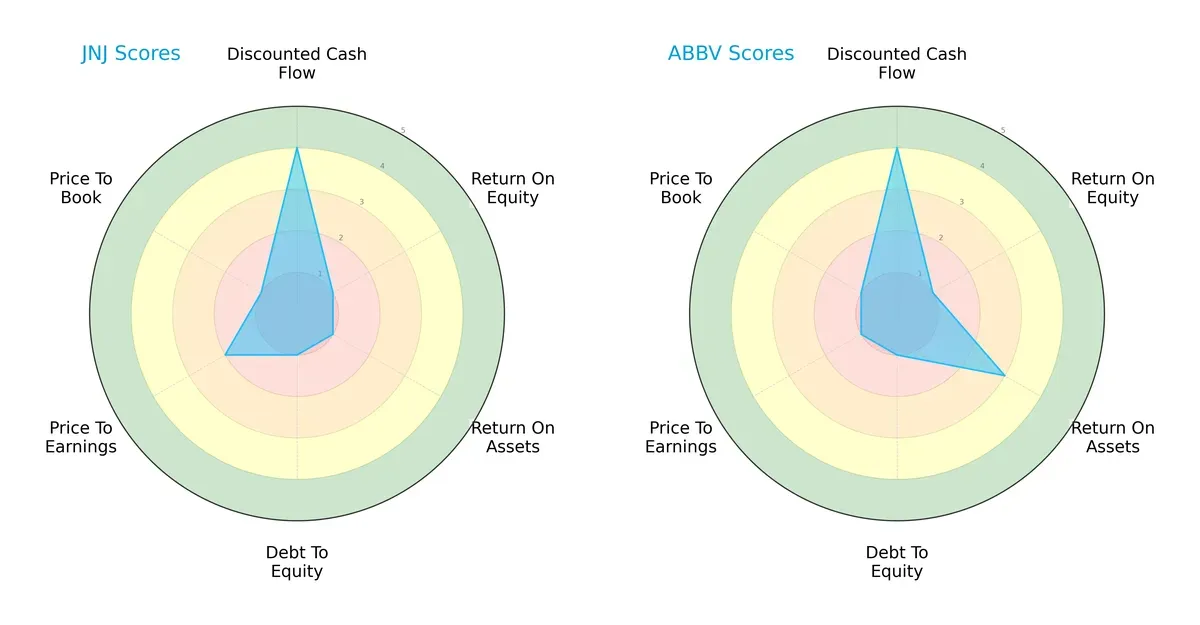
Johnson & Johnson and AbbVie share a favorable DCF score of 4, indicating similar valuation support from future cash flows. However, AbbVie outperforms J&J in return on assets (3 vs. 1), signaling better asset efficiency. Both struggle with debt-to-equity and price-to-book ratios, scoring low on financial leverage and valuation metrics. J&J’s profile appears less balanced due to very unfavorable ROE and ROA scores, while AbbVie relies more on asset returns to sustain its edge.
Bankruptcy Risk: Solvency Showdown
Johnson & Johnson’s Altman Z-Score of 5.14 places it firmly in the safe zone, while AbbVie’s 2.02 lands in the grey zone. This gap implies:
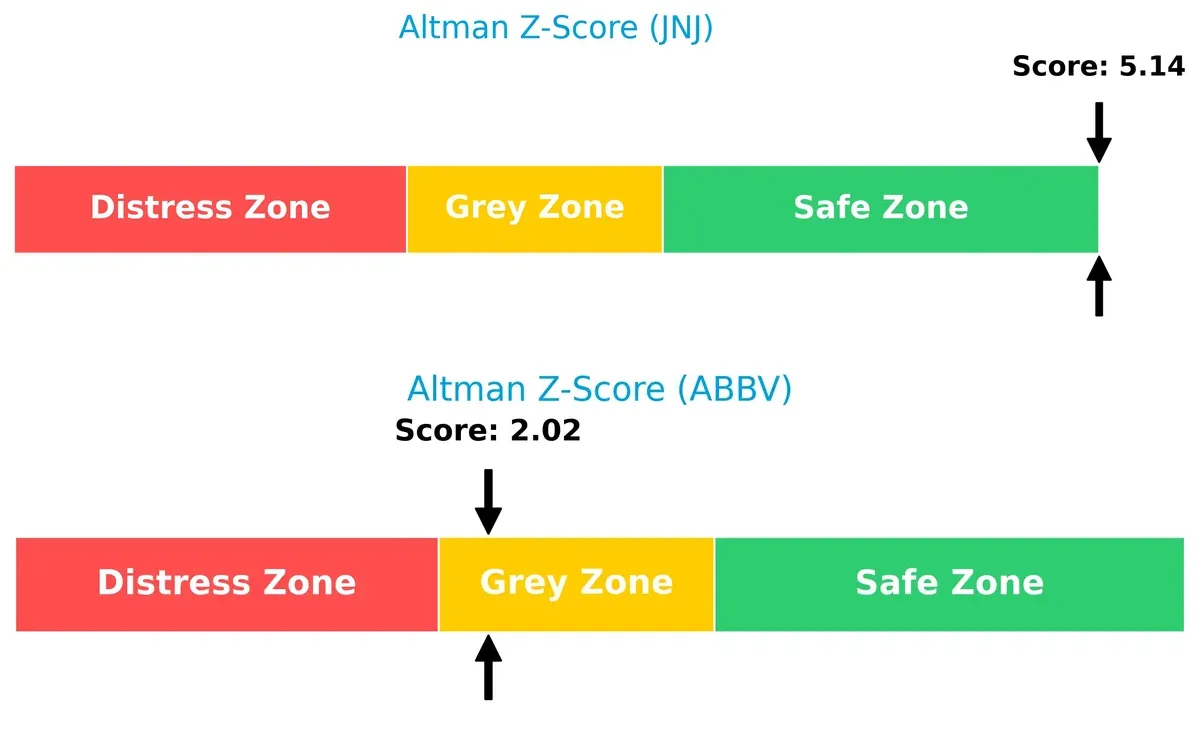
J&J exhibits a stronger buffer against financial distress, reinforcing its long-term survival potential. AbbVie faces moderate bankruptcy risk, requiring caution amid economic downturns.
Financial Health: Quality of Operations
Piotroski F-Scores rate J&J at 4 and AbbVie at 6, both in the average range, but with a clear differentiation:
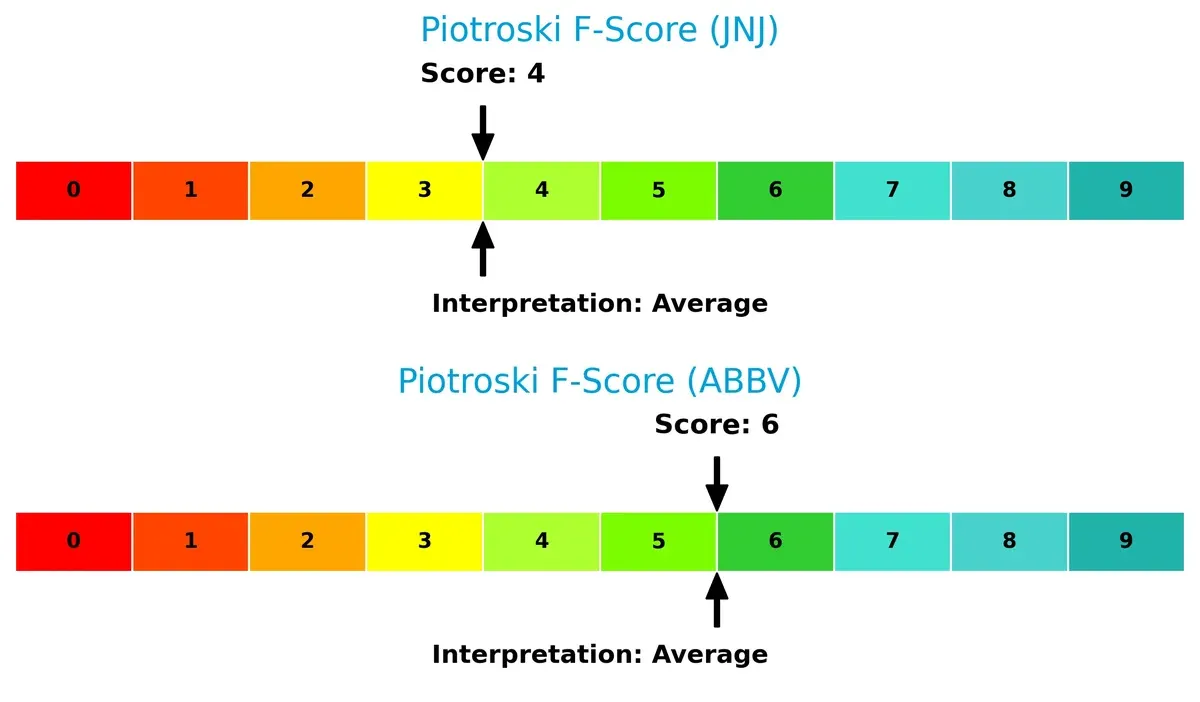
AbbVie shows healthier internal fundamentals and operational quality. J&J’s lower score signals some red flags in profitability or efficiency metrics. Investors should weigh AbbVie’s stronger operational health against J&J’s superior solvency profile.
How are the two companies positioned?
This section dissects the operational DNA of JNJ and ABBV by comparing their revenue distribution by segment and analyzing their internal strengths and weaknesses. The goal is to confront their economic moats to identify which business model offers the most resilient, sustainable competitive advantage in today’s market landscape.
Revenue Segmentation: The Strategic Mix
This visual comparison dissects how Johnson & Johnson and AbbVie diversify their income streams and where their primary sector bets lie:
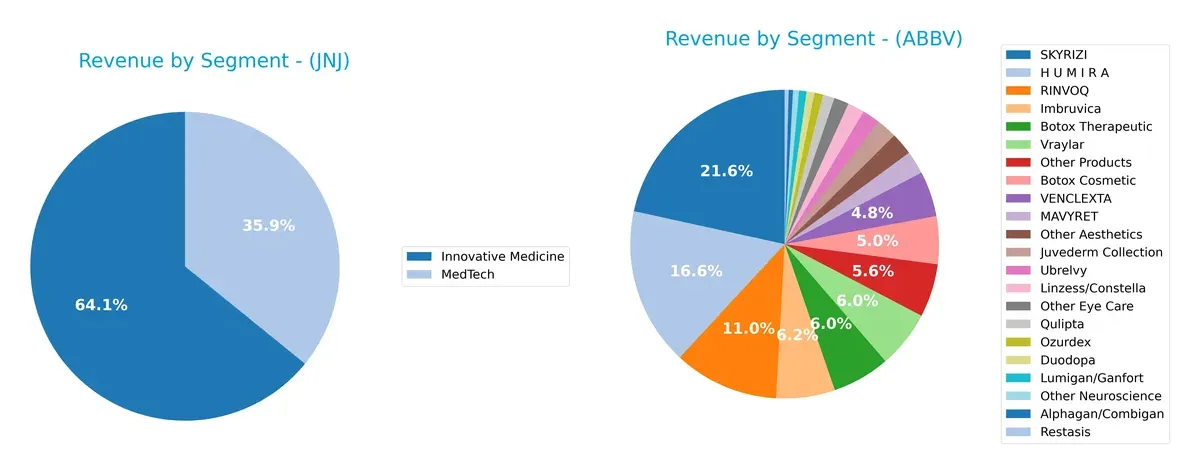
I observe Johnson & Johnson anchors its revenue in two broad segments: Innovative Medicine at $57B and MedTech at $32B, showing a balanced, diversified portfolio. AbbVie dwarfs with heavy reliance on a few blockbuster drugs like HUMIRA at $9B and SKYRIZI at $11.7B, indicating concentration risk but strong ecosystem lock-in. J&J’s mix suggests infrastructure dominance, while AbbVie pivots aggressively on specialty pharmaceuticals.
Strengths and Weaknesses Comparison
This table compares the strengths and weaknesses of Johnson & Johnson and AbbVie Inc.:
Johnson & Johnson Strengths
- Broad product diversification across innovative medicine, MedTech, and consumer segments
- Strong global presence with significant revenues in US, Europe, Asia-Pacific
AbbVie Inc. Strengths
- High return on equity at 129% indicating efficient capital use
- Favorable weighted average cost of capital at 5.2%
- Strong fixed asset turnover showing operational efficiency
Johnson & Johnson Weaknesses
- Unfavorable returns on equity and invested capital, signaling weaker profitability
- Low liquidity ratios (current and quick ratios) pose short-term risk
- Asset turnover ratios unfavorable, indicating possible inefficiency
AbbVie Inc. Weaknesses
- High debt levels with debt-to-assets at 50% and unfavorable debt/equity ratio
- Expensive valuation with PE of 73.48 and PB of 94.54
- Lower net margin at 7.6% and weak liquidity ratios under 1.0
Johnson & Johnson’s strengths lie in its diversified product base and global footprint, but profitability metrics raise caution. AbbVie demonstrates robust capital returns and asset efficiency, yet faces risks from high leverage and stretched valuations. Both companies show distinct profiles requiring focused strategic management.
The Moat Duel: Analyzing Competitive Defensibility
A structural moat is the only lasting shield protecting long-term profits from relentless competitive erosion:
Johnson & Johnson: Innovation and Diversification Moat
Johnson & Johnson leverages intangible assets and innovation across pharmaceuticals and MedTech. Its financials show robust margin stability and strong profit growth. New treatments and device expansions in 2026 could deepen its competitive edge.
AbbVie Inc.: Focused Biopharma Moat
AbbVie’s moat centers on specialized pharmaceuticals with high switching costs, contrasting JNJ’s broader diversification. It sustains value creation with ROIC exceeding WACC, though margin pressures in 2025 highlight risks. Pipeline developments in immunology offer growth potential.
Innovation & Diversification vs. Specialty Focus
JNJ’s wider moat stems from diversified segments and innovation-driven growth. AbbVie’s moat is narrower but deeply entrenched in specialty drugs with high barriers to entry. I see Johnson & Johnson better positioned to defend market share amid evolving healthcare demands.
Which stock offers better returns?
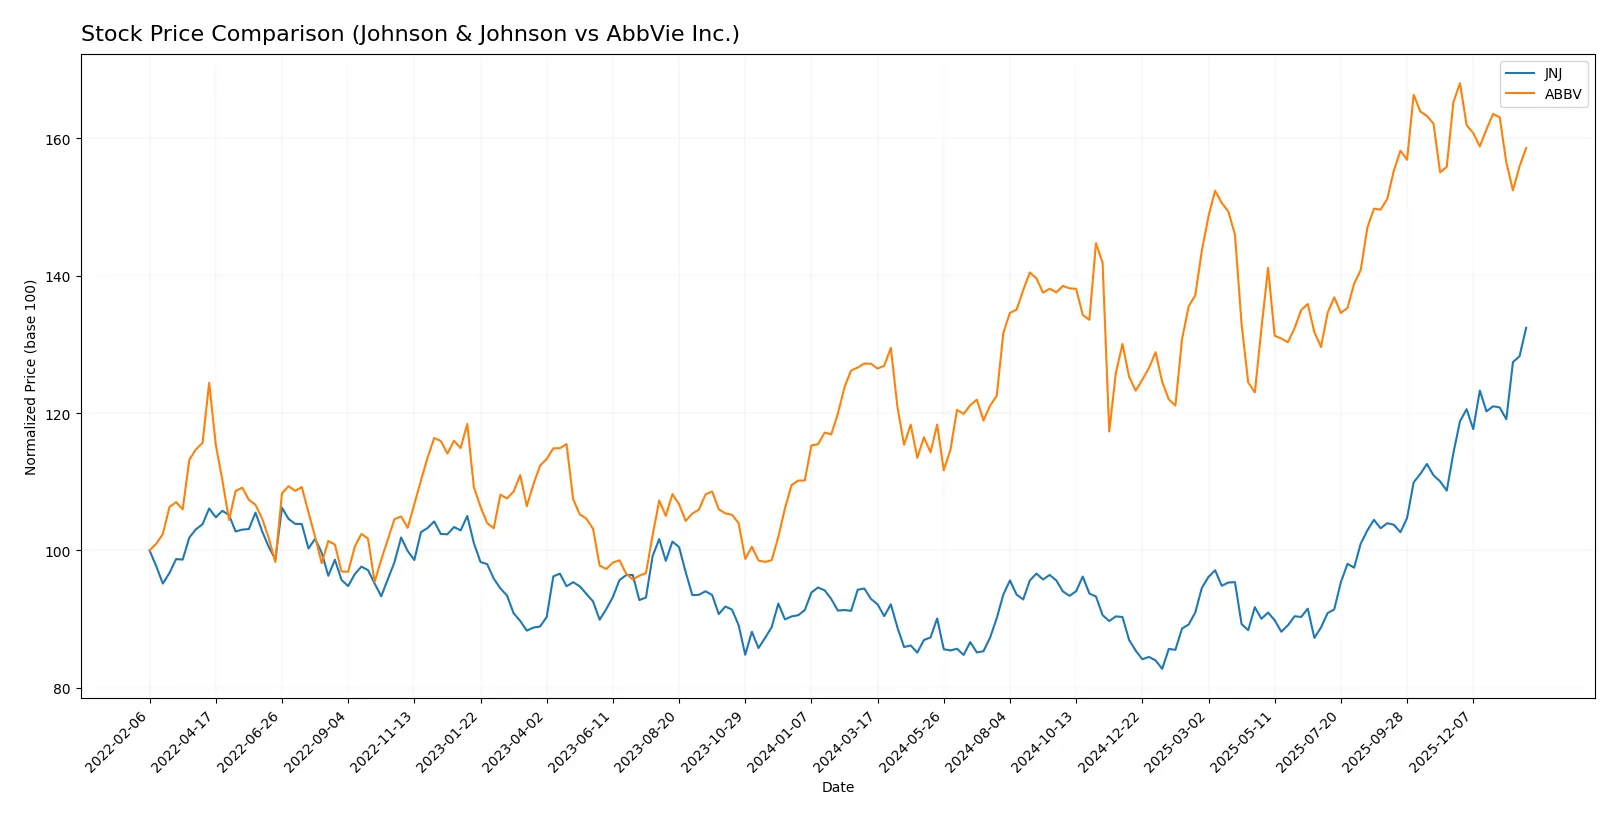
The past year shows strong price gains for both Johnson & Johnson and AbbVie Inc., with Johnson & Johnson exhibiting accelerating momentum while AbbVie shows some recent pullback.
Trend Comparison
Johnson & Johnson’s stock rose 42.46% over the past year, signaling a bullish trend with accelerating gains and a high standard deviation of 19.93%. Prices ranged from 142.06 to 227.25.
AbbVie’s stock gained 24.69% over the year, also bullish but with decelerating momentum. The recent period shows a -4.02% decline, indicating a short-term bearish shift.
Johnson & Johnson outperformed AbbVie significantly, delivering the highest market return with accelerating bullish momentum compared to AbbVie’s deceleration and recent weakness.
Target Prices
Analysts show a moderately bullish consensus for both Johnson & Johnson and AbbVie, suggesting upside potential from current levels.
| Company | Target Low | Target High | Consensus |
|---|---|---|---|
| Johnson & Johnson | 190 | 265 | 228.33 |
| AbbVie Inc. | 223 | 289 | 256.7 |
The consensus target for Johnson & Johnson sits slightly above its current price of 227.25, indicating modest upside. AbbVie’s target consensus of 256.7 surpasses its current 223.01 price, reflecting stronger analyst confidence in near-term growth.

Don’t Let Luck Decide Your Entry Point
Optimize your entry points with our advanced ProRealTime indicators. You’ll get efficient buy signals with precise price targets for maximum performance. Start outperforming now!
How do institutions grade them?
Johnson & Johnson Grades
The following table summarizes recent institutional grades for Johnson & Johnson:
| Grading Company | Action | New Grade | Date |
|---|---|---|---|
| Morgan Stanley | Upgrade | Overweight | 2026-01-28 |
| Freedom Capital Markets | Maintain | Hold | 2026-01-27 |
| Guggenheim | Maintain | Buy | 2026-01-23 |
| Stifel | Maintain | Hold | 2026-01-22 |
| B of A Securities | Maintain | Neutral | 2026-01-22 |
| Scotiabank | Maintain | Sector Outperform | 2026-01-22 |
| TD Cowen | Maintain | Buy | 2026-01-22 |
| Citigroup | Maintain | Buy | 2026-01-22 |
| Wells Fargo | Maintain | Overweight | 2026-01-22 |
| Morgan Stanley | Maintain | Equal Weight | 2026-01-22 |
AbbVie Inc. Grades
The following table summarizes recent institutional grades for AbbVie Inc.:
| Grading Company | Action | New Grade | Date |
|---|---|---|---|
| Citigroup | Maintain | Neutral | 2026-01-27 |
| Wolfe Research | Downgrade | Peer Perform | 2026-01-08 |
| Morgan Stanley | Maintain | Overweight | 2025-12-12 |
| HSBC | Upgrade | Buy | 2025-12-10 |
| UBS | Maintain | Neutral | 2025-11-07 |
| Piper Sandler | Maintain | Overweight | 2025-11-05 |
| JP Morgan | Maintain | Overweight | 2025-11-03 |
| Citigroup | Maintain | Neutral | 2025-11-03 |
| Guggenheim | Maintain | Buy | 2025-10-20 |
| Raymond James | Maintain | Outperform | 2025-10-17 |
Which company has the best grades?
Johnson & Johnson consistently earns Buy and Overweight grades from top firms, including a recent upgrade by Morgan Stanley. AbbVie shows mixed ratings, including a downgrade to Peer Perform. Investors may view Johnson & Johnson’s stronger grades as a signal of greater confidence and potential stability.
Risks specific to each company
The following categories identify the critical pressure points and systemic threats facing both firms in the 2026 market environment:
1. Market & Competition
Johnson & Johnson
- Faces intense competition in innovative medicine and MedTech segments, with pressure to sustain R&D leadership.
AbbVie Inc.
- Competes heavily in pharmaceuticals, particularly biologics, with risks from biosimilars and patent cliffs.
2. Capital Structure & Debt
Johnson & Johnson
- Strong balance sheet with favorable debt metrics and infinite interest coverage signals financial stability.
AbbVie Inc.
- Higher leverage with debt-to-assets at 50.19% and lower interest coverage increases refinancing and solvency risk.
3. Stock Volatility
Johnson & Johnson
- Low beta of 0.333 indicates defensive stock behavior and lower market sensitivity.
AbbVie Inc.
- Slightly higher beta of 0.35 suggests marginally more volatility but still relatively stable versus market averages.
4. Regulatory & Legal
Johnson & Johnson
- Exposure to complex regulatory environment in drug approvals and ongoing litigation risks from historical product liabilities.
AbbVie Inc.
- Faces similar regulatory hurdles plus risks linked to biosimilar competition and patent litigation.
5. Supply Chain & Operations
Johnson & Johnson
- Complex global supply chain with some operational risks but benefits from scale and diversification.
AbbVie Inc.
- Dependency on biologics manufacturing creates operational vulnerability, particularly in specialized supply lines.
6. ESG & Climate Transition
Johnson & Johnson
- Increasing ESG compliance costs but benefits from established sustainability programs and strong governance.
AbbVie Inc.
- ESG challenges persist amid evolving regulations, with moderate progress in climate initiatives.
7. Geopolitical Exposure
Johnson & Johnson
- Global footprint exposes it to geopolitical tensions and trade uncertainties, but diversified markets mitigate risks.
AbbVie Inc.
- Similar global exposure, with risk heightened by concentration in certain pharmaceutical markets sensitive to regulatory changes.
Which company shows a better risk-adjusted profile?
Johnson & Johnson’s strongest risk lies in maintaining innovation leadership amid fierce competition, while AbbVie’s capital structure and elevated debt pose significant financial risks. JNJ’s robust balance sheet and lower leverage offer a better risk-adjusted profile. AbbVie’s higher debt-to-assets ratio of 50.19% and moderate interest coverage at 2.32 highlight its vulnerability, justifying cautious scrutiny despite solid profitability.
Final Verdict: Which stock to choose?
Johnson & Johnson’s superpower lies in its consistent profitability and robust income growth, underpinned by a resilient business model. Its main point of vigilance is the unclear trajectory in capital efficiency, which could pressure future returns. It fits well in portfolios aiming for steady, long-term growth with moderate risk.
AbbVie commands a strategic moat through its strong return on equity and value creation above its capital costs, signaling effective capital deployment. Despite a heavier debt load and higher valuation multiples, it offers relatively greater income security and dividend yield, suiting income-focused or GARP-style portfolios seeking stability with growth potential.
If you prioritize steady income and a proven track record of operational strength, Johnson & Johnson is the compelling choice due to its superior income growth and market resilience. However, if you seek value creation coupled with a robust economic moat and can tolerate elevated leverage, AbbVie offers better stability and compelling dividend yield, albeit at a premium. Both require cautious monitoring of their respective financial risks.
Disclaimer: Investment carries a risk of loss of initial capital. The past performance is not a reliable indicator of future results. Be sure to understand risks before making an investment decision.
Go Further
I encourage you to read the complete analyses of Johnson & Johnson and AbbVie Inc. to enhance your investment decisions: