In the dynamic pharmaceutical industry, AbbVie Inc. and Gilead Sciences, Inc. stand out as leading innovators with strong market presences. Both companies focus on developing breakthrough treatments across various therapeutic areas, including autoimmune diseases and viral infections. Their competitive strategies and overlapping markets make them a compelling comparison. In this article, I will analyze which company presents the most attractive opportunity for investors seeking growth and stability.
Table of contents
Companies Overview
I will begin the comparison between AbbVie and Gilead Sciences by providing an overview of these two companies and their main differences.
AbbVie Overview
AbbVie Inc. is a global pharmaceutical company focused on discovering, developing, manufacturing, and selling innovative medicines. Its portfolio includes therapies for autoimmune diseases, oncology, hepatitis C, and eye care, among others. AbbVie operates in the healthcare sector with a market cap of approximately 389B USD and employs around 55,000 people, positioning itself as a major player in drug manufacturing.
Gilead Sciences Overview
Gilead Sciences, Inc. is a biopharmaceutical company specializing in medicines addressing unmet medical needs internationally. Its products primarily target HIV/AIDS, liver diseases, oncology, and pulmonary conditions. With a market cap near 150B USD and a workforce of about 17,600 employees, Gilead maintains a strong presence in the healthcare industry, emphasizing innovative therapies and extensive collaboration agreements.
Key similarities and differences
Both AbbVie and Gilead operate in the drug manufacturing industry, focusing on developing treatments for serious diseases. While AbbVie offers a broader range of therapies including autoimmune and eye care products, Gilead concentrates more on antiviral and oncology drugs. AbbVie is significantly larger by market cap and employee count, whereas Gilead has a stronger emphasis on biopharmaceutical collaborations and specialized treatments.
Income Statement Comparison
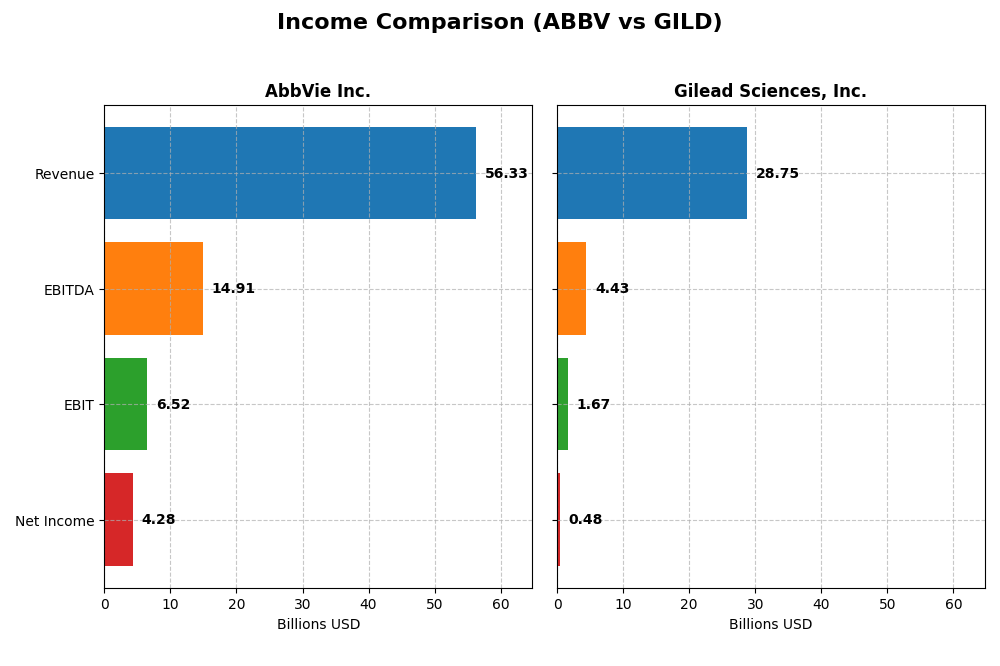
The table below compares key income statement metrics for AbbVie Inc. and Gilead Sciences, Inc. based on their most recent fiscal year data.
| Metric | AbbVie Inc. (ABBV) | Gilead Sciences, Inc. (GILD) |
|---|---|---|
| Market Cap | 389B | 150B |
| Revenue | 56.3B | 28.8B |
| EBITDA | 14.9B | 4.43B |
| EBIT | 6.52B | 1.67B |
| Net Income | 4.28B | 480M |
| EPS | 2.40 | 0.38 |
| Fiscal Year | 2024 | 2024 |
Income Statement Interpretations
AbbVie Inc.
AbbVie’s revenue showed a moderate increase of 3.7% in 2024, continuing a 22.99% growth over five years, while net income declined by 7.3% over the same period. Margins remain strong, with a gross margin near 70%, but EBIT and net margins contracted, reflecting a 23% drop in EBIT and a 15% fall in net margin in 2024. The recent year saw pressure on profitability despite stable revenue.
Gilead Sciences, Inc.
Gilead recorded a 6% revenue rise in 2024, building on a 16.5% increase since 2020. Net income surged dramatically by 290% over five years, although it fell sharply in 2024. Gross margin is notably higher than AbbVie’s at 78%, but EBIT margin is lower and stable. The latest year showed significant net margin and EPS declines, highlighting volatility after growth.
Which one has the stronger fundamentals?
Gilead exhibits more favorable overall income statement growth and margin expansion, particularly in net income and EPS over the long term. AbbVie maintains higher absolute margins but faces declining profitability and EPS. Despite Gilead’s recent setbacks, its income statement evaluation is globally favorable, contrasting with AbbVie’s unfavorable trend, suggesting stronger fundamentals for Gilead based on the provided metrics.
Financial Ratios Comparison
The table below compares key financial ratios for AbbVie Inc. and Gilead Sciences, Inc. based on their most recent fiscal year (2024) data to provide a clear overview of their financial performance and health.
| Ratios | AbbVie Inc. (ABBV) | Gilead Sciences, Inc. (GILD) |
|---|---|---|
| ROE | 128.7% | 2.48% |
| ROIC | 10.2% | 2.36% |
| P/E | 73.5 | 240.0 |
| P/B | 94.5 | 6.0 |
| Current Ratio | 0.66 | 1.60 |
| Quick Ratio | 0.55 | 1.45 |
| D/E (Debt-to-Equity) | 20.40 | 1.38 |
| Debt-to-Assets | 50.2% | 45.3% |
| Interest Coverage | 3.25 | 1.70 |
| Asset Turnover | 0.42 | 0.49 |
| Fixed Asset Turnover | 10.97 | 5.31 |
| Payout Ratio | 257.7% | 816.3% |
| Dividend Yield | 3.51% | 3.40% |
Interpretation of the Ratios
AbbVie Inc.
AbbVie shows a mix of strong and weak ratios for 2024, with favorable returns on equity (128.66%) and invested capital (10.21%), alongside a low weighted average cost of capital (5.16%). However, concerns arise with a low current ratio (0.66), high debt levels, and unfavorable valuation multiples (PE 73.48, PB 94.54). Dividend yield is solid at 3.51%, supported by stable payouts and moderate risks related to its leverage.
Gilead Sciences, Inc.
Gilead’s 2024 ratios reflect challenges, including weak profitability indicators like a low net margin (1.67%) and return on equity (2.48%). While liquidity ratios are favorable (current ratio 1.6, quick ratio 1.45), its valuation multiples are high and unfavorable (PE 239.97, PB 5.96). The dividend yield is comparable at 3.4%, but coverage concerns exist due to lower earnings and interest coverage below 2.
Which one has the best ratios?
AbbVie demonstrates stronger profitability and capital returns compared to Gilead, despite some liquidity and leverage weaknesses. Gilead benefits from better liquidity but suffers from weaker profitability and higher valuation multiples. Overall, AbbVie’s ratios appear slightly more favorable, while Gilead’s present a generally unfavorable profile for 2024.
Strategic Positioning
This section compares the strategic positioning of AbbVie and Gilead Sciences, including market position, key segments, and exposure to technological disruption:
AbbVie Inc.
- Leading market position with lower beta, facing general competition in drug manufacturing.
- Diversified portfolio including autoimmune, oncology, aesthetics, neuroscience, and eye care products.
- Moderate exposure with ongoing research collaborations but no explicit disruption threats noted.
Gilead Sciences, Inc.
- Smaller market cap, also in drug manufacturing, with similar beta and competitive pressure.
- Concentrated focus on antiviral therapies, HIV/AIDS, liver diseases, and expanding cell therapy.
- Exposure to innovation through collaborations in cell therapy and immuno-oncology fields.
AbbVie Inc. vs Gilead Sciences, Inc. Positioning
AbbVie adopts a diversified strategy across multiple therapeutic areas, mitigating reliance on one segment, while Gilead concentrates on antiviral and cell therapy products, focusing resources on specialized markets. AbbVie’s broad portfolio offers risk distribution; Gilead’s focus may enable deeper innovation in core areas.
Which has the best competitive advantage?
AbbVie shows a slightly favorable moat with value creation despite declining profitability, indicating a more stable competitive advantage. Gilead’s moat is slightly unfavorable, shedding value but improving profitability, suggesting a less secure competitive position currently.
Stock Comparison
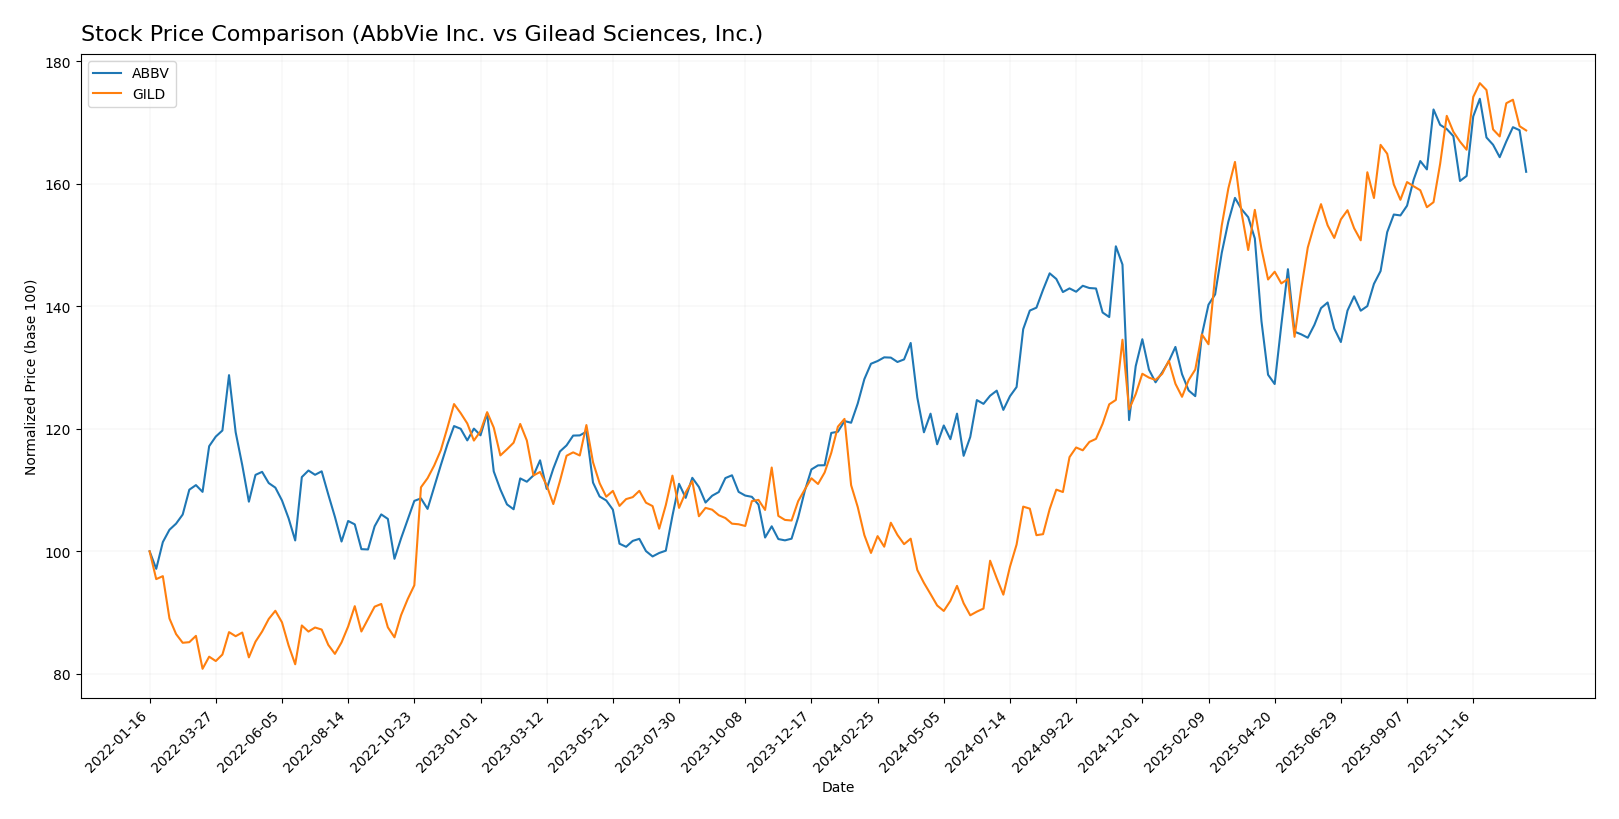
The stock price movements of AbbVie Inc. and Gilead Sciences, Inc. over the past year reveal strong bullish trends with decelerating momentum, highlighted by significant gains and distinct trading volume dynamics.
Trend Analysis
AbbVie Inc. showed a 24.0% price increase over the past 12 months, indicating a bullish trend with deceleration. The stock peaked at 236.28 and bottomed at 157.06, with recent slight downward movement.
Gilead Sciences, Inc. delivered a 69.18% price increase over the past 12 months, reflecting a bullish trend with deceleration. Its highest price reached 126.64 and lowest was 64.27, with recent price stability.
Comparing the two, Gilead Sciences outperformed AbbVie in market performance over the last year, showing a higher percentage gain despite both stocks experiencing deceleration in their upward trends.
Target Prices
The current analyst consensus for target prices suggests moderate upside potential for both AbbVie Inc. and Gilead Sciences, Inc.
| Company | Target High | Target Low | Consensus |
|---|---|---|---|
| AbbVie Inc. | 289 | 240 | 258.71 |
| Gilead Sciences, Inc. | 151 | 105 | 133.64 |
Analysts expect AbbVie’s stock price to rise from its current 220.08 USD to a consensus near 259 USD, indicating potential growth. Gilead’s consensus target at 133.64 USD also implies a positive outlook compared to its current price of 121.10 USD.
Analyst Opinions Comparison
This section compares analysts’ ratings and grades for AbbVie Inc. and Gilead Sciences, Inc.:
Rating Comparison
AbbVie Inc. Rating
- Rating: C+, assessed as Very Favorable overall.
- Discounted Cash Flow Score: 5, Very Favorable.
- ROE Score: 1, Very Unfavorable.
- ROA Score: 3, Moderate.
- Debt To Equity Score: 1, Very Unfavorable.
- Overall Score: 2, Moderate.
Gilead Sciences, Inc. Rating
- Rating: A-, assessed as Very Favorable overall.
- Discounted Cash Flow Score: 5, Very Favorable.
- ROE Score: 5, Very Favorable.
- ROA Score: 5, Very Favorable.
- Debt To Equity Score: 1, Very Unfavorable.
- Overall Score: 4, Favorable.
Which one is the best rated?
Based strictly on provided data, Gilead Sciences, Inc. holds a better rating overall with an A- compared to AbbVie’s C+. Gilead scores higher on ROE, ROA, and overall metrics. Both share very unfavorable debt to equity scores.
Scores Comparison
Here is a comparison of the financial health scores for AbbVie Inc. and Gilead Sciences, Inc.:
AbbVie Inc. Scores
- Altman Z-Score: 2.07, in grey zone indicating moderate bankruptcy risk.
- Piotroski Score: 7, classified as strong financial health.
Gilead Sciences, Inc. Scores
- Altman Z-Score: 4.01, in safe zone indicating low bankruptcy risk.
- Piotroski Score: 8, classified as very strong financial health.
Which company has the best scores?
Gilead Sciences, Inc. shows stronger financial health with a higher Altman Z-Score in the safe zone and a superior Piotroski Score classified as very strong, compared to AbbVie’s moderate and strong ratings respectively.
Grades Comparison
The following is a comparison of recent grades and ratings for AbbVie Inc. and Gilead Sciences, Inc.:
AbbVie Inc. Grades
This table summarizes recent grades and rating actions assigned to AbbVie by reputable grading companies.
| Grading Company | Action | New Grade | Date |
|---|---|---|---|
| Wolfe Research | Downgrade | Peer Perform | 2026-01-08 |
| Morgan Stanley | Maintain | Overweight | 2025-12-12 |
| HSBC | Upgrade | Buy | 2025-12-10 |
| UBS | Maintain | Neutral | 2025-11-07 |
| Piper Sandler | Maintain | Overweight | 2025-11-05 |
| Citigroup | Maintain | Neutral | 2025-11-03 |
| JP Morgan | Maintain | Overweight | 2025-11-03 |
| Guggenheim | Maintain | Buy | 2025-10-20 |
| Raymond James | Maintain | Outperform | 2025-10-17 |
| Piper Sandler | Maintain | Overweight | 2025-10-10 |
AbbVie’s grades show a generally positive trend with multiple overweight and buy ratings, though a recent downgrade to peer perform indicates some caution.
Gilead Sciences, Inc. Grades
The following table presents recent grading actions for Gilead Sciences by established grading firms.
| Grading Company | Action | New Grade | Date |
|---|---|---|---|
| Citigroup | Maintain | Buy | 2026-01-07 |
| Morgan Stanley | Maintain | Overweight | 2025-12-12 |
| Wells Fargo | Maintain | Overweight | 2025-12-10 |
| Needham | Maintain | Buy | 2025-11-13 |
| Truist Securities | Maintain | Buy | 2025-11-03 |
| Cantor Fitzgerald | Maintain | Overweight | 2025-10-31 |
| Needham | Maintain | Buy | 2025-10-31 |
| RBC Capital | Maintain | Sector Perform | 2025-10-31 |
| JP Morgan | Maintain | Overweight | 2025-10-31 |
| Wells Fargo | Maintain | Overweight | 2025-10-31 |
Gilead’s grades consistently reflect positive sentiment, with multiple buy and overweight ratings maintained recently.
Which company has the best grades?
Both AbbVie and Gilead hold a “Buy” consensus, but Gilead has a higher number of buy and overweight ratings consistently maintained, indicating stronger analyst conviction. This may imply a more favorable outlook for Gilead among analysts, potentially impacting investor sentiment and portfolio positioning accordingly.
Strengths and Weaknesses
Below is a comparative table highlighting the key strengths and weaknesses of AbbVie Inc. (ABBV) and Gilead Sciences, Inc. (GILD) based on recent financial and operational data.
| Criterion | AbbVie Inc. (ABBV) | Gilead Sciences, Inc. (GILD) |
|---|---|---|
| Diversification | Highly diversified product portfolio across aesthetics, neuroscience, immunology, and virology; top products include SKYRIZI (12B), HUMIRA (9B), RINVOQ (6B) | Moderate diversification focused on antiviral and cell therapy products; major revenue from HIV products (~19.6B) and growing cell therapy sales (2.4B) |
| Profitability | Strong ROIC at 10.2% with value creation (ROIC > WACC); net margin neutral at 7.6%; however, declining ROIC trend | Lower ROIC at 2.4% below WACC, indicating value destruction; net margin weak at 1.7%; improving ROIC trend but still unfavorable overall |
| Innovation | Solid innovation pipeline with growth in aesthetics and neuroscience; fixed asset turnover favorable | Innovation in cell therapy showing rapid growth; however, high P/E (240) suggests market expectations are high and profitability is low |
| Global presence | Strong global reach supported by multiple blockbuster drugs and diversified markets | Global presence focused on infectious diseases; increasing presence in oncology and cell therapy markets |
| Market Share | Leading positions in immunology and aesthetics with blockbuster drugs like HUMIRA and SKYRIZI | Leader in HIV treatment with dominant market share; expanding in cell therapy and oncology |
Key takeaways: AbbVie demonstrates strong value creation and diversification with some profitability headwinds due to declining ROIC. Gilead struggles with profitability but shows promising growth in innovative therapies, especially cell therapy, though it remains a riskier investment due to value destruction.
Risk Analysis
Below is a comparative table highlighting key risks for AbbVie Inc. (ABBV) and Gilead Sciences, Inc. (GILD) based on the latest 2024 data.
| Metric | AbbVie Inc. (ABBV) | Gilead Sciences, Inc. (GILD) |
|---|---|---|
| Market Risk | Low beta (0.35) indicating lower volatility | Low beta (0.349), similarly low volatility |
| Debt level | High debt-to-equity ratio (20.4), debt to assets 50.19% (unfavorable) | Moderate debt-to-equity (1.38), debt to assets 45.28% (neutral) |
| Regulatory Risk | High due to pharma industry, patent expirations | High due to pharma regulations and competition |
| Operational Risk | Medium, large employee base (55K), complex pipeline | Medium, smaller workforce (17.6K) but broad portfolio |
| Environmental Risk | Moderate, pharma manufacturing impact | Moderate, similar industry concerns |
| Geopolitical Risk | Moderate, global supply chain exposure | Moderate, global operations but US-centric |
AbbVie faces significant financial risk due to its high leverage and unfavorable liquidity ratios, though its stable market volatility is a mitigating factor. Gilead shows better liquidity but also struggles with profitability and unfavorable valuation metrics. Regulatory and patent risks remain the most impactful for both, given the volatile pharmaceutical landscape in 2026.
Which Stock to Choose?
AbbVie Inc. shows a mixed income evolution with favorable gross and EBIT margins but a declining net margin over five years. Its financial ratios indicate strong profitability metrics like ROE and ROIC, though offset by unfavorable leverage and liquidity ratios. The company’s rating is very favorable overall, despite some weak points in valuation and debt metrics.
Gilead Sciences, Inc. exhibits favorable income growth and improving profitability over the longer term, with a higher gross margin but neutral net margin. Financial ratios reveal generally unfavorable profitability and valuation metrics, balanced by strong liquidity ratios. The company holds a very favorable rating with higher scores on profitability and asset utilization compared to AbbVie.
For investors, AbbVie might appear suitable for those valuing strong profitability and dividend yield despite leverage concerns, while Gilead could be seen as more favorable for those prioritizing income growth and financial stability. The ratings and income evaluations suggest a nuanced interpretation depending on risk tolerance and investment focus.
Disclaimer: Investment carries a risk of loss of initial capital. The past performance is not a reliable indicator of future results. Be sure to understand risks before making an investment decision.
Go Further
I encourage you to read the complete analyses of AbbVie Inc. and Gilead Sciences, Inc. to enhance your investment decisions: