Eli Lilly and Company (LLY) and AbbVie Inc. (ABBV) are two leading giants in the pharmaceutical industry, both specializing in developing innovative drugs and therapies that address critical health conditions worldwide. These companies compete closely in overlapping markets such as autoimmune diseases, oncology, and diabetes, driving strong innovation strategies to maintain their competitive edge. In this article, I will analyze their strengths and risks to help you decide which company holds the most compelling investment opportunity today.
Table of contents
Companies Overview
I will begin the comparison between Eli Lilly and Company and AbbVie Inc. by providing an overview of these two companies and their main differences.
Eli Lilly and Company Overview
Eli Lilly and Company is a US-based pharmaceutical firm focused on discovering, developing, and marketing human pharmaceuticals globally. Founded in 1876 and headquartered in Indianapolis, Indiana, it offers treatments for diabetes, cancer, autoimmune diseases, and other conditions. The company holds a significant market position with a market cap of approximately 955B USD and employs around 47,000 people.
AbbVie Inc. Overview
AbbVie Inc., incorporated in 2012 and headquartered in North Chicago, Illinois, is a global pharmaceutical company specializing in therapies for autoimmune diseases, cancer, and other conditions. With a market cap near 389B USD and a workforce of about 55,000 employees, AbbVie develops and markets a diverse portfolio including HUMIRA, SKYRIZI, and Botox therapeutic, serving a worldwide market.
Key similarities and differences
Both companies operate in the healthcare sector as drug manufacturers with a focus on innovative pharmaceutical treatments. While Eli Lilly has a longer history and larger market cap, AbbVie has a broader product range targeting autoimmune and specialty diseases. Each maintains extensive research collaborations and global reach, but they differ in scale and specific therapeutic focus areas within their business models.
Income Statement Comparison
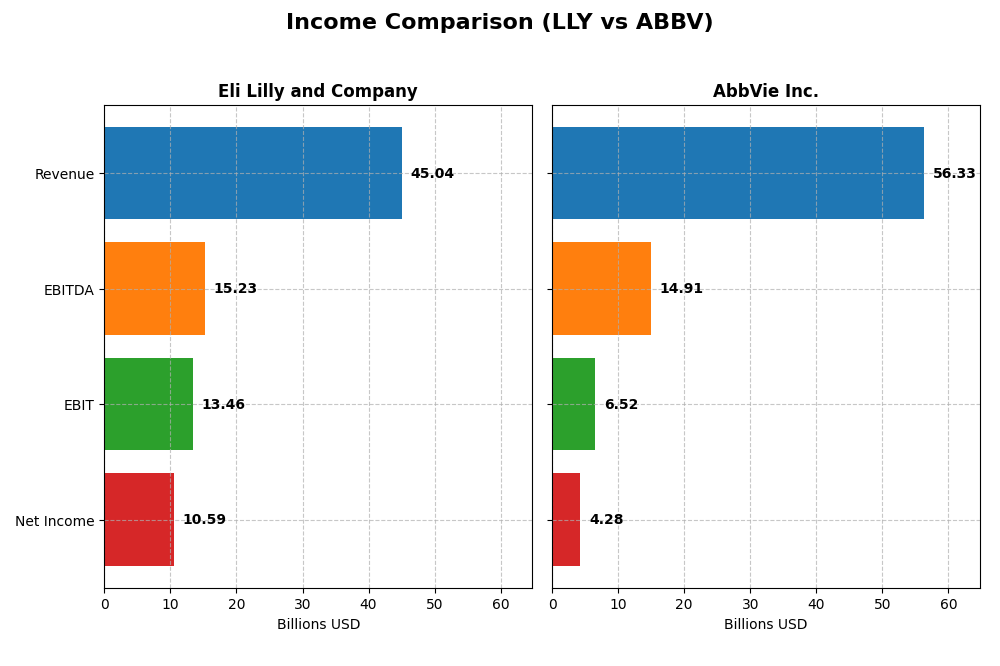
This table presents a side-by-side comparison of key income statement metrics for Eli Lilly and Company and AbbVie Inc. for the fiscal year 2024.
| Metric | Eli Lilly and Company | AbbVie Inc. |
|---|---|---|
| Market Cap | 955B | 389B |
| Revenue | 45.0B | 56.3B |
| EBITDA | 15.2B | 14.9B |
| EBIT | 13.5B | 6.5B |
| Net Income | 10.6B | 4.3B |
| EPS | 11.76 | 2.40 |
| Fiscal Year | 2024 | 2024 |
Income Statement Interpretations
Eli Lilly and Company
Eli Lilly showed strong growth from 2020 to 2024, with revenue increasing by 83.6% and net income rising 71.0%. Margins were mostly stable, with a high gross margin of 81.3% and net margin at 23.5%, though net margin slightly declined overall. In 2024, revenue surged 32% and net margin improved 53.1%, reflecting robust profitability and operational efficiency.
AbbVie Inc.
AbbVie experienced moderate revenue growth of 23.0% over the period but faced a 7.3% decline in net income. Margins contracted, with a gross margin of 70.0% and a notably lower net margin of 7.6%. The latest year showed weak performance, with revenue growth slowing to 3.7% and declines in EBIT (-23.0%), net margin (-15.2%), and EPS (-12.1%), indicating margin pressure and profitability challenges.
Which one has the stronger fundamentals?
Eli Lilly’s income statement is characterized by strong revenue and net income growth, favorable margins, and significant improvement in 2024 profitability metrics. In contrast, AbbVie shows slower growth, declining net income, and margin contraction, with recent negative trends in key profitability indicators. Based on these income statement factors, Eli Lilly demonstrates stronger fundamentals.
Financial Ratios Comparison
The table below presents the most recent financial ratios for Eli Lilly and Company (LLY) and AbbVie Inc. (ABBV) based on their fiscal year 2024 data, allowing a clear side-by-side comparison of key financial metrics.
| Ratios | Eli Lilly and Company (LLY) | AbbVie Inc. (ABBV) |
|---|---|---|
| ROE | 74.62% | 128.66% |
| ROIC | 26.36% | 10.21% |
| P/E | 65.65 | 73.48 |
| P/B | 48.99 | 94.54 |
| Current Ratio | 1.15 | 0.66 |
| Quick Ratio | 0.89 | 0.55 |
| D/E (Debt-to-Equity) | 2.37 | 20.40 |
| Debt-to-Assets | 42.74% | 50.19% |
| Interest Coverage | 22.42 | 3.25 |
| Asset Turnover | 0.57 | 0.42 |
| Fixed Asset Turnover | 2.63 | 10.97 |
| Payout Ratio | 44.20% | 257.71% |
| Dividend Yield | 0.67% | 3.51% |
Interpretation of the Ratios
Eli Lilly and Company
Eli Lilly shows strong profitability with favorable net margin (23.51%), ROE (74.62%), and ROIC (26.36%), supported by a low WACC (5.32%). However, high valuation multiples (PE 65.65, PB 48.99) and leverage (DE 2.37) are concerning. The current and quick ratios are neutral, indicating average liquidity. Dividend yield is low at 0.67%, reflecting modest shareholder returns.
AbbVie Inc.
AbbVie has mixed ratios with favorable ROE (128.66%) and ROIC (10.21%) but weaker profitability (net margin 7.59%) and liquidity (current ratio 0.66, quick ratio 0.55). High debt levels (DE 20.4, debt-to-assets 50.19%) and valuation multiples (PE 73.48, PB 94.54) are unfavorable. Dividend yield is strong at 3.51%, indicating solid income for shareholders despite some financial risks.
Which one has the best ratios?
Eli Lilly presents a more balanced and slightly favorable ratio profile, with stronger profitability and manageable risk metrics, though its valuation is high. AbbVie shows higher leverage and weaker liquidity, with a stronger dividend yield but more unfavorable ratios overall. Based on these factors, Eli Lilly’s ratios appear more robust in 2024.
Strategic Positioning
This section compares the strategic positioning of Eli Lilly and Company (LLY) and AbbVie Inc. (ABBV), focusing on market position, key segments, and exposure to technological disruption:
Eli Lilly and Company (LLY)
- Large market cap (955B USD) with moderate competitive pressure in general drug manufacturing.
- Diverse portfolio including diabetes, oncology, neuroscience, and immunology products with significant collaboration revenue.
- Exposure to technological disruption via ongoing collaborations with multiple biotech and pharma firms.
AbbVie Inc. (ABBV)
- Mid-size market cap (389B USD) in drug manufacturing facing steady competition.
- Broad product range including immunology, aesthetics, neuroscience, and eye care with strong flagship drugs.
- Engaged in research collaborations but no explicit mention of disruption focus.
Eli Lilly and Company vs AbbVie Inc. Positioning
LLY adopts a diversified approach across multiple therapeutic areas with notable collaboration revenues, enabling varied growth drivers. ABBV has a broad but more concentrated portfolio centered on key flagship drugs and aesthetics, balancing product depth with market focus.
Which has the best competitive advantage?
LLY demonstrates a very favorable economic moat with growing ROIC and strong value creation, indicating durable competitive advantage. ABBV, while creating value, shows a slightly favorable moat with declining ROIC, suggesting less durable profitability.
Stock Comparison
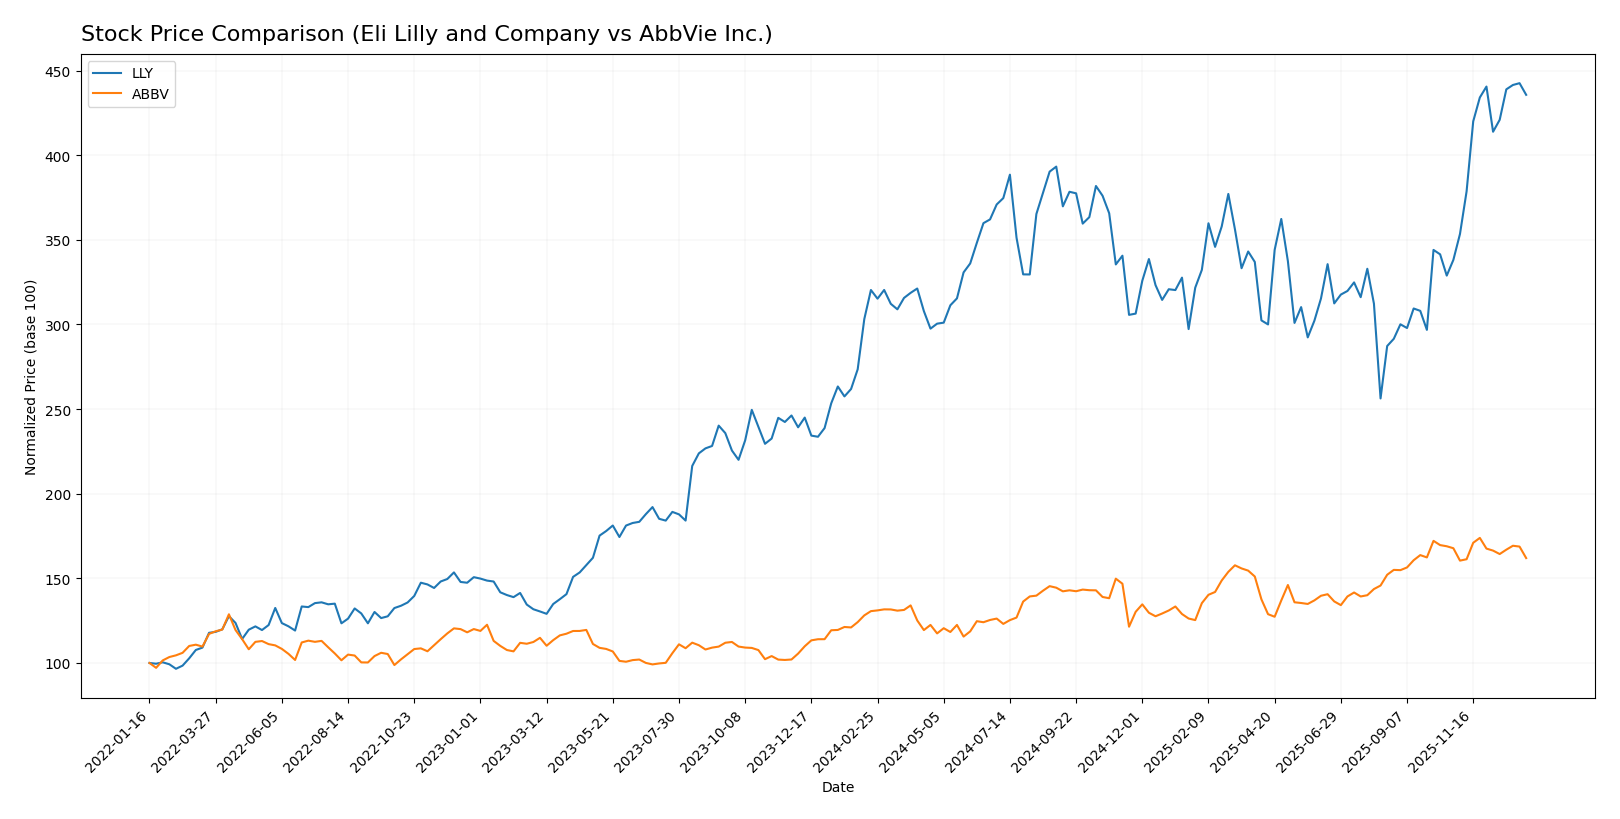
The stock prices of Eli Lilly and Company and AbbVie Inc. have shown significant movements over the past 12 months, with distinct bullish trends and differing acceleration patterns shaping their trading dynamics.
Trend Analysis
Eli Lilly and Company’s stock demonstrated a strong bullish trend over the past year with a 35.99% increase, accompanied by acceleration and high volatility, reaching a peak price of 1080.36. AbbVie Inc.’s stock also followed a bullish trend with a 24.0% gain over the same period but showed deceleration and lower volatility, hitting a high of 236.28. Comparing both, Eli Lilly delivered the highest market performance, outperforming AbbVie in price appreciation and recent trend acceleration.
Target Prices
Analysts provide a positive consensus on target prices for Eli Lilly and Company and AbbVie Inc.
| Company | Target High | Target Low | Consensus |
|---|---|---|---|
| Eli Lilly and Company | 1300 | 830 | 1151.07 |
| AbbVie Inc. | 289 | 240 | 258.71 |
The consensus targets suggest upside potential for both stocks compared to current prices: Eli Lilly’s stock at 1063.56 USD versus a 1151.07 USD consensus, and AbbVie’s stock at 220.08 USD versus a 258.71 USD consensus. This indicates generally optimistic analyst expectations.
Analyst Opinions Comparison
This section compares analysts’ ratings and grades for Eli Lilly and Company (LLY) and AbbVie Inc. (ABBV):
Rating Comparison
LLY Rating
- Rating: B+ indicating a very favorable assessment of financial standing.
- Discounted Cash Flow Score: 4, showing a favorable outlook on future cash flows.
- ROE Score: 5, very favorable efficiency in generating profits from equity.
- ROA Score: 5, very favorable use of assets to generate earnings.
- Debt To Equity Score: 1, very unfavorable, reflecting high financial risk.
- Overall Score: 3, moderate overall financial standing.
ABBV Rating
- Rating: C+ also indicating a very favorable assessment of financial standing.
- Discounted Cash Flow Score: 5, very favorable, suggesting strong cash flow potential.
- ROE Score: 1, very unfavorable, indicating poor profit generation from equity.
- ROA Score: 3, moderate effectiveness in asset utilization.
- Debt To Equity Score: 1, very unfavorable, also indicating high financial risk.
- Overall Score: 2, moderate overall financial standing but lower than LLY.
Which one is the best rated?
Based strictly on the provided data, LLY is better rated overall, showing higher scores in ROE, ROA, and a stronger overall score. ABBV has a higher discounted cash flow score but lower profitability and asset use metrics.
Scores Comparison
Here is a comparison of the Altman Z-Score and Piotroski Score for both companies:
LLY Scores
- Altman Z-Score: 8.08, indicating a safe financial zone and low bankruptcy risk.
- Piotroski Score: 7, reflecting strong financial health and value potential.
ABBV Scores
- Altman Z-Score: 2.07, placing it in the grey zone with moderate bankruptcy risk.
- Piotroski Score: 7, also indicating strong financial health and value potential.
Which company has the best scores?
LLY has a clearly higher Altman Z-Score, indicating stronger financial stability, while both companies share the same strong Piotroski Score of 7. Based on this data, LLY shows a safer financial position.
Grades Comparison
Here is a comparison of the recent grades assigned to Eli Lilly and Company and AbbVie Inc.:
Eli Lilly and Company Grades
The following table shows recent grades for Eli Lilly and Company from recognized grading firms:
| Grading Company | Action | New Grade | Date |
|---|---|---|---|
| B of A Securities | Maintain | Buy | 2025-12-15 |
| Wells Fargo | Maintain | Overweight | 2025-12-10 |
| BMO Capital | Maintain | Outperform | 2025-12-04 |
| Guggenheim | Maintain | Buy | 2025-12-03 |
| Morgan Stanley | Maintain | Overweight | 2025-11-24 |
| Bernstein | Maintain | Outperform | 2025-11-24 |
| Truist Securities | Maintain | Buy | 2025-11-19 |
| JP Morgan | Maintain | Overweight | 2025-11-18 |
| Morgan Stanley | Maintain | Overweight | 2025-11-13 |
| Citigroup | Maintain | Buy | 2025-11-12 |
Grades for Eli Lilly show a consistent positive outlook, predominantly Buy, Overweight, and Outperform ratings without downgrades.
AbbVie Inc. Grades
The table below presents recent grades for AbbVie Inc. from established grading companies:
| Grading Company | Action | New Grade | Date |
|---|---|---|---|
| Wolfe Research | Downgrade | Peer Perform | 2026-01-08 |
| Morgan Stanley | Maintain | Overweight | 2025-12-12 |
| HSBC | Upgrade | Buy | 2025-12-10 |
| UBS | Maintain | Neutral | 2025-11-07 |
| Piper Sandler | Maintain | Overweight | 2025-11-05 |
| Citigroup | Maintain | Neutral | 2025-11-03 |
| JP Morgan | Maintain | Overweight | 2025-11-03 |
| Guggenheim | Maintain | Buy | 2025-10-20 |
| Raymond James | Maintain | Outperform | 2025-10-17 |
| Piper Sandler | Maintain | Overweight | 2025-10-10 |
AbbVie’s grades are more mixed, including downgrades and Neutral ratings, though many maintain Overweight and Buy stances.
Which company has the best grades?
Eli Lilly has received more uniformly positive grades, mainly Buy, Overweight, and Outperform, indicating stronger analyst confidence than AbbVie, which shows some downgrades and Neutral ratings. This difference may influence investor sentiment and perceived risk for each stock.
Strengths and Weaknesses
Below is a comparison of key strengths and weaknesses for Eli Lilly and Company (LLY) and AbbVie Inc. (ABBV) based on recent financial and market data.
| Criterion | Eli Lilly and Company (LLY) | AbbVie Inc. (ABBV) |
|---|---|---|
| Diversification | Strong product diversification, with revenue mainly from pharmaceuticals ($40.7B in 2024) and collaborations; consistent growth in key segments. | Broad product portfolio with heavy reliance on flagship drugs like HUMIRA and SKYRIZI; aesthetics and neuroscience growing but less diversified overall. |
| Profitability | High profitability: net margin 23.5%, ROIC 26.4%, ROE 74.6%, with favorable interest coverage and efficient capital use. | Moderate profitability: net margin 7.6%, ROIC 10.2%, very high ROE 128.7%, but weaker interest coverage and current liquidity ratios. |
| Innovation | Very favorable economic moat with growing ROIC (+45.8%), signaling strong innovation and competitive advantage. | Slightly favorable moat with declining ROIC (-13.7%), indicating challenges in sustaining innovation momentum. |
| Global presence | Strong global presence supported by large product sales and collaborations worldwide. | Significant global footprint, especially in immunology and aesthetics, but with higher debt limiting flexibility. |
| Market Share | Leading market share in endocrinology and oncology segments with rising revenues. | Dominant in immunology with HUMIRA and SKYRIZI, but facing patent expirations and competition pressures. |
Key takeaways: Eli Lilly exhibits a robust and growing competitive advantage with strong profitability and diversification. AbbVie, while profitable and dominant in key areas, faces challenges from declining ROIC and liquidity concerns, warranting cautious evaluation for long-term growth.
Risk Analysis
Below is a comparison of key risks for Eli Lilly and Company (LLY) and AbbVie Inc. (ABBV) as of 2024:
| Metric | Eli Lilly and Company (LLY) | AbbVie Inc. (ABBV) |
|---|---|---|
| Market Risk | Low beta (0.35), stable sector exposure | Low beta (0.35), but higher valuation multiples increase sensitivity |
| Debt level | Moderate (debt-to-equity 2.37x, neutral) | High (debt-to-equity 20.4x, unfavorable) |
| Regulatory Risk | Moderate, typical pharma challenges | Moderate to high, dependence on key drugs like HUMIRA faces patent cliffs |
| Operational Risk | Moderate, diversified drug portfolio | Moderate, with reliance on few blockbuster drugs |
| Environmental Risk | Low to moderate, standard healthcare impact | Low to moderate, ongoing sustainability initiatives |
| Geopolitical Risk | Moderate, global market presence | Moderate, global exposure with supply chain risks |
The most likely and impactful risks center on AbbVie’s high leverage and regulatory pressures on its flagship products, risking cash flow stability. Eli Lilly’s risk is mitigated by stronger financial stability and diversified pipeline, though valuation remains elevated. Both companies face typical industry regulatory and geopolitical uncertainties.
Which Stock to Choose?
Eli Lilly and Company (LLY) shows a strong income evolution with revenue growth of 32% in the last year and a favorable global income statement opinion. Its financial ratios are slightly favorable overall, supported by high returns on equity (74.6%) and invested capital (26.4%). The company maintains moderate debt levels (net debt to EBITDA near 2) and a very favorable B+ rating, indicating solid financial health and efficient capital use.
AbbVie Inc. (ABBV) exhibits modest income growth of 3.7% last year, but overall income statement evaluation is unfavorable, with declining net income and margins. Financial ratios are slightly unfavorable, marked by high leverage (debt to equity over 20) and weaker liquidity. Despite a very favorable C+ rating in some aspects, the company’s profitability shows signs of pressure and a declining return on invested capital.
For investors, LLY might appear more attractive for those prioritizing strong profitability and a durable competitive advantage, as indicated by its very favorable moat status and stable financial metrics. ABBV could be seen as more suitable for those focused on dividend yield and value aspects but facing higher financial risk and less favorable income growth. The choice depends on the investor’s risk tolerance and investment strategy.
Disclaimer: Investment carries a risk of loss of initial capital. The past performance is not a reliable indicator of future results. Be sure to understand risks before making an investment decision.
Go Further
I encourage you to read the complete analyses of Eli Lilly and Company and AbbVie Inc. to enhance your investment decisions: