Home > Comparison > Healthcare > ABBV vs BMY
The strategic rivalry between AbbVie Inc. and Bristol-Myers Squibb Company shapes the competitive landscape of the healthcare sector. AbbVie operates as a capital-intensive pharmaceutical powerhouse with a strong focus on autoimmune and oncology therapies. In contrast, Bristol-Myers Squibb excels as a diversified biopharmaceutical leader emphasizing hematology and immunology. This analysis will determine which company’s strategic path offers superior risk-adjusted returns for a well-diversified portfolio.

Table of contents
Companies Overview
AbbVie and Bristol-Myers Squibb both hold pivotal roles in the global pharmaceutical landscape, shaping drug development and patient care.
AbbVie Inc.: Specialty Pharma Powerhouse
AbbVie dominates as a leader in immunology and oncology therapies. Its revenue stems primarily from flagship drugs like HUMIRA, SKYRIZI, and IMBRUVICA. In 2026, AbbVie sharpened its strategic focus on expanding its pipeline through innovation and targeted acquisitions to sustain long-term growth in chronic and complex diseases.
Bristol-Myers Squibb Company: Biopharma Innovator
Bristol-Myers Squibb excels in the biopharmaceutical sector with a broad therapeutic portfolio covering oncology, hematology, and immunology. Its core revenues derive from drugs such as Revlimid, Eliquis, and Opdivo. In 2026, the company concentrated on advancing next-generation therapies and solidifying its market share through research-driven diversification.
Strategic Collision: Similarities & Divergences
Both companies build competitive moats based on innovative drug development and therapeutic specialization. AbbVie emphasizes a deep portfolio in immunology, while Bristol-Myers Squibb leans on oncology and hematology. They primarily compete over specialty pharmaceuticals and biologics. Their investment profiles diverge: AbbVie offers stability with blockbuster drugs; Bristol-Myers Squibb presents growth potential through diversified pipelines.
Income Statement Comparison
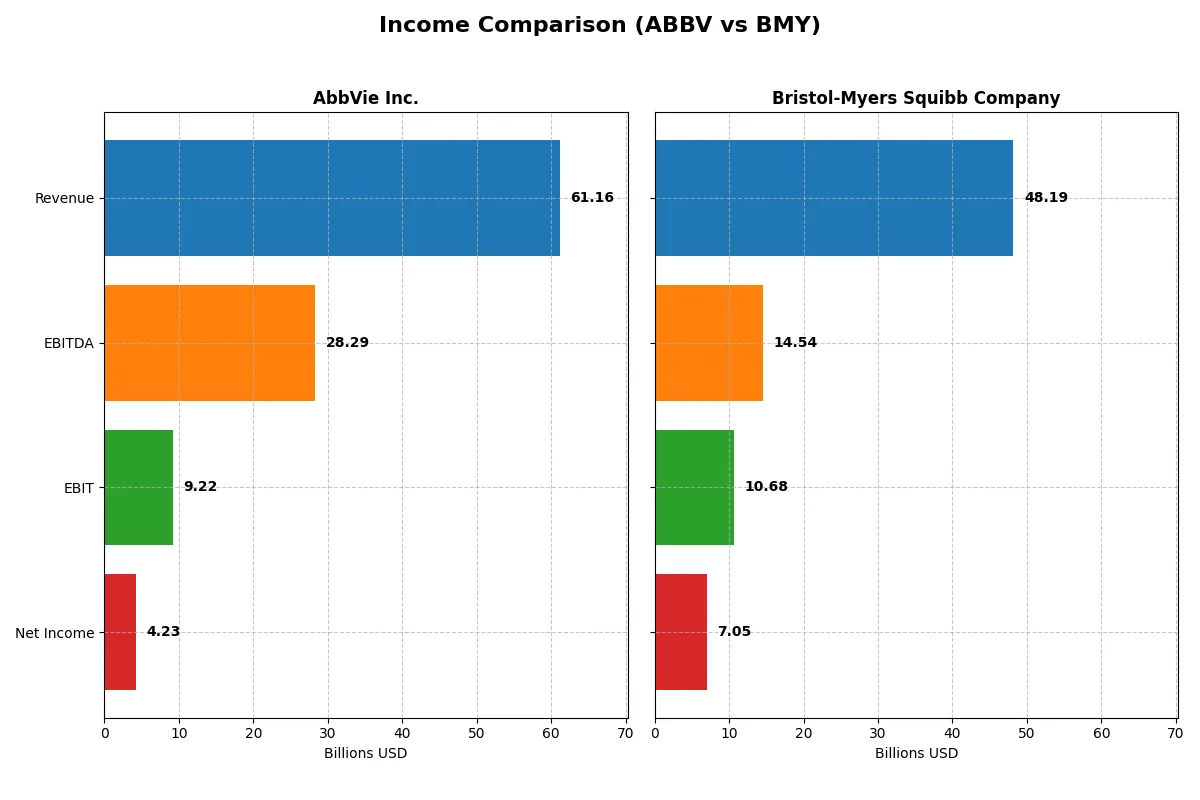
The data below dissects the core profitability and scalability of both corporate engines to reveal who dominates the bottom line in 2025:
| Metric | AbbVie Inc. (ABBV) | Bristol-Myers Squibb Company (BMY) |
|---|---|---|
| Revenue | 61.2B | 48.2B |
| Cost of Revenue | 10.0B | 15.6B |
| Operating Expenses | 30.0B | 19.9B |
| Gross Profit | 51.2B | 32.6B |
| EBITDA | 28.3B | 14.5B |
| EBIT | 9.2B | 10.7B |
| Interest Expense | 2.6B | 1.5B |
| Net Income | 4.2B | 7.1B |
| EPS | 2.38 | 3.46 |
| Fiscal Year | 2025 | 2025 |
Income Statement Analysis: The Bottom-Line Duel
This income statement comparison exposes the operational efficiency driving each company’s profitability and growth dynamics over recent years.
AbbVie Inc. Analysis
AbbVie’s revenue climbed steadily from $56.2B in 2021 to $61.2B in 2025, showing solid top-line momentum. Gross margins remain robust at 83.7%, supporting healthy profitability despite a net income decline to $4.2B in 2025. Operating income surged, but net margin contracted, reflecting rising expenses and interest costs, signaling pressure on bottom-line efficiency.
Bristol-Myers Squibb Company Analysis
Bristol-Myers Squibb’s revenue held near $48B from 2021 to 2025, showing flat growth. Gross margin at 67.6% and net margin at 14.6% illustrate better profitability ratios than AbbVie. After a net loss in 2024, BMY rebounded to $7.1B net income in 2025, propelled by a sharp EBIT surge and margin expansion, indicating improved operational leverage and cost control.
Margin Strength vs. Earnings Resilience
AbbVie leads in revenue growth and gross margin but faces net income erosion, weakening its bottom-line momentum. Bristol-Myers Squibb delivers superior net margins and recent earnings recovery despite stagnant revenues. For investors, AbbVie’s scale contrasts with BMY’s margin resilience, favoring those seeking steady profits over rapid top-line growth.
Financial Ratios Comparison
These vital ratios act as a diagnostic tool to expose the underlying fiscal health, valuation premiums, and capital efficiency of the companies analyzed:
| Ratios | AbbVie Inc. (ABBV) | Bristol-Myers Squibb Company (BMY) |
|---|---|---|
| ROE | 1.29 | 0 |
| ROIC | 0.09 | 0 |
| P/E | 96.8 | 15.6 |
| P/B | 0 | 0 |
| Current Ratio | 0 | 0 |
| Quick Ratio | 0 | 0 |
| D/E | 0 | 0 |
| Debt-to-Assets | 0 | 0 |
| Interest Coverage | 8.08 | 4.93 |
| Asset Turnover | 0 | 0 |
| Fixed Asset Turnover | 0 | 0 |
| Payout ratio | 2.78 | 0.72 |
| Dividend yield | 2.87% | 4.60% |
| Fiscal Year | 2025 | 2025 |
Efficiency & Valuation Duel: The Vital Signs
Ratios serve as a company’s DNA, revealing hidden risks and operational excellence that simple financial statements might obscure.
AbbVie Inc.
AbbVie shows a modest net margin of 6.91% but suffers from an unfavorable ROE and ROIC, signaling weak core profitability. Its P/E ratio of 96.82 marks the stock as highly stretched. The company sustains shareholder returns with a 2.87% dividend yield, indicating some income stability despite operational challenges.
Bristol-Myers Squibb Company
Bristol-Myers posts a strong net margin of 14.64%, reflecting robust profitability. Its P/E ratio sits at a reasonable 15.55, suggesting a fairly valued stock. The dividend yield of 4.6% enhances shareholder returns, complementing its solid interest coverage ratio of 7.08, which signals healthy financial flexibility.
Premium Valuation vs. Operational Safety
AbbVie’s stretched valuation contrasts with Bristol-Myers’ more balanced metrics and stronger profitability. Bristol-Myers offers a better blend of value and operational safety. Investors prioritizing stable income and risk management may prefer Bristol-Myers’ profile over AbbVie’s premium but riskier stance.
Which one offers the Superior Shareholder Reward?
AbbVie (ABBV) yields around 3.5% with a conservative payout ratio near 85%. It sustains dividends with strong free cash flow (FCF) coverage and executes significant buybacks, enhancing total returns. Bristol-Myers Squibb (BMY) pays a higher yield near 4.6% but with a lower payout ratio (~72%) and less aggressive buybacks. I see AbbVie’s balanced dividend and buyback strategy as more sustainable, given its robust FCF and leverage metrics. BMY’s higher yield compensates for its weaker margins and volatile earnings. For 2026, I favor AbbVie’s shareholder reward due to its superior capital allocation discipline and buyback intensity, promising more reliable total returns.
Comparative Score Analysis: The Strategic Profile
The radar chart reveals the fundamental DNA and trade-offs of AbbVie Inc. and Bristol-Myers Squibb Company, highlighting their financial strengths and vulnerabilities:
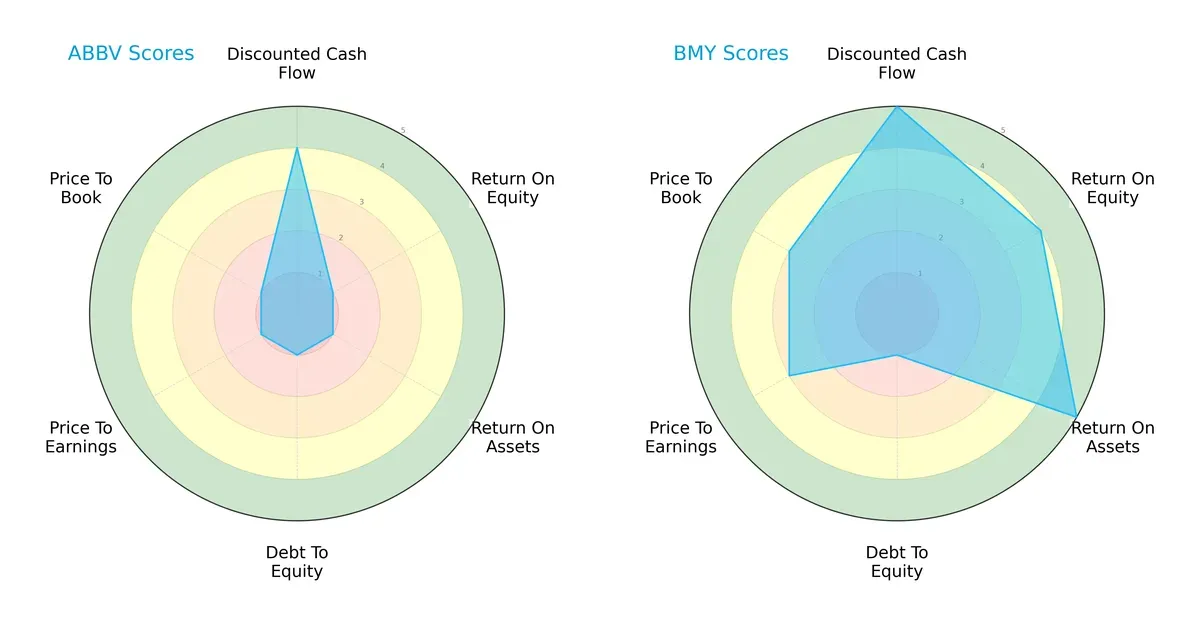
Bristol-Myers Squibb exhibits a more balanced profile with strong DCF (5), ROE (4), and ROA (5) scores, signaling efficient capital use and profitability. AbbVie relies heavily on discounted cash flow (4) but struggles across ROE, ROA, and valuation metrics (all scored 1), indicating a weaker operational and financial footing. Both show poor debt management, but BMY’s moderate valuation scores (PE/PB at 3) reflect relatively better market pricing.
Bankruptcy Risk: Solvency Showdown
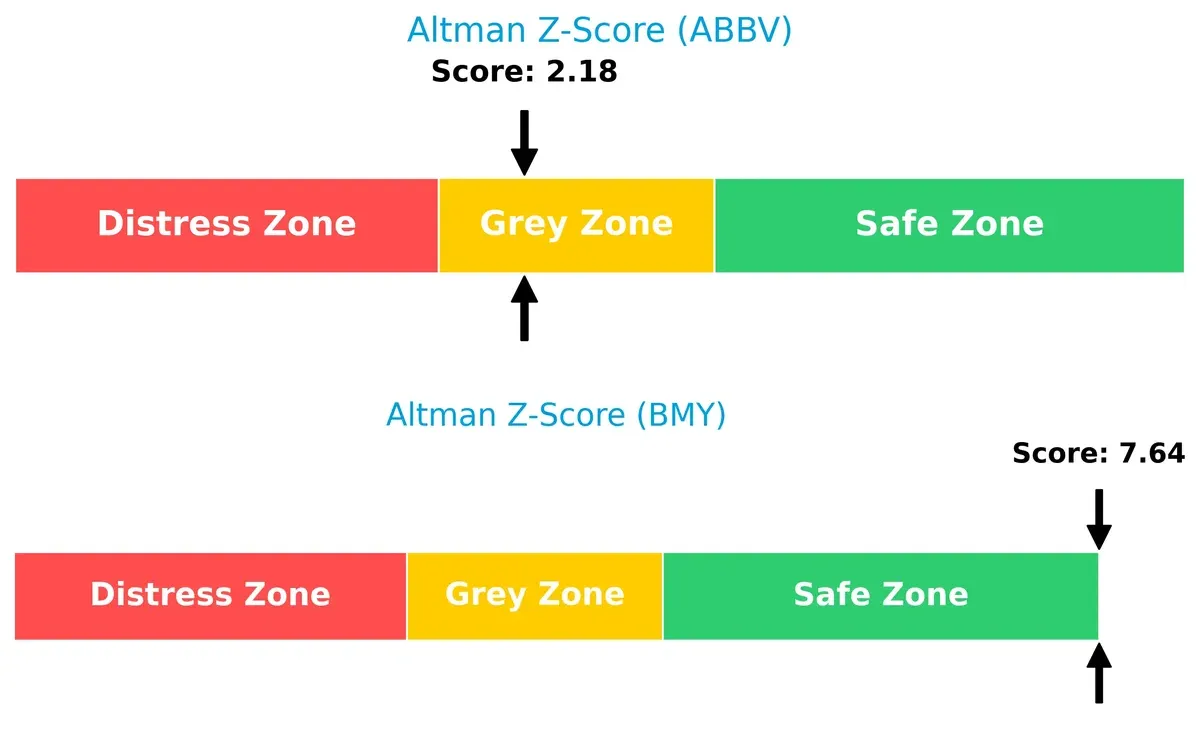
Bristol-Myers Squibb’s Altman Z-Score at 7.64 places it firmly in the safe zone, signaling robust solvency and low bankruptcy risk. AbbVie’s score of 2.18, in the grey zone, flags moderate financial distress risk amid current market pressures:
Financial Health: Quality of Operations
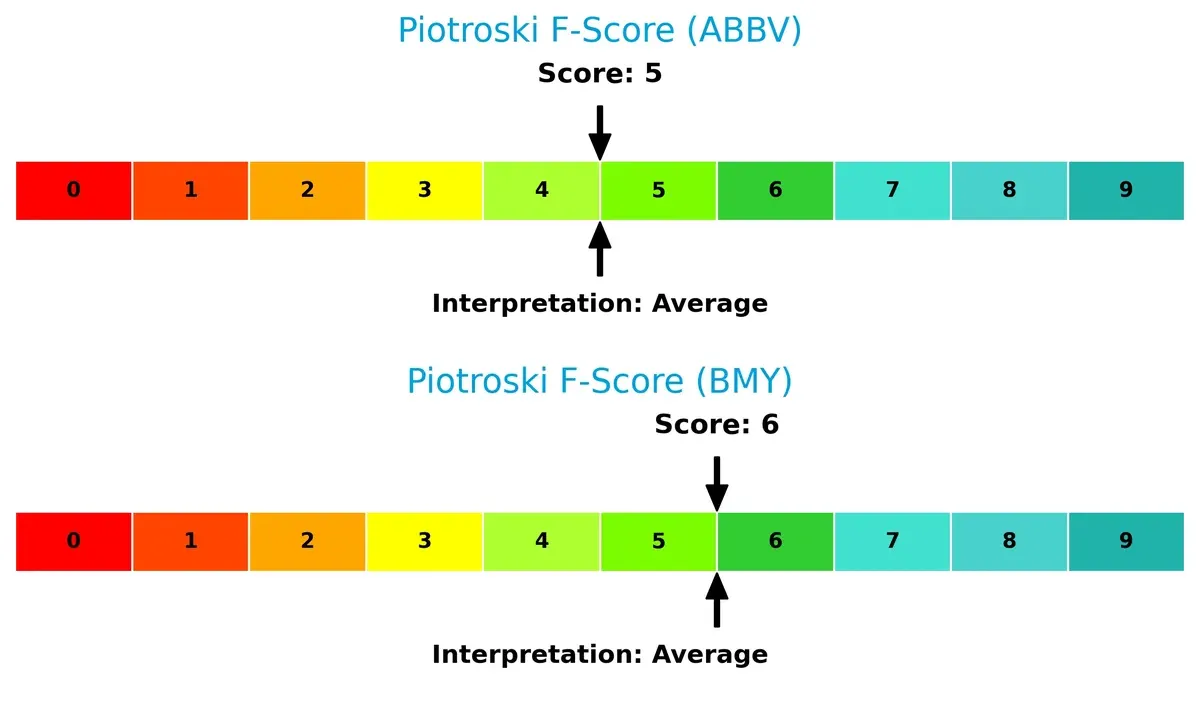
Both companies display average financial health by Piotroski F-Score standards. Bristol-Myers Squibb’s score of 6 edges out AbbVie’s 5, suggesting slightly stronger operational quality and internal metrics. Neither firm shows critical red flags, but AbbVie’s marginally lower score advises caution:
How are the two companies positioned?
This section dissects AbbVie and Bristol-Myers Squibb’s operational DNA by comparing their revenue distribution and internal dynamics. The goal is to confront their economic moats and identify which model offers the most resilient competitive advantage.
Revenue Segmentation: The Strategic Mix
This visual comparison dissects how AbbVie Inc. and Bristol-Myers Squibb Company diversify their income streams and where their primary sector bets lie:
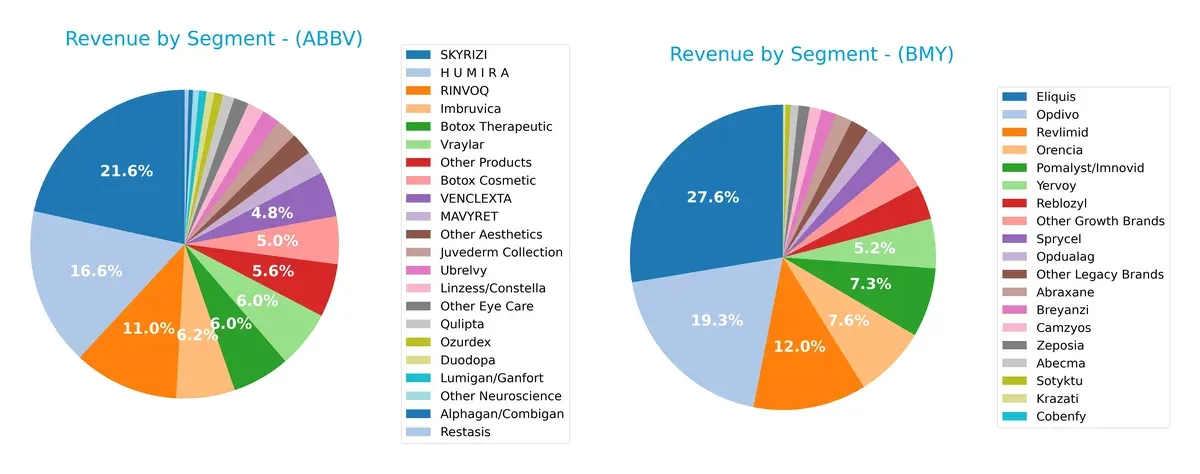
AbbVie anchors its revenue heavily on flagship drugs like SKYRIZI ($11.7B) and HUMIRA ($9B), showing a clear reliance on a few dominant products. In contrast, Bristol-Myers Squibb spreads its bets with top segments like Eliquis ($13.3B) and Opdivo ($9.3B) but also a broader base across multiple mid-sized drugs. AbbVie’s concentration risks contrast with BMY’s diversified portfolio, which supports ecosystem resilience and mitigates single-product dependency.
Strengths and Weaknesses Comparison
This table compares the Strengths and Weaknesses of AbbVie Inc. and Bristol-Myers Squibb Company:
AbbVie Strengths
- Strong U.S. market presence with $43B revenue
- Diverse portfolio with top products like Humira and Skyrizi
- Favorable debt-to-equity and debt-to-assets ratios
- Dividend yield at 2.87% supports shareholder returns
Bristol-Myers Squibb Strengths
- Higher net margin at 14.64% indicating better profitability
- Strong global presence including U.S. and Europe
- Favorable interest coverage ratio at 7.08
- Dividend yield of 4.6% attractive for income investors
AbbVie Weaknesses
- Unfavorable ROE and ROIC indicate weak capital efficiency
- High P/E ratio at 96.82 questions valuation
- Low current and quick ratios suggest liquidity concerns
- Asset turnover ratios unfavorable hinting at operational inefficiency
Bristol-Myers Squibb Weaknesses
- Unfavorable ROE and ROIC reflect similar capital allocation issues
- Current and quick ratios also unfavorable
- Asset and fixed asset turnover ratios weak
- P/E ratio is neutral but profitability may be offset by operational inefficiencies
AbbVie shows strength in market share and balance sheet leverage but faces challenges in profitability and liquidity. Bristol-Myers Squibb outperforms in profitability and coverage ratios yet shares capital efficiency and liquidity weaknesses. Both companies’ strategies must address operational efficiency to enhance returns.
The Moat Duel: Analyzing Competitive Defensibility
A structural moat stands as the only safeguard protecting long-term profits from relentless competitive pressures and market erosion:
AbbVie Inc.: Intangible Assets Powerhouse
AbbVie relies heavily on its portfolio of patented drugs, notably HUMIRA, which drives high gross margins near 84%. This moat shows margin stability but faces patent expiration risks in 2026, pressuring future profitability.
Bristol-Myers Squibb Company: Diversified Product Moat
Bristol-Myers Squibb leverages a diversified drug lineup across oncology and immunology, supporting a stronger EBIT margin of 22%. Its broader portfolio cushions revenue dips, offering expansion opportunities in emerging therapies.
Patent Exclusivity vs. Portfolio Diversification
AbbVie’s moat is narrower, hinging on few blockbuster drugs vulnerable to patent cliffs. Bristol-Myers Squibb’s wider moat stems from product diversity, better positioning it to sustain market share amid competitive disruption.
Which stock offers better returns?
Over the past 12 months, AbbVie Inc. and Bristol-Myers Squibb Company showed distinct bullish trends with varying momentum and price ranges.
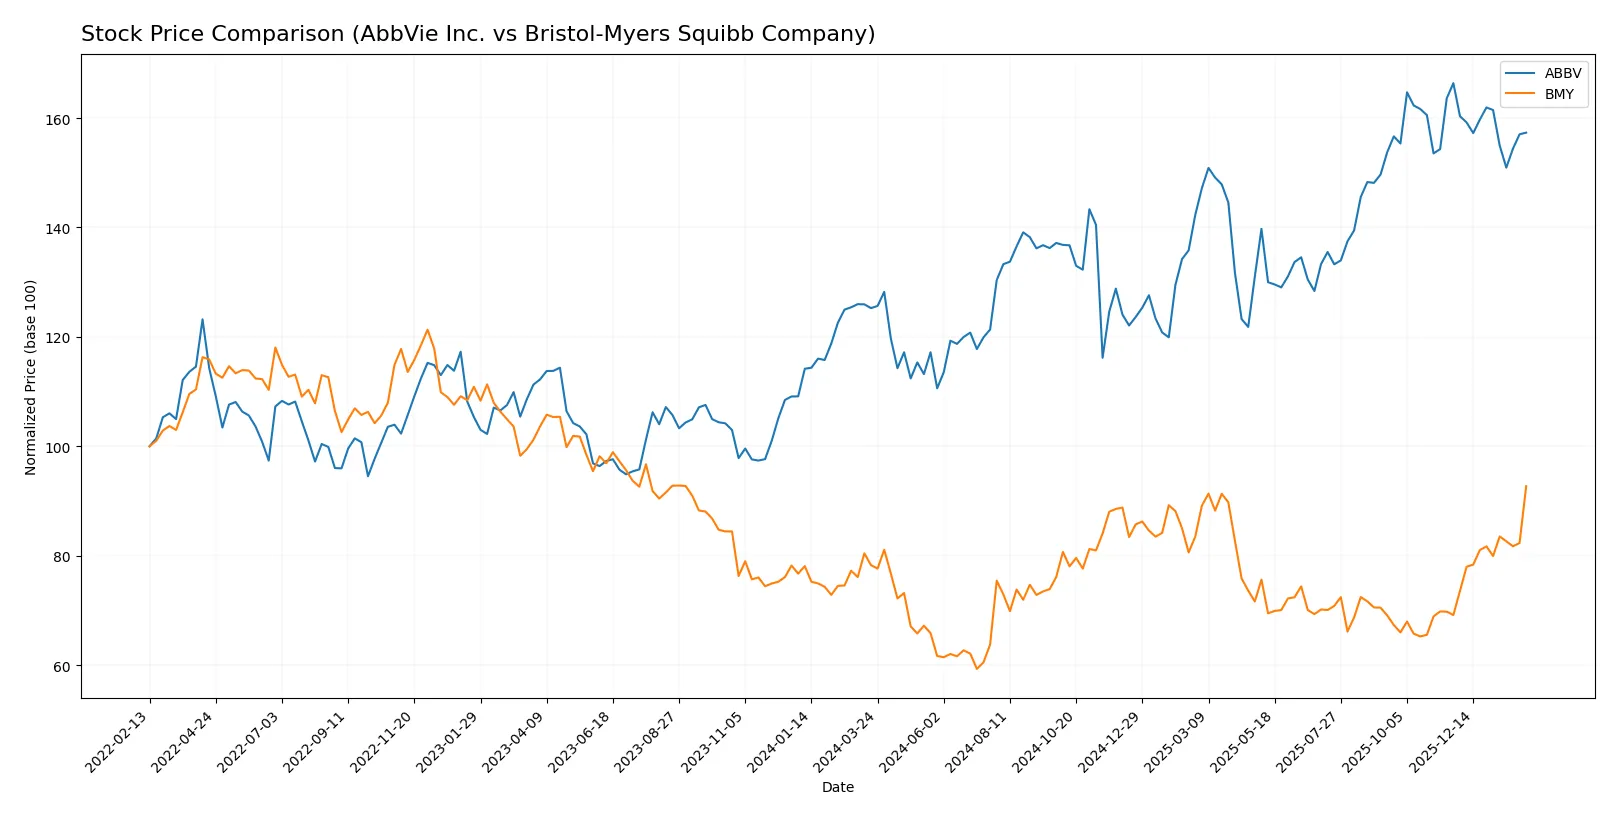
Trend Comparison
AbbVie’s stock price rose 25.61% over the past year, displaying a bullish trend but with decelerating momentum and a high volatility of 21.01%. The price peaked at 236.28 and bottomed at 157.06.
Bristol-Myers Squibb’s stock gained 18.44%, maintaining a bullish trend with accelerating momentum and low volatility at 5.52%. Its high was 61.99, with a low of 39.66.
AbbVie outperformed Bristol-Myers Squibb with a stronger annual price gain despite slowing momentum, delivering the highest market return in this timeframe.
Target Prices
Analysts present a cautiously optimistic consensus on AbbVie Inc. and Bristol-Myers Squibb Company.
| Company | Target Low | Target High | Consensus |
|---|---|---|---|
| AbbVie Inc. | 223 | 289 | 253.18 |
| Bristol-Myers Squibb | 40 | 72 | 60.11 |
AbbVie’s consensus target price exceeds its current price of 223.43, suggesting upside potential. Bristol-Myers Squibb’s target aligns closely with its current 61.99 price, indicating a balanced outlook.

Don’t Let Luck Decide Your Entry Point
Optimize your entry points with our advanced ProRealTime indicators. You’ll get efficient buy signals with precise price targets for maximum performance. Start outperforming now!
How do institutions grade them?
The following tables summarize recent institutional grades for AbbVie Inc. and Bristol-Myers Squibb Company:
AbbVie Inc. Grades
This table shows recent rating actions from major grading companies for AbbVie Inc.:
| Grading Company | Action | New Grade | Date |
|---|---|---|---|
| Morgan Stanley | maintain | Overweight | 2026-02-05 |
| UBS | maintain | Neutral | 2026-02-05 |
| Evercore ISI Group | maintain | Outperform | 2026-02-05 |
| Citigroup | maintain | Neutral | 2026-01-27 |
| Wolfe Research | downgrade | Peer Perform | 2026-01-08 |
| Morgan Stanley | maintain | Overweight | 2025-12-12 |
| HSBC | upgrade | Buy | 2025-12-10 |
| UBS | maintain | Neutral | 2025-11-07 |
| Piper Sandler | maintain | Overweight | 2025-11-05 |
| Citigroup | maintain | Neutral | 2025-11-03 |
Bristol-Myers Squibb Company Grades
This table shows recent rating actions from major grading companies for Bristol-Myers Squibb Company:
| Grading Company | Action | New Grade | Date |
|---|---|---|---|
| Citigroup | maintain | Neutral | 2026-02-06 |
| Wells Fargo | maintain | Equal Weight | 2026-02-06 |
| Guggenheim | maintain | Buy | 2026-02-06 |
| Piper Sandler | maintain | Overweight | 2026-01-28 |
| Citigroup | maintain | Neutral | 2026-01-27 |
| Leerink Partners | maintain | Outperform | 2026-01-13 |
| Scotiabank | maintain | Sector Perform | 2026-01-09 |
| UBS | upgrade | Buy | 2026-01-07 |
| Citigroup | maintain | Neutral | 2026-01-07 |
| B of A Securities | upgrade | Buy | 2025-12-15 |
Which company has the best grades?
Bristol-Myers Squibb holds more recent upgrades to Buy and Outperform ratings than AbbVie. This could influence investor sentiment positively for Bristol-Myers Squibb. However, AbbVie maintains several Overweight ratings, reflecting steady confidence.
Risks specific to each company
The following categories identify critical pressure points and systemic threats facing AbbVie Inc. and Bristol-Myers Squibb Company in the 2026 market environment:
1. Market & Competition
AbbVie Inc.
- Faces intense competition in autoimmune and oncology drugs, relying heavily on HUMIRA legacy products.
Bristol-Myers Squibb Company
- Competes broadly in hematology, oncology, and immunology with diverse product portfolio, reducing single-product risk.
2. Capital Structure & Debt
AbbVie Inc.
- Shows favorable debt-to-equity metrics but unfavorable liquidity ratios, suggesting potential short-term funding pressure.
Bristol-Myers Squibb Company
- Maintains favorable debt ratios and strong interest coverage, indicating robust financial stability despite moderate leverage.
3. Stock Volatility
AbbVie Inc.
- Low beta (0.334) signals lower market volatility, appealing for risk-averse investors.
Bristol-Myers Squibb Company
- Slightly lower beta (0.295) implies marginally less volatility than AbbVie, indicating defensive stock characteristics.
4. Regulatory & Legal
AbbVie Inc.
- Subject to regulatory scrutiny on blockbuster drugs and patent expirations, which may pressure revenues.
Bristol-Myers Squibb Company
- Faces regulatory risk from broad drug approval processes and patent cliffs, but diversified pipeline mitigates impact.
5. Supply Chain & Operations
AbbVie Inc.
- Global supply chain complexity may expose it to disruptions, notably in biologics manufacturing.
Bristol-Myers Squibb Company
- Also vulnerable to supply chain interruptions but benefits from established operational resilience and scale.
6. ESG & Climate Transition
AbbVie Inc.
- ESG efforts moderate; climate transition risks exist but not yet materialized in significant capital allocation shifts.
Bristol-Myers Squibb Company
- Demonstrates stronger ESG initiatives, potentially reducing regulatory and reputational risks over time.
7. Geopolitical Exposure
AbbVie Inc.
- U.S.-centric with global sales; geopolitical tensions could disrupt international market access.
Bristol-Myers Squibb Company
- Similar U.S. focus but with more diversified global footprint, somewhat offsetting geopolitical risks.
Which company shows a better risk-adjusted profile?
Bristol-Myers Squibb presents a stronger risk-adjusted profile, driven by superior financial stability and a more diversified product and geographic base. AbbVie’s key vulnerability is its liquidity pressure amid high reliance on legacy drugs. BMY’s standout risk remains its moderate leverage despite solid interest coverage. Recent evaluations show BMY’s Altman Z-score in the safe zone (7.64) versus ABBV’s grey zone (2.18), underscoring BMY’s safer financial footing.
Final Verdict: Which stock to choose?
AbbVie’s superpower lies in its robust cash generation fueled by strong operational margins and relentless R&D investment. This cash machine supports dividends and strategic initiatives but carries a point of vigilance in its stretched balance sheet and declining returns. It suits aggressive growth portfolios willing to tolerate financial leverage risks.
Bristol-Myers Squibb’s strategic moat is its stable recurring revenue and conservative capital structure, offering a safer harbor amid industry volatility. Its financial health and steady dividend yield provide better stability compared to AbbVie. This makes it a fit for GARP portfolios seeking balanced growth and income with moderate risk.
If you prioritize high cash flow and growth potential, AbbVie is the compelling choice due to its operational efficiency and innovation focus. However, if you seek stability and a stronger safety profile, Bristol-Myers Squibb offers better risk management and consistent returns. Each scenario caters to distinct investor appetites in today’s market.
Disclaimer: Investment carries a risk of loss of initial capital. The past performance is not a reliable indicator of future results. Be sure to understand risks before making an investment decision.
Go Further
I encourage you to read the complete analyses of AbbVie Inc. and Bristol-Myers Squibb Company to enhance your investment decisions: