Home > Comparison > Healthcare > ABBV vs BIIB
The strategic rivalry between AbbVie Inc. and Biogen Inc. defines the current trajectory of the healthcare sector. AbbVie operates as a diversified pharmaceutical powerhouse with a broad portfolio spanning autoimmune and oncology therapies. Biogen focuses on pioneering treatments for neurological and neurodegenerative diseases, emphasizing innovation in neuroimmunology. This analysis will assess which company’s operational model delivers a superior risk-adjusted return for a diversified portfolio amid evolving healthcare dynamics.
Table of contents
Companies Overview
AbbVie and Biogen are pivotal players in the pharmaceutical industry, shaping treatment landscapes globally.
AbbVie Inc.: A Biopharma Powerhouse
AbbVie dominates as a drug manufacturer specializing in autoimmune and oncology therapies. Its revenue hinges on blockbuster drugs like HUMIRA and SKYRIZI, with a strategic focus on expanding its immunology and oncology portfolio in 2026. AbbVie leverages a broad therapeutic footprint and robust pipeline to sustain growth amid patent expirations.
Biogen Inc.: Neurological Disease Innovator
Biogen stands out for its focus on neurological and neurodegenerative disease treatments. Its core revenue derives from multiple sclerosis and Alzheimer’s therapies, including TECFIDERA and ADUHELM. In 2026, Biogen emphasizes advancing neuroimmunology and neurodegenerative drug candidates, targeting high unmet medical needs with innovative biologics and biosimilars.
Strategic Collision: Similarities & Divergences
Both companies lead in specialty pharmaceuticals but diverge sharply in therapeutic focus—AbbVie excels in immunology and oncology, while Biogen specializes in neurology. Their primary battleground lies in advanced biologics and biosimilars, competing for market share in chronic diseases. AbbVie’s scale contrasts with Biogen’s innovation-driven profile, creating distinct risk-reward dynamics for investors.
Income Statement Comparison
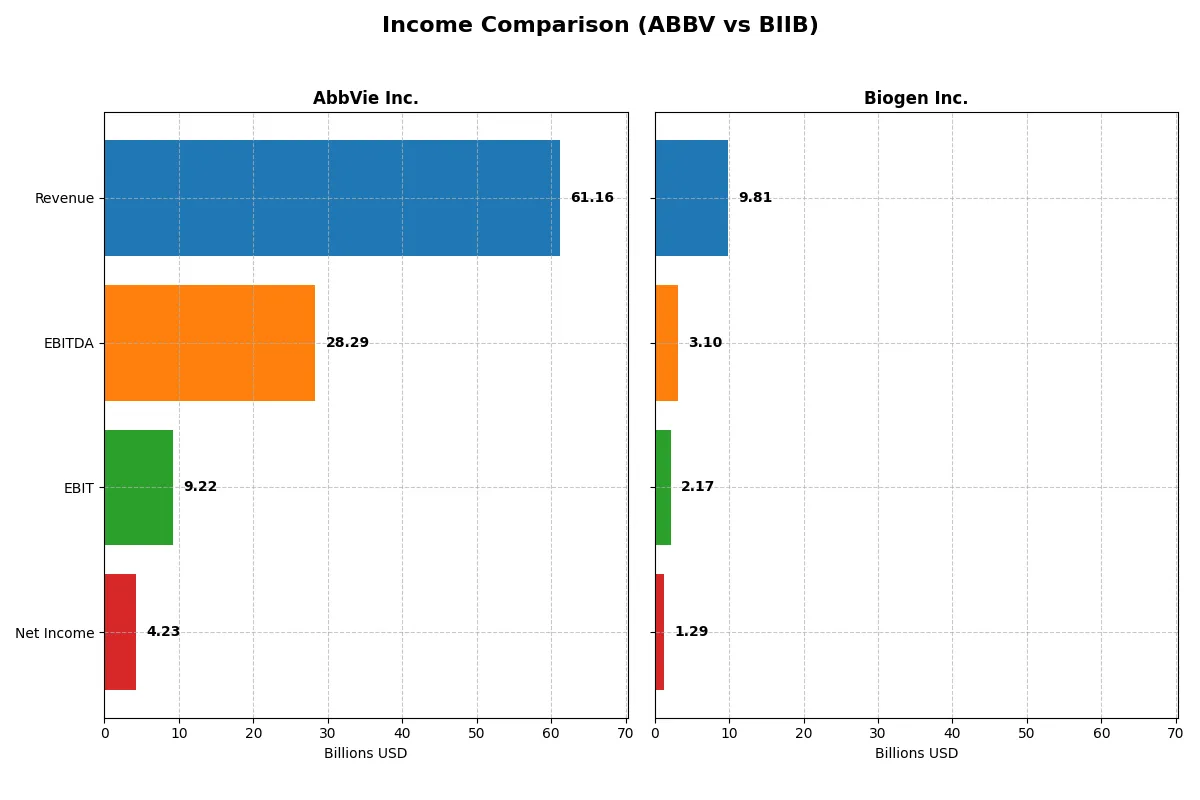
The following data dissects the core profitability and scalability of both corporate engines to reveal who dominates the bottom line:
| Metric | AbbVie Inc. (ABBV) | Biogen Inc. (BIIB) |
|---|---|---|
| Revenue | 61.2B | 9.81B |
| Cost of Revenue | 10.0B | 2.90B |
| Operating Expenses | 30.0B | 5.04B |
| Gross Profit | 51.2B | 6.91B |
| EBITDA | 28.3B | 3.10B |
| EBIT | 9.22B | 2.17B |
| Interest Expense | 2.63B | 246M |
| Net Income | 4.23B | 1.29B |
| EPS | 2.38 | 8.85 |
| Fiscal Year | 2025 | 2025 |
Income Statement Analysis: The Bottom-Line Duel
This income statement comparison reveals which company runs a more efficient and profitable corporate engine over recent years.
AbbVie Inc. Analysis
AbbVie’s revenue grew steadily from 56.2B in 2021 to 61.2B in 2025, showing an 8.6% one-year growth. Gross margins remain robust at 83.7%, and despite net income declining overall, the 2025 EBIT surged 41%, indicating improved operational efficiency. The net margin contraction to 6.9% signals some bottom-line pressure.
Biogen Inc. Analysis
Biogen’s revenue declined by 10.7% over five years, with a slight 1.4% dip in 2025 to 9.8B. The gross margin stands at a solid 70.5%, but EBIT slipped 6.8% last year. Net margin at 13.2% remains higher than AbbVie, yet Biogen faces ongoing margin and earnings pressure, reflected in shrinking EPS by 21% in 2025.
Margin Strength vs. Revenue Growth
AbbVie leads in revenue growth and operational scale, showing strong gross margins and a sharp EBIT rebound despite net income challenges. Biogen offers higher net margins but suffers from declining top-line momentum and shrinking earnings. For investors, AbbVie’s profile favors growth and efficiency, while Biogen’s reflects margin resilience amid contraction.
Financial Ratios Comparison
These vital ratios act as a diagnostic tool to expose the underlying fiscal health, valuation premiums, and capital efficiency of the companies compared below:
| Ratios | AbbVie Inc. (ABBV) | Biogen Inc. (BIIB) |
|---|---|---|
| ROE | 0 (not reported) | 7.08% |
| ROIC | 0 (not reported) | 6.62% |
| P/E | 96.8x (2025) | 20.0x (2025) |
| P/B | 0 (not reported) | 1.41x (2025) |
| Current Ratio | 0 (2025) | 2.68 (2025) |
| Quick Ratio | 0 (2025) | 2.03 (2025) |
| D/E | 0 (2025) | 0.38 (2025) |
| Debt-to-Assets | 0 (2025) | 23.6% (2025) |
| Interest Coverage | 8.08x (2025) | 7.63x (2025) |
| Asset Turnover | 0 (2025) | 0.33 (2025) |
| Fixed Asset Turnover | 0 (2025) | 2.95 (2025) |
| Payout ratio | 2.78 (2025) | 0 (2025) |
| Dividend yield | 2.87% (2025) | 0% (2025) |
| Fiscal Year | 2025 | 2025 |
Efficiency & Valuation Duel: The Vital Signs
Financial ratios act as a company’s DNA, unveiling hidden risks and operational strengths that shape investor decisions.
AbbVie Inc.
AbbVie shows a neutral net margin of 6.91% but zero reported ROE and ROIC, signaling underlying profitability concerns. Its P/E ratio stands at a stretched 96.82, indicating an expensive valuation. The 2.87% dividend yield supports shareholder returns, balancing weak profitability with steady income distribution.
Biogen Inc.
Biogen delivers a robust net margin of 13.18% and modest ROE at 7.08%, reflecting moderate operational efficiency. Its P/E ratio of 19.96 appears fairly valued, complemented by strong liquidity ratios and low leverage. Absence of dividends suggests reinvestment focused on R&D and growth initiatives.
Valuation Stretch vs. Operational Strength
AbbVie trades at a premium with weak profitability but rewards shareholders via dividends. Biogen combines better profitability and balance-sheet health with a fair valuation and no dividends. Investors seeking income might prefer AbbVie, while those favoring growth and operational stability may lean toward Biogen.
Which one offers the Superior Shareholder Reward?
AbbVie pays a solid 3.5% dividend yield with a conservative 26% payout ratio, sustaining dividends via strong free cash flow (10B+ per share). It also runs intense buybacks, enhancing shareholder value. Biogen pays no dividend but reinvests heavily in growth and R&D, with modest buybacks. I see AbbVie’s balanced distribution and buyback strategy as more sustainable and attractive for total returns in 2026.
Comparative Score Analysis: The Strategic Profile
The radar chart reveals the fundamental DNA and trade-offs between AbbVie Inc. and Biogen Inc., highlighting their differing financial strengths and valuation dynamics:
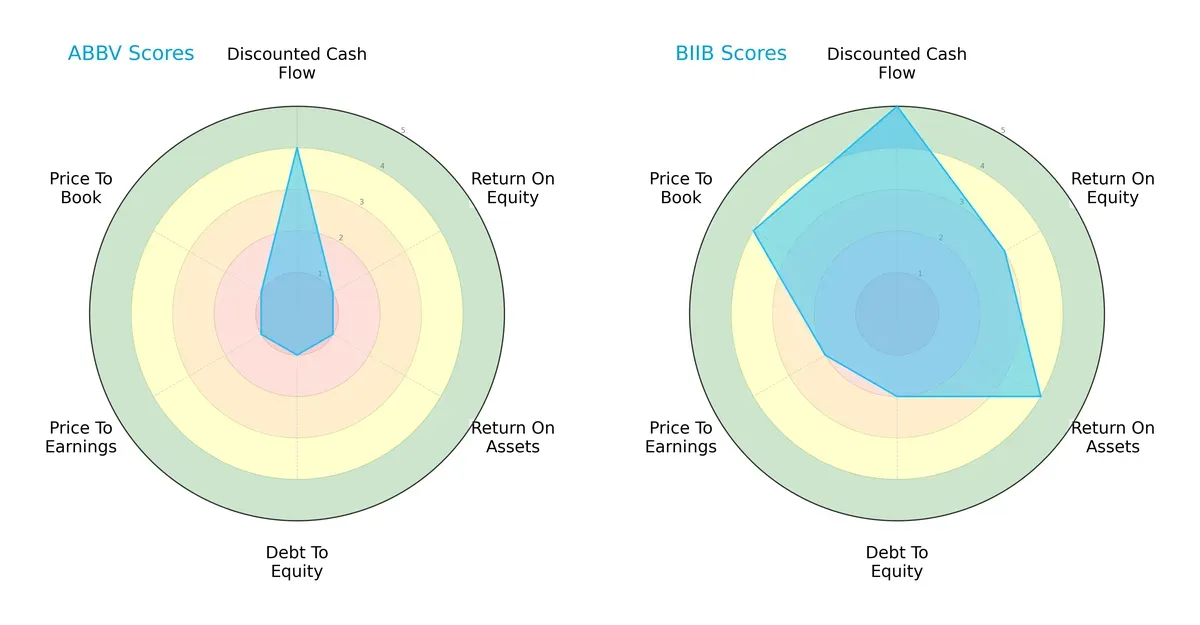
Biogen boasts a more balanced profile with a very favorable discounted cash flow score (5) and solid return on assets (4). AbbVie relies narrowly on its DCF strength (4) but scores very low in profitability (ROE:1, ROA:1) and valuation metrics (P/E:1, P/B:1). Biogen’s moderate leverage (debt-to-equity score 2) contrasts with AbbVie’s very unfavorable debt profile (1). Overall, Biogen demonstrates healthier operational efficiency and valuation discipline, while AbbVie’s profile signals riskier financial footing.
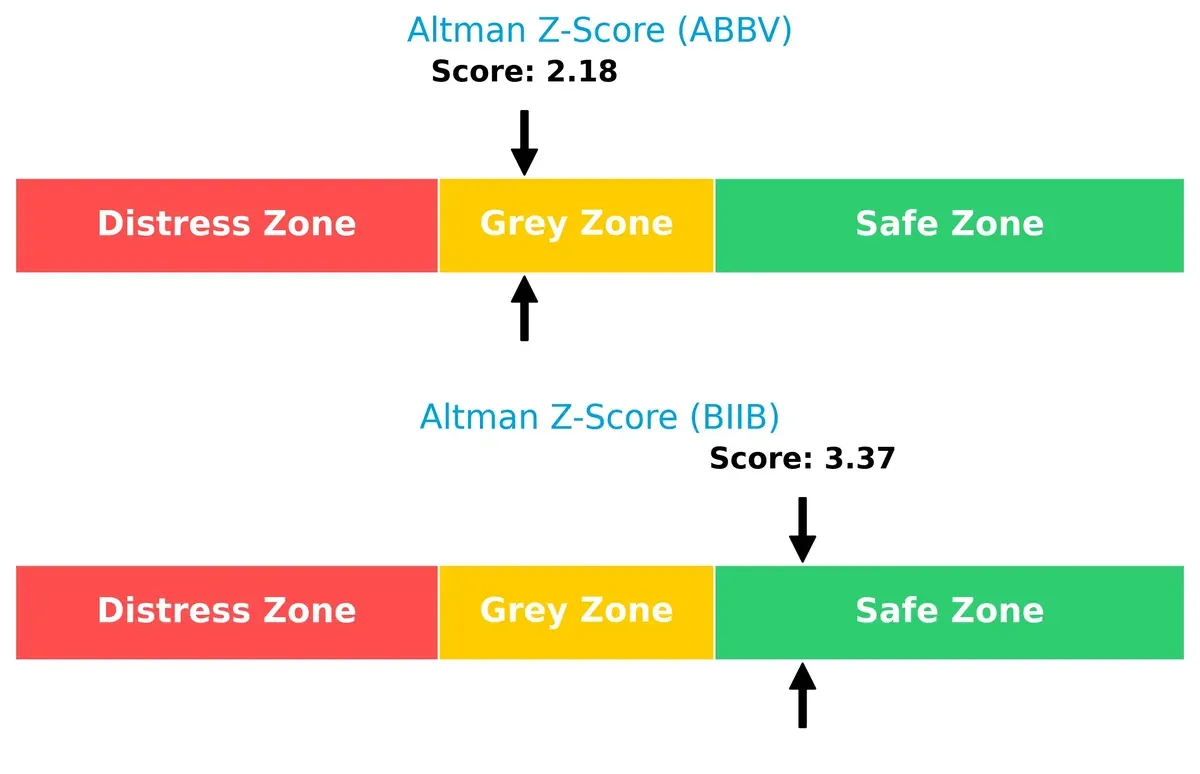
Bankruptcy Risk: Solvency Showdown
Biogen’s Altman Z-Score (3.37) places it firmly in the safe zone, indicating strong long-term solvency. AbbVie’s score (2.18) falls in the grey zone, suggesting moderate bankruptcy risk amid current market pressures:
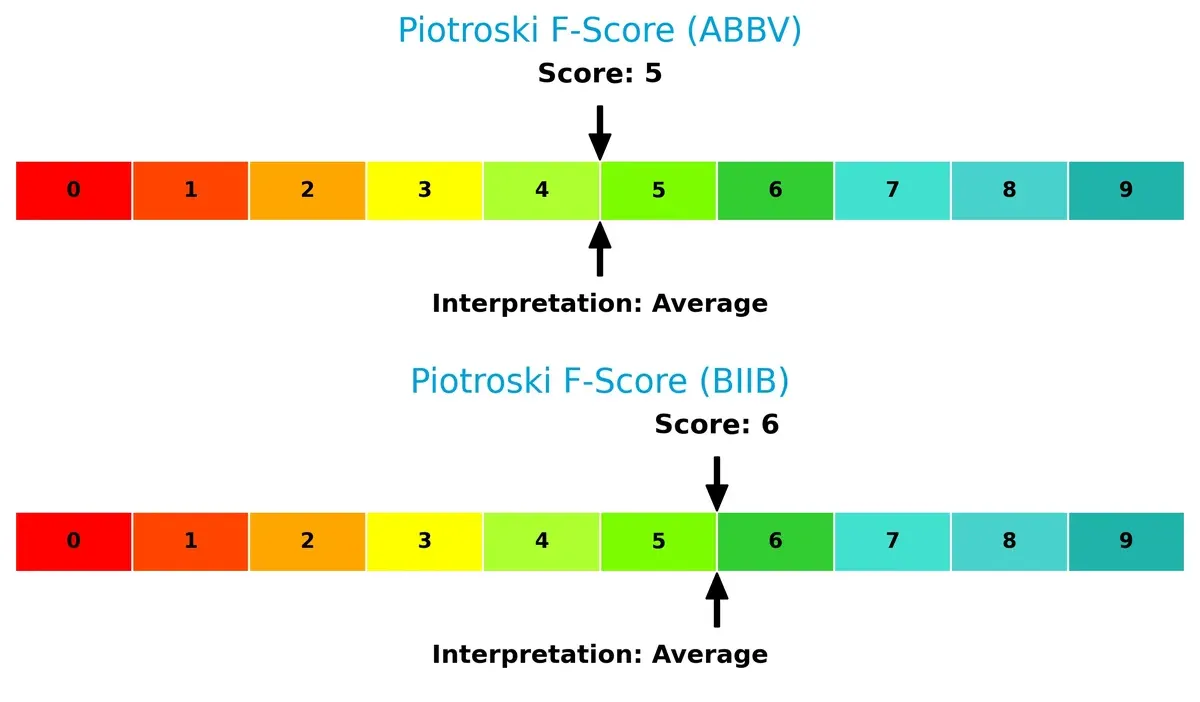
Financial Health: Quality of Operations
Both firms show average Piotroski F-Scores, with Biogen at 6 and AbbVie at 5, signaling neither is in peak financial health. Biogen slightly outperforms, but neither displays strong internal financial metrics, warranting cautious scrutiny:
How are the two companies positioned?
This section dissects AbbVie and Biogen’s operational DNA by comparing their revenue distribution and internal strengths and weaknesses. The goal is to confront their economic moats to identify which business model offers the most resilient, sustainable competitive advantage today.
Revenue Segmentation: The Strategic Mix
This comparison dissects how AbbVie Inc. and Biogen Inc. diversify their income streams and where their primary sector bets lie:
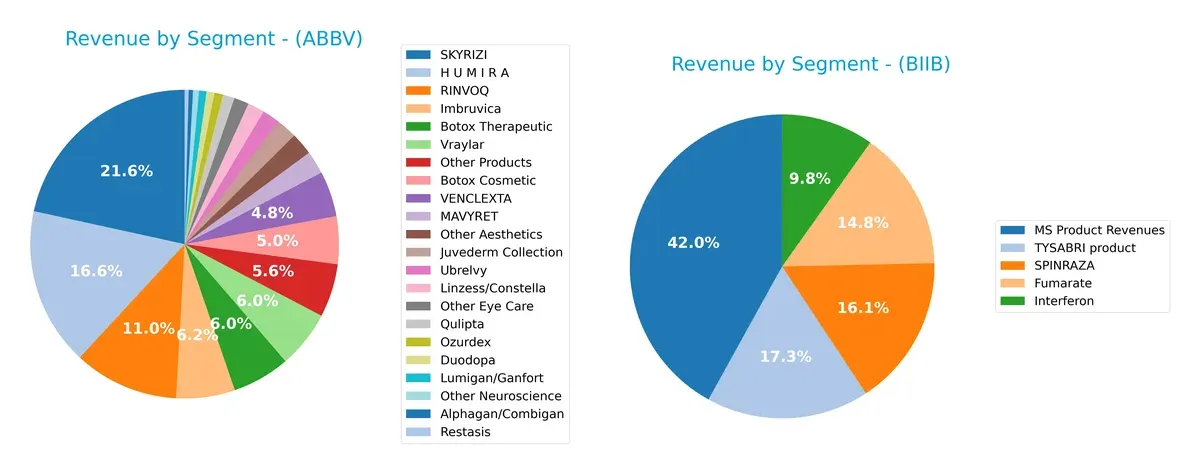
AbbVie anchors its revenue heavily in immunology, with SKYRIZI at $11.7B and HUMIRA at $9B, complemented by diverse aesthetics and neuroscience products. Biogen pivots on MS Product Revenues, which dwarfs its other segments at $4.3B in 2024. AbbVie’s broader product mix reduces concentration risk, while Biogen’s reliance on MS products signals vulnerability but strong positioning in neurology therapies.
Strengths and Weaknesses Comparison
This table compares the strengths and weaknesses of AbbVie Inc. and Biogen Inc.:
AbbVie Strengths
- Diverse product portfolio including top-selling SKYRIZI and HUMIRA
- Strong U.S. revenue base with $43B in 2024
- Favorable dividend yield at 2.87%
- Low debt-to-equity and debt-to-assets ratios, indicating financial prudence
Biogen Strengths
- Higher net margin at 13.18% signals better profitability
- Favorable capital structure with low debt and strong interest coverage of 8.8
- Solid liquidity ratios, current at 2.68 and quick at 2.03
- International sales contributing significantly to revenues
AbbVie Weaknesses
- Unfavorable ROE and ROIC at 0%, indicating poor capital efficiency
- Unfavorable liquidity ratios at 0, raising concerns about short-term solvency
- High P/E ratio of 96.82 suggests overvaluation risk
- Asset turnover ratios unfavorable, signaling inefficiency in asset use
Biogen Weaknesses
- ROE of 7.08% is low compared to industry standards
- Asset turnover at 0.33 is weak, reflecting suboptimal asset use
- No dividend yield, which might disappoint income-focused investors
- Neutral P/E of 19.96 indicates moderate valuation but less upside
AbbVie shows strength in product diversification and financial conservatism but struggles with profitability and capital efficiency. Biogen delivers better profitability and liquidity with more favorable valuation metrics but faces challenges in asset utilization and shareholder returns. Each company’s financial profile highlights distinct strategic priorities and operational focus.
The Moat Duel: Analyzing Competitive Defensibility
A structural moat is the sole shield protecting long-term profits from relentless competition and market pressure. Here’s how AbbVie and Biogen stack up:
AbbVie Inc.: Intangible Assets Powerhouse
AbbVie’s moat stems from its strong patent portfolio and blockbuster drugs like HUMIRA. High gross margins (84%) reflect pricing power. Yet, declining ROIC signals future pressure from biosimilars and patent cliffs in 2026.
Biogen Inc.: Innovation-Driven Network Effects
Biogen’s moat relies on specialized neurological therapies and deep R&D collaborations, yielding a solid 22% EBIT margin. Its ROIC exceeds WACC, showing value creation, though declining profitability warns of competitive headwinds ahead.
Patent Strength vs. R&D Innovation: The Moat Face-Off
AbbVie’s intangible asset moat is broader but shows signs of erosion. Biogen’s innovation moat is narrower yet delivers better capital efficiency. I see Biogen better positioned to defend market share amid evolving industry challenges.
Which stock offers better returns?
The past year reveals contrasting stock price dynamics: AbbVie Inc. gained 25.61%, slowing its upward momentum, while Biogen Inc. declined 8.27% but recently showed accelerating recovery signs.
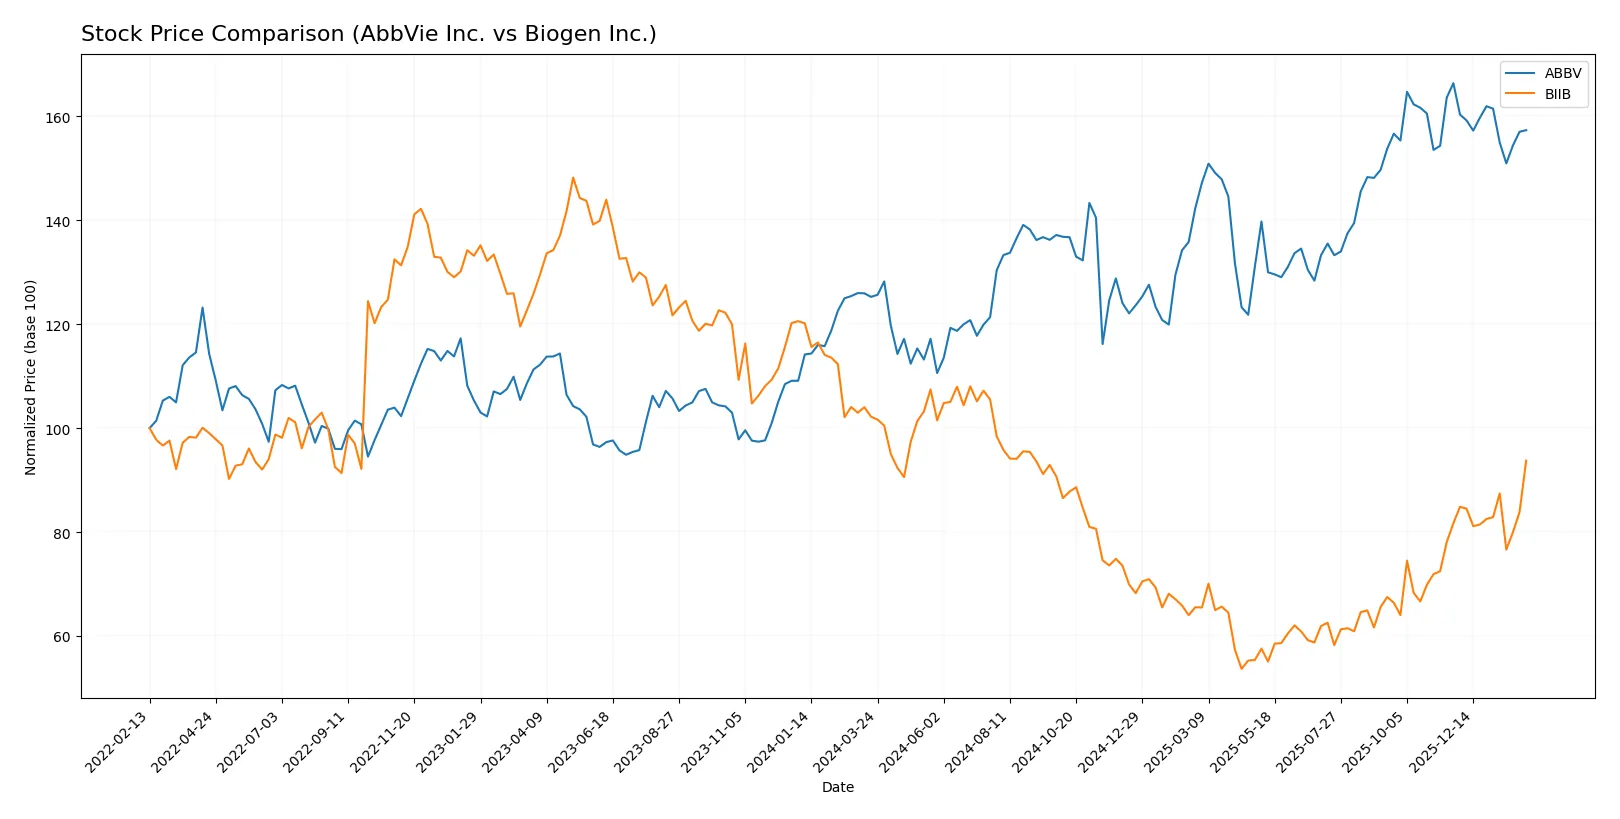
Trend Comparison
AbbVie’s stock rose 25.61% over the past 12 months, marking a bullish trend with decelerating momentum. It fluctuated between 157.06 and 236.28, reflecting moderate volatility (21.01 std dev).
Biogen’s stock fell 8.27% in the same period, indicating a bearish trend with accelerating decline. The range was wider, from 115.17 to 231.82, showing higher volatility (34.43 std dev).
AbbVie delivered the highest market performance with a strong 25.61% gain versus Biogen’s 8.27% loss, despite Biogen’s recent positive price reversal.
Target Prices
Analysts present a balanced target consensus for AbbVie Inc. and Biogen Inc., indicating moderate upside potential.
| Company | Target Low | Target High | Consensus |
|---|---|---|---|
| AbbVie Inc. | 223 | 289 | 253.18 |
| Biogen Inc. | 143 | 250 | 188.75 |
AbbVie’s consensus target at 253.18 exceeds its current 223.43 price, implying upside near 13%. Biogen’s consensus target of 188.75 sits below its 201.18 price, suggesting limited near-term appreciation.

Don’t Let Luck Decide Your Entry Point
Optimize your entry points with our advanced ProRealTime indicators. You’ll get efficient buy signals with precise price targets for maximum performance. Start outperforming now!
How do institutions grade them?
AbbVie Inc. Grades
The following table summarizes recent institutional grades for AbbVie Inc.:
| Grading Company | Action | New Grade | Date |
|---|---|---|---|
| Morgan Stanley | Maintain | Overweight | 2026-02-05 |
| UBS | Maintain | Neutral | 2026-02-05 |
| Evercore ISI Group | Maintain | Outperform | 2026-02-05 |
| Citigroup | Maintain | Neutral | 2026-01-27 |
| Wolfe Research | Downgrade | Peer Perform | 2026-01-08 |
| Morgan Stanley | Maintain | Overweight | 2025-12-12 |
| HSBC | Upgrade | Buy | 2025-12-10 |
| UBS | Maintain | Neutral | 2025-11-07 |
| Piper Sandler | Maintain | Overweight | 2025-11-05 |
| Citigroup | Maintain | Neutral | 2025-11-03 |
Biogen Inc. Grades
Institutional grades for Biogen Inc. are shown below:
| Grading Company | Action | New Grade | Date |
|---|---|---|---|
| Oppenheimer | Maintain | Outperform | 2026-01-30 |
| Citigroup | Maintain | Neutral | 2026-01-27 |
| Truist Securities | Maintain | Hold | 2026-01-08 |
| Citigroup | Maintain | Neutral | 2026-01-07 |
| Morgan Stanley | Maintain | Equal Weight | 2025-12-12 |
| HSBC | Downgrade | Reduce | 2025-12-10 |
| Wells Fargo | Maintain | Equal Weight | 2025-12-10 |
| Piper Sandler | Maintain | Neutral | 2025-11-21 |
| Stifel | Upgrade | Buy | 2025-11-06 |
| Bernstein | Maintain | Market Perform | 2025-11-03 |
Which company has the best grades?
AbbVie holds more consistent positive grades, with multiple Overweight and Outperform ratings. Biogen’s grades are mixed, including Neutral and Reduce. Investors may view AbbVie’s stronger institutional support as a signal of greater confidence.
Risks specific to each company
The following categories identify the critical pressure points and systemic threats facing both firms in the 2026 market environment:
1. Market & Competition
AbbVie Inc.
- Large pharma with diversified portfolio but high P/E signals market overvaluation risk.
Biogen Inc.
- Smaller biotech focused on neurological diseases; faces niche competition but with innovative pipeline.
2. Capital Structure & Debt
AbbVie Inc.
- Strong debt metrics but limited liquidity ratios raise caution on short-term solvency.
Biogen Inc.
- Moderate leverage and solid interest coverage support financial flexibility.
3. Stock Volatility
AbbVie Inc.
- Low beta (0.33) indicates defensive stock with limited price swings.
Biogen Inc.
- Ultra-low beta (0.16) suggests very low volatility, appealing to risk-averse investors.
4. Regulatory & Legal
AbbVie Inc.
- Faces patent expiration risks on key drugs; regulatory scrutiny on pricing.
Biogen Inc.
- Regulatory uncertainty on Alzheimer’s treatments; ongoing FDA evaluations could impact revenue.
5. Supply Chain & Operations
AbbVie Inc.
- Large scale manufacturing with complex supply chains; potential exposure to disruptions.
Biogen Inc.
- Smaller operation with specialized supply needs; more agile but vulnerable to raw material shortages.
6. ESG & Climate Transition
AbbVie Inc.
- Increasing pressure to enhance sustainability in manufacturing and reduce emissions.
Biogen Inc.
- Focus on sustainable innovation; still improving ESG disclosures and climate strategies.
7. Geopolitical Exposure
AbbVie Inc.
- Global footprint exposes it to trade tensions and regulatory divergence.
Biogen Inc.
- Primarily US-focused with some international partnerships, reducing geopolitical risk.
Which company shows a better risk-adjusted profile?
AbbVie’s highest risk stems from weak liquidity and stretched valuation, raising solvency concerns despite its size. Biogen faces regulatory uncertainty but boasts stronger financial ratios and lower leverage. Biogen’s safer Altman Z-score and favorable debt metrics indicate a better risk-adjusted profile. The stark contrast in debt-to-equity and current ratios justifies my concern about AbbVie’s short-term financial resilience.
Final Verdict: Which stock to choose?
AbbVie Inc. harnesses the power of steady cash generation and a robust gross margin, positioning it as a reliable income engine. Its heavy debt load and stretched liquidity ratios are points of vigilance. This stock suits portfolios focused on income with moderate risk tolerance.
Biogen Inc. leverages a strategic moat grounded in its innovation pipeline and recurring revenue streams. It exhibits stronger liquidity and a cleaner balance sheet than AbbVie, offering better financial stability. Biogen fits well in growth-oriented portfolios seeking a mix of safety and upside.
If you prioritize income stability and dividend reliability, AbbVie is the compelling choice due to its cash flow resilience despite leverage concerns. However, if you seek growth with a safer balance sheet and innovation edge, Biogen offers better stability and strategic upside. Both carry risks, making alignment with your investment profile essential.
Disclaimer: Investment carries a risk of loss of initial capital. The past performance is not a reliable indicator of future results. Be sure to understand risks before making an investment decision.
Go Further
I encourage you to read the complete analyses of AbbVie Inc. and Biogen Inc. to enhance your investment decisions: