In the competitive pharmaceutical landscape, AbbVie Inc. and AstraZeneca PLC stand out as industry leaders known for innovation and extensive drug portfolios. Both companies operate globally, focusing on developing therapies across oncology, immunology, and rare diseases, making them natural peers for comparison. This analysis will help investors like you identify which company currently offers the most compelling investment opportunity. Let’s explore their strengths and market positions to guide your decision.

Table of contents
Companies Overview
I will begin the comparison between AbbVie and AstraZeneca by providing an overview of these two companies and their main differences.
AbbVie Overview
AbbVie Inc. is a global pharmaceutical company focused on discovering, developing, manufacturing, and selling a broad portfolio of drugs. Its products target autoimmune diseases, oncology, and eye care, among others. Headquartered in North Chicago, Illinois, AbbVie operates with 55,000 employees and holds a strong market position with a market cap of approximately 389B USD.
AstraZeneca Overview
AstraZeneca PLC is a biopharmaceutical company headquartered in Cambridge, UK, dedicated to prescription medicines across cardiovascular, oncology, rare diseases, and respiratory therapies. With a workforce of 94,300 employees and a market cap near 293B USD, AstraZeneca emphasizes innovation through multiple collaborations and serves global markets via distributors and local offices.
Key similarities and differences
Both AbbVie and AstraZeneca operate in the drug manufacturing industry with a focus on innovative pharmaceuticals for complex diseases. While AbbVie has a more concentrated portfolio including autoimmune and oncology drugs, AstraZeneca covers a wider spectrum including rare diseases and respiratory conditions. AbbVie is US-based with fewer employees, whereas AstraZeneca is UK-based with a larger workforce and broader geographic commercial reach.
Income Statement Comparison
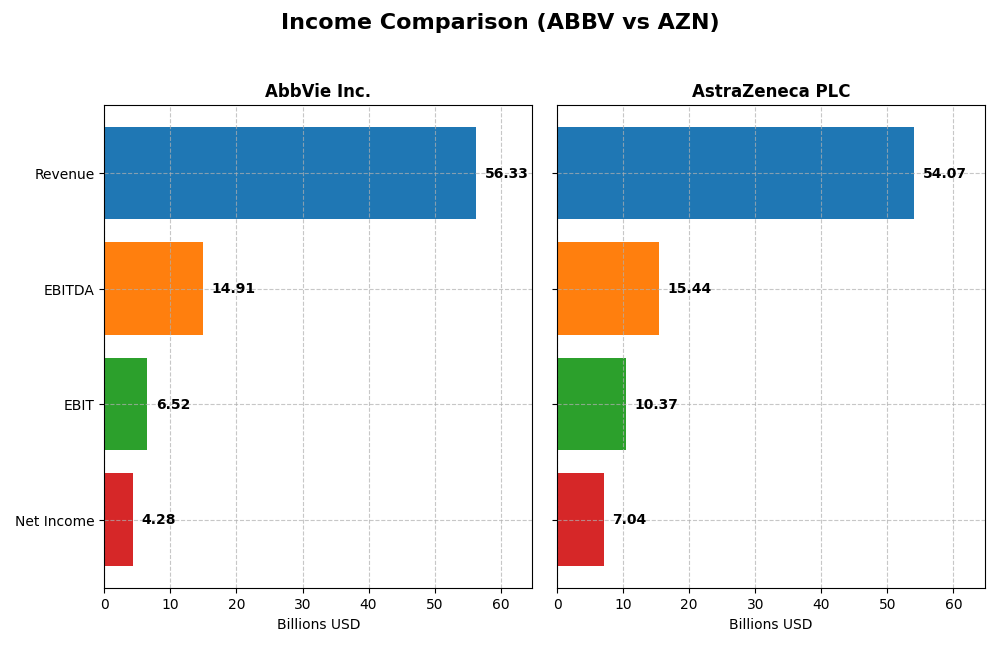
Below is a side-by-side comparison of key income statement metrics for AbbVie Inc. and AstraZeneca PLC for the fiscal year 2024.
| Metric | AbbVie Inc. (ABBV) | AstraZeneca PLC (AZN) |
|---|---|---|
| Market Cap | 389B | 293B |
| Revenue | 56.3B | 54.1B |
| EBITDA | 14.9B | 15.4B |
| EBIT | 6.5B | 10.4B |
| Net Income | 4.3B | 7.0B |
| EPS | 2.4 | 1.14 |
| Fiscal Year | 2024 | 2024 |
Income Statement Interpretations
AbbVie Inc.
AbbVie’s revenue showed a moderate overall growth of 23% from 2020 to 2024 but experienced a slight 3.7% increase in the most recent year. Net income declined by over 7% across the period and dropped again in 2024, reflecting weakening profitability. Margins, including gross and net, deteriorated overall, with a 15% net margin decline last year, signaling margin pressure despite stable gross margins near 70%.
AstraZeneca PLC
AstraZeneca demonstrated strong revenue growth, more than doubling over five years with an 18% increase in 2024 alone. Net income grew substantially by 120% overall and remained stable last year. Margins improved steadily, with gross margin exceeding 81% and net margin around 13%, reflecting enhanced operational efficiency and controlled expenses, despite a notable dip in EPS growth last year.
Which one has the stronger fundamentals?
AstraZeneca displays stronger fundamentals with robust revenue and net income growth, improved margins, and favorable operating leverage. AbbVie shows mixed signals, with revenue growth but declining net income and margins. The overall income statement evaluation favors AstraZeneca due to more consistent profitability improvement and margin expansion, while AbbVie faces challenges in sustaining earnings growth.
Financial Ratios Comparison
Below is a comparison of key financial ratios for AbbVie Inc. (ABBV) and AstraZeneca PLC (AZN) based on their most recent fiscal year data for 2024.
| Ratios | AbbVie Inc. (ABBV) | AstraZeneca PLC (AZN) |
|---|---|---|
| ROE | 128.66% | 17.25% |
| ROIC | 10.21% | 10.30% |
| P/E | 73.48 | 28.87 |
| P/B | 94.54 | 4.98 |
| Current Ratio | 0.66 | 0.93 |
| Quick Ratio | 0.55 | 0.74 |
| D/E (Debt-to-Equity) | 20.40 | 0.74 |
| Debt-to-Assets | 50.19% | 28.95% |
| Interest Coverage | 3.25 | 5.95 |
| Asset Turnover | 0.42 | 0.52 |
| Fixed Asset Turnover | 10.97 | 4.64 |
| Payout Ratio | 257.7% | 65.8% |
| Dividend Yield | 3.51% | 2.28% |
Interpretation of the Ratios
AbbVie Inc.
AbbVie shows a mixed ratio profile with strong returns on equity (128.66%) and invested capital (10.21%), but faces concerns with a low current ratio (0.66) and high debt levels (debt-to-equity 20.4). The dividend yield is attractive at 3.51%, supported by consistent payouts, though leverage and liquidity risks remain notable. Coverage by free cash flow is moderate, warranting caution.
AstraZeneca PLC
AstraZeneca exhibits favorable profitability with a 13.01% net margin and solid return on invested capital (10.3%). Its debt-to-assets ratio (28.95%) and interest coverage (6.17) indicate manageable leverage. The dividend yield stands at 2.28%, reflecting steady shareholder returns. Liquidity ratios are below 1, suggesting some caution on short-term asset coverage, but overall ratios lean positive.
Which one has the best ratios?
AstraZeneca’s ratios are generally more favorable, with better liquidity, lower leverage, and solid profitability compared to AbbVie. AbbVie presents strong return metrics but is offset by weak liquidity and high debt levels. The overall assessment favors AstraZeneca for a healthier balance of risk and return based on the 2024 fiscal year ratios.
Strategic Positioning
This section compares the strategic positioning of AbbVie and AstraZeneca, including market position, key segments, and exposure to technological disruption:
AbbVie Inc.
- Market leader in drug manufacturing with $389B market cap and low beta of 0.35, facing moderate competition.
- Diverse pharmaceutical portfolio including immunology, neuroscience, aesthetics, and virology driving revenue growth.
- Moderate exposure through research collaborations in immuno-oncology and drug development innovations.
AstraZeneca PLC
- Significant player in biopharmaceuticals with $293B market cap and very low beta of 0.193, under competitive pressure.
- Concentrated focus on oncology, cardiovascular, respiratory, and rare diseases with strong specialty care presence.
- Higher exposure via collaborations leveraging AI for drug discovery and digital pathology advancements.
AbbVie Inc. vs AstraZeneca PLC Positioning
AbbVie shows a broadly diversified portfolio spanning multiple therapeutic areas, balancing aesthetics and chronic diseases. AstraZeneca concentrates on oncology and specialty medicines, supported by AI-driven innovation partnerships. AbbVie’s diversification may reduce segment risks, while AstraZeneca’s focus enables deep specialization.
Which has the best competitive advantage?
AstraZeneca holds a very favorable moat with growing ROIC and increasing profitability, indicating durable competitive advantage. AbbVie’s moat is slightly favorable with value creation but declining ROIC, suggesting a less robust competitive position over time.
Stock Comparison
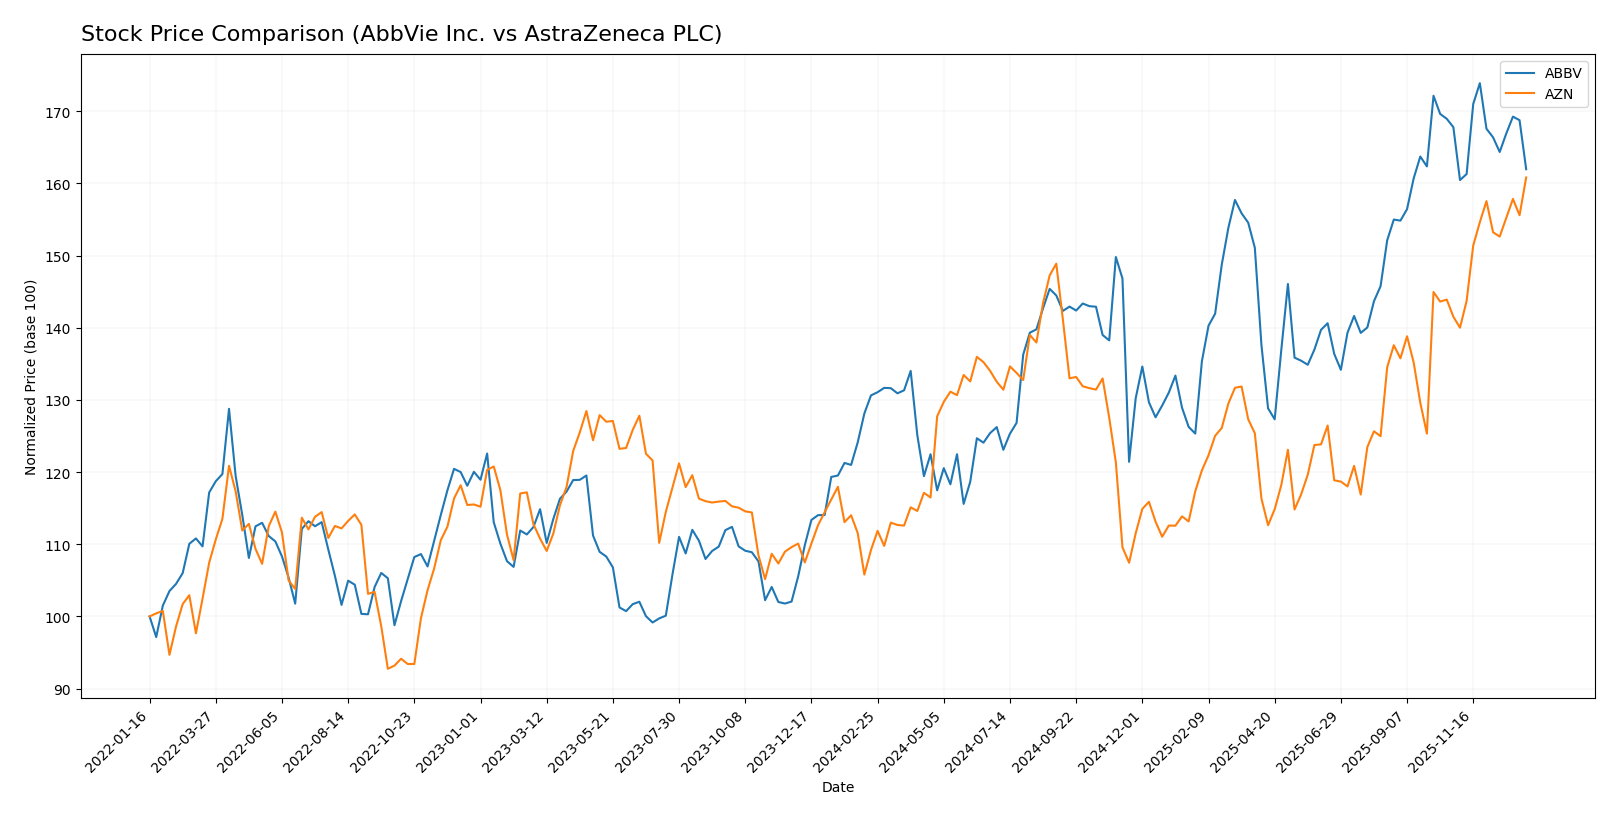
The stock price chart highlights AbbVie Inc. (ABBV) and AstraZeneca PLC (AZN) exhibiting significant upward trends over the past 12 months, with differing momentum and recent trading dynamics.
Trend Analysis
AbbVie Inc. (ABBV) showed a bullish trend over the past 12 months with a 24.0% price increase, though its momentum has decelerated. The stock ranged between 157.06 and 236.28, with notable volatility (std deviation 20.51).
AstraZeneca PLC (AZN) experienced a stronger bullish trend, gaining 47.27% in the same period, with accelerating momentum. The price fluctuated between 63.23 and 94.65, and volatility was moderate (std deviation 7.74).
Comparing both, AstraZeneca has delivered the highest market performance over the past year, with a larger price increase and accelerating trend relative to AbbVie.
Target Prices
The current analyst consensus reflects moderately optimistic target prices for both AbbVie Inc. and AstraZeneca PLC.
| Company | Target High | Target Low | Consensus |
|---|---|---|---|
| AbbVie Inc. | 289 | 240 | 258.71 |
| AstraZeneca PLC | 108 | 103 | 105.5 |
Analysts expect AbbVie’s stock to trade significantly above its current price of $220.08, while AstraZeneca’s consensus target of $105.5 also suggests upside from its current $94.65.
Analyst Opinions Comparison
This section compares analysts’ ratings and financial scores for AbbVie Inc. and AstraZeneca PLC:
Rating Comparison
AbbVie Inc. Rating
- Rating: C+, considered Very Favorable
- Discounted Cash Flow Score: 5, Very Favorable
- ROE Score: 1, Very Unfavorable
- ROA Score: 3, Moderate
- Debt To Equity Score: 1, Very Unfavorable
- Overall Score: 2, Moderate
AstraZeneca PLC Rating
- Rating: B+, considered Very Favorable
- Discounted Cash Flow Score: 4, Favorable
- ROE Score: 5, Very Favorable
- ROA Score: 4, Favorable
- Debt To Equity Score: 1, Very Unfavorable
- Overall Score: 3, Moderate
Which one is the best rated?
Based on the provided data, AstraZeneca PLC holds a higher overall rating (B+ vs. C+) and outperforms AbbVie in ROE and ROA scores. Both have the same debt to equity score, but AbbVie has a slightly better discounted cash flow score.
Scores Comparison
Here is a comparison of the key financial scores for AbbVie Inc. and AstraZeneca PLC:
AbbVie Inc. Scores
- Altman Z-Score: 2.07, in the grey zone indicating moderate bankruptcy risk.
- Piotroski Score: 7, indicating strong financial health.
AstraZeneca PLC Scores
- Altman Z-Score: 3.51, in the safe zone indicating low bankruptcy risk.
- Piotroski Score: 7, indicating strong financial health.
Which company has the best scores?
AstraZeneca has a higher Altman Z-Score, placing it in the safe zone, while AbbVie is in the grey zone. Both companies share the same strong Piotroski Score of 7. AstraZeneca thus shows a slightly better overall score profile.
Grades Comparison
The following presents a detailed comparison of the latest grades assigned to AbbVie Inc. and AstraZeneca PLC by reputable financial institutions:
AbbVie Inc. Grades
This table summarizes recent grades assigned to AbbVie Inc. by established grading companies.
| Grading Company | Action | New Grade | Date |
|---|---|---|---|
| Wolfe Research | Downgrade | Peer Perform | 2026-01-08 |
| Morgan Stanley | Maintain | Overweight | 2025-12-12 |
| HSBC | Upgrade | Buy | 2025-12-10 |
| UBS | Maintain | Neutral | 2025-11-07 |
| Piper Sandler | Maintain | Overweight | 2025-11-05 |
| Citigroup | Maintain | Neutral | 2025-11-03 |
| JP Morgan | Maintain | Overweight | 2025-11-03 |
| Guggenheim | Maintain | Buy | 2025-10-20 |
| Raymond James | Maintain | Outperform | 2025-10-17 |
| Piper Sandler | Maintain | Overweight | 2025-10-10 |
The overall trend for AbbVie shows a strong consensus around “Buy” and “Overweight” ratings, with one recent downgrade to “Peer Perform” indicating some caution.
AstraZeneca PLC Grades
This table summarizes recent grades assigned to AstraZeneca PLC by established grading companies.
| Grading Company | Action | New Grade | Date |
|---|---|---|---|
| UBS | Upgrade | Buy | 2025-02-13 |
| UBS | Upgrade | Neutral | 2024-11-20 |
| Erste Group | Upgrade | Buy | 2024-09-11 |
| TD Cowen | Maintain | Buy | 2024-08-12 |
| Argus Research | Maintain | Buy | 2024-05-30 |
| BMO Capital | Maintain | Outperform | 2024-04-26 |
| Deutsche Bank | Upgrade | Hold | 2024-04-16 |
| BMO Capital | Maintain | Outperform | 2024-02-12 |
| Deutsche Bank | Downgrade | Hold | 2024-02-08 |
| Jefferies | Downgrade | Hold | 2024-01-03 |
AstraZeneca’s grades exhibit a steady improvement over time, with multiple upgrades to “Buy” and “Outperform,” though recent downgrades to “Hold” suggest some mixed sentiment.
Which company has the best grades?
Both AbbVie and AstraZeneca hold a consensus “Buy” rating, but AbbVie’s recent grades include more “Overweight” and “Buy” ratings from major firms, while AstraZeneca shows a mix of “Buy,” “Hold,” and “Outperform” grades with some recent downgrades. Investors may interpret AbbVie’s more consistent positive grades as a sign of stronger analyst confidence relative to AstraZeneca’s more varied outlook.
Strengths and Weaknesses
Below is a comparison of key strengths and weaknesses for AbbVie Inc. (ABBV) and AstraZeneca PLC (AZN) based on the most recent financial and operational data.
| Criterion | AbbVie Inc. (ABBV) | AstraZeneca PLC (AZN) |
|---|---|---|
| Diversification | Moderate diversification with strong focus on immunology and aesthetics products, but heavy reliance on flagship drugs like HUMIRA and SKYRIZI. | Highly diversified portfolio with strong presence in oncology, cardiovascular, respiratory, and rare diseases segments. |
| Profitability | Favorable ROIC of 10.21%, but net margin is neutral at 7.59%. High ROE at 128.66%, though profitability trend is declining. | Favorable ROIC of 10.3%, net margin at 13.01%, with a positive profitability trend and solid returns on equity (17.25%). |
| Innovation | Strong innovation in immunology and neuroscience, but slower growth in ROIC signals some competitive pressure. | Robust innovation pipeline, particularly in oncology and cardiovascular, supported by growing ROIC and durable competitive advantage. |
| Global presence | Strong global footprint, especially in the US and Europe, but some exposure risks linked to product patent expirations. | Extensive global presence with diverse therapeutic areas and growing market penetration in emerging markets. |
| Market Share | Leading market share in immunology and aesthetics, but facing increasing competition and pricing pressures. | Growing market share driven by oncology and cardiovascular products, supported by strong pipeline and strategic acquisitions. |
In summary, AstraZeneca demonstrates a more favorable and growing profitability profile with better diversification and innovation momentum, whereas AbbVie retains strong profitability but faces challenges in sustaining growth due to dependency on key products and a declining ROIC trend. Investors should weigh AbbVie’s established market position against AstraZeneca’s growth potential and innovation strength.
Risk Analysis
Below is a comparative table highlighting key risks for AbbVie Inc. and AstraZeneca PLC based on the most recent financial and operational data from 2024.
| Metric | AbbVie Inc. | AstraZeneca PLC |
|---|---|---|
| Market Risk | Low beta (0.35) suggests lower volatility; however, high P/E (73.48) signals potential overvaluation risk. | Very low beta (0.193), implying minimal market volatility; moderate P/E (28.87) presents some valuation caution. |
| Debt level | High debt-to-equity ratio (20.4) and debt-to-assets (50.19%) indicate significant leverage and financial risk. | Low debt-to-equity (0.74) and moderate debt-to-assets (28.95%) show better balance sheet strength. |
| Regulatory Risk | Operates in highly regulated pharmaceutical sector with ongoing scrutiny on drug pricing and approvals. | Similar regulatory exposure globally, with additional complexity due to broader international footprint. |
| Operational Risk | Large portfolio with complex manufacturing; asset turnover low (0.42) may suggest operational inefficiencies. | More efficient asset use (0.52 asset turnover); operational risk mitigated by diversified product range. |
| Environmental Risk | Moderate risk related to pharmaceutical waste and compliance with environmental laws. | Comparable environmental risk; increasing focus on sustainability initiatives globally. |
| Geopolitical Risk | Primarily US-based operations, exposure to US policy changes and trade tensions. | Global presence including Europe, Asia, and Americas increases exposure to geopolitical uncertainties. |
In summary, AbbVie carries higher financial leverage and valuation risks, with moderate operational challenges and regulatory exposure. AstraZeneca exhibits stronger balance sheet health and operational efficiency but faces broader geopolitical and regulatory complexities. The most impactful risks are AbbVie’s high debt load and valuation concerns, alongside AstraZeneca’s geopolitical exposure given its global footprint.
Which Stock to Choose?
AbbVie Inc. shows a mixed income evolution with moderate revenue growth but declining net income and margins. Financial ratios reveal strong returns on equity and invested capital but weaknesses in liquidity and leverage, leading to a slightly unfavorable global ratio assessment. The company creates value with a ROIC above WACC, though profitability is declining, and it holds a very favorable overall rating.
AstraZeneca PLC displays robust income growth and improved profitability, with most income metrics favorable and a rising net margin. Its financial ratios are largely favorable, indicating efficient asset use and manageable debt levels. AstraZeneca maintains a very favorable global ratio opinion and demonstrates a very favorable moat with growing ROIC, supported by a strong overall rating.
Investors prioritizing durable competitive advantage and profitability might find AstraZeneca more aligned with growth and quality-focused strategies, given its favorable income and ratio trends. Conversely, those considering established value creation amid declining profitability could interpret AbbVie’s profile as fitting more conservative or income-oriented approaches.
Disclaimer: Investment carries a risk of loss of initial capital. The past performance is not a reliable indicator of future results. Be sure to understand risks before making an investment decision.
Go Further
I encourage you to read the complete analyses of AbbVie Inc. and AstraZeneca PLC to enhance your investment decisions: