Home > Comparison > Healthcare > ABBV vs AMGN
The strategic rivalry between AbbVie Inc. and Amgen Inc. shapes the competitive landscape in the healthcare sector. AbbVie operates as a capital-intensive pharmaceutical powerhouse focused on autoimmune and oncology therapies. In contrast, Amgen emphasizes innovation in human therapeutics with a diverse portfolio across inflammation and cardiovascular diseases. This analysis explores their contrasting models to identify which offers superior risk-adjusted returns for a diversified portfolio in an evolving biotech environment.
Table of contents
Companies Overview
AbbVie and Amgen dominate the global pharmaceutical landscape with distinct strengths and market approaches.
AbbVie Inc.: Specialty Pharmaceuticals Powerhouse
AbbVie stands as a leader in drug manufacturing, driven by blockbuster therapies like HUMIRA and SKYRIZI. Its revenue relies heavily on specialty biologics targeting autoimmune diseases and oncology. In 2026, AbbVie emphasizes expanding its immunology and oncology pipeline while diversifying beyond legacy products to sustain long-term growth.
Amgen Inc.: Innovator in Biotech Therapeutics
Amgen commands a strong position as a biotech pioneer, focusing on inflammation, oncology, and cardiovascular diseases. Its core revenue derives from advanced biologics such as Enbrel and Neulasta. The company’s 2026 strategy concentrates on pipeline innovation and strategic collaborations to address complex diseases and bolster its global footprint.
Strategic Collision: Similarities & Divergences
Both firms prioritize specialty biologics but diverge in their business models—AbbVie leverages a blockbuster-driven portfolio, while Amgen pursues broad therapeutic innovation and partnerships. They chiefly compete in autoimmune and oncology markets. AbbVie offers a more concentrated risk profile, whereas Amgen presents diversified exposure through its R&D collaborations and wider therapeutic areas.
Income Statement Comparison
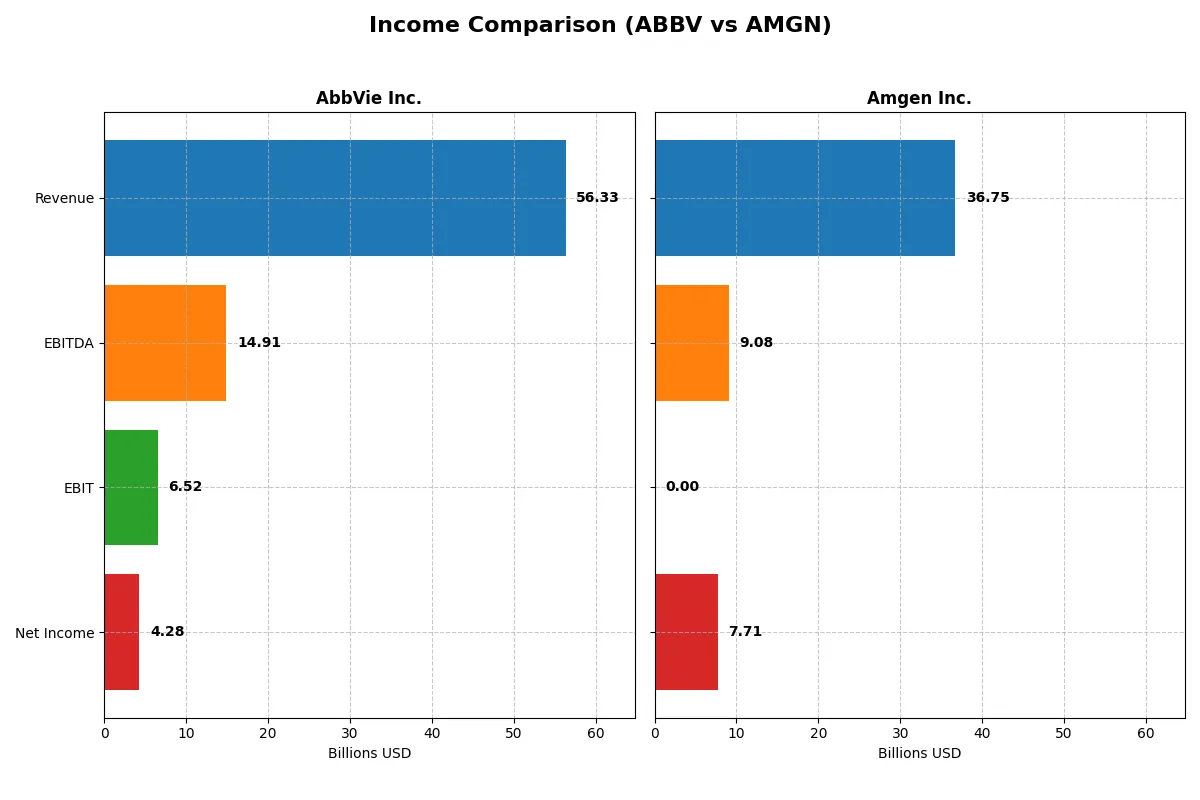
This data dissects the core profitability and scalability of both corporate engines to reveal who dominates the bottom line:
| Metric | AbbVie Inc. (ABBV) | Amgen Inc. (AMGN) |
|---|---|---|
| Revenue | 56.3B | 33.4B |
| Cost of Revenue | 16.9B | 12.9B |
| Operating Expenses | 30.3B | 13.3B |
| Gross Profit | 39.4B | 20.6B |
| EBITDA | 14.9B | 13.4B |
| EBIT | 6.5B | 7.8B |
| Interest Expense | 2.8B | 3.2B |
| Net Income | 4.3B | 4.1B |
| EPS | 2.4 | 7.6 |
| Fiscal Year | 2024 | 2024 |
Income Statement Analysis: The Bottom-Line Duel
This income statement comparison reveals which company executes its business model more efficiently and sustainably in recent years.
AbbVie Inc. Analysis
AbbVie’s revenue rose steadily to $56.3B in 2024, up 3.7% from 2023, but net income declined to $4.28B, reflecting margin pressure. Its gross margin remains robust near 70%, yet net margin contracted to 7.6%, signaling rising costs and lower profitability. Despite solid top-line growth, earnings momentum slowed sharply in 2024.
Amgen Inc. Analysis
Amgen’s revenue grew 9.95% to $36.7B in 2025, with net income surging 71% to $7.71B, showcasing strong operational leverage. Its gross margin stands at 67.3%, slightly lower than AbbVie’s, but a superior net margin of 21% highlights better cost control. Amgen’s earnings and EPS growth illustrate accelerating profitability and improved capital efficiency.
Margin Resilience vs. Earnings Momentum
AbbVie delivers higher gross margins but struggles to convert revenue growth into net income gains, showing margin erosion and weaker earnings momentum. Amgen lags slightly in gross margin but excels in net margin growth and bottom-line expansion. For investors, Amgen’s profile offers more compelling earnings momentum and margin improvement over the past year.
Financial Ratios Comparison
These vital ratios act as a diagnostic tool to expose the underlying fiscal health, valuation premiums, and capital efficiency of the companies compared below:
| Ratios | AbbVie Inc. (ABBV) | Amgen Inc. (AMGN) |
|---|---|---|
| ROE | 1.29 | 0.70 |
| ROIC | 0.09 | 0.09 |
| P/E | 73.48 | 34.48 |
| P/B | 94.54 | 23.99 |
| Current Ratio | 0.66 | 1.26 |
| Quick Ratio | 0.55 | 0.95 |
| D/E | 20.40 | 10.23 |
| Debt-to-Assets | 0.50 | 0.65 |
| Interest Coverage | 3.25 | 2.30 |
| Asset Turnover | 0.42 | 0.36 |
| Fixed Asset Turnover | 10.97 | 5.11 |
| Payout ratio | 2.58 | 1.18 |
| Dividend yield | 3.51% | 3.43% |
| Fiscal Year | 2024 | 2024 |
Efficiency & Valuation Duel: The Vital Signs
Financial ratios act as the company’s DNA, unveiling hidden risks and operational strengths behind headline numbers.
AbbVie Inc.
AbbVie shows a robust ROE at 128.7%, signaling exceptional shareholder profitability despite a modest 7.6% net margin. The stock trades at a stretched P/E of 73.5 and a high P/B of 94.5, indicating expensive valuation. AbbVie rewards shareholders with a 3.5% dividend yield, balancing payout with R&D investment.
Amgen Inc.
Amgen delivers a strong 21.0% net margin but reports zero ROE and ROIC values, limiting profitability insight. Its P/E of 22.8 appears reasonable compared to AbbVie’s stretched multiples. Amgen maintains a 2.9% dividend yield, reflecting moderate shareholder returns amid ongoing reinvestment in R&D (20% of revenue).
Premium Valuation vs. Operational Safety
AbbVie’s sky-high ROE and dividend yield contrast with its expensive valuation and weak liquidity. Amgen offers healthier margins and a fairer valuation but lacks key profitability metrics. Investors prioritizing premium returns may lean AbbVie; those seeking margin stability and valuation discipline may prefer Amgen.
Which one offers the Superior Shareholder Reward?
I compare AbbVie Inc. and Amgen Inc. on dividends, payout ratios, and buybacks to reveal total shareholder return. AbbVie yields 3.5% with a payout ratio around 85%-258%, signaling a strong, albeit highly leveraged, commitment to dividends. Amgen yields about 3%, with payout ratios near 66%-118%, indicating more conservative cash distribution. AbbVie’s free cash flow per share (~$10) supports dividends and buybacks, but high debt levels pose risks. Amgen’s free cash flow (~$15) also funds dividends and buybacks, with healthier coverage ratios and lower leverage. AbbVie’s aggressive payouts may pressure sustainability, while Amgen balances growth reinvestment and shareholder returns more prudently. I conclude Amgen offers a superior long-term total return profile with more sustainable distributions and robust cash flow.
Comparative Score Analysis: The Strategic Profile
The radar chart reveals the fundamental DNA and trade-offs of AbbVie Inc. and Amgen Inc., highlighting their core financial strengths and vulnerabilities:
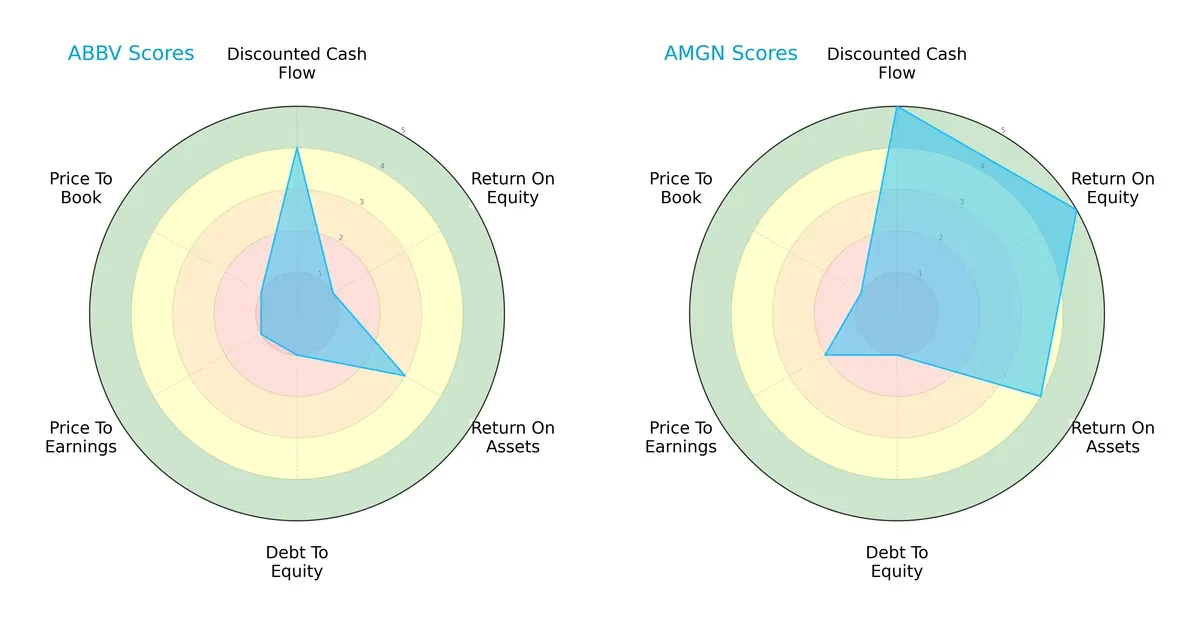
Amgen dominates in profitability metrics, with a very favorable ROE (5) and ROA (4), signaling efficient capital and asset use. AbbVie shows a moderate ROA (3) but struggles with ROE (1), indicating weaker equity returns. Both firms share a very unfavorable debt-to-equity score (1), reflecting similar leverage risks. Amgen’s DCF score (5) outperforms AbbVie’s (4), suggesting stronger cash flow prospects. Valuation scores favor Amgen slightly on P/E (2 vs. 1), but both companies suffer on P/B (1). Overall, Amgen presents a more balanced and robust profile, while AbbVie relies heavily on moderate cash flow but faces red flags in profitability and valuation.
—
Bankruptcy Risk: Solvency Showdown
The Altman Z-Score gap between AbbVie (2.06) and Amgen (2.24) places both firms in the grey zone, implying moderate bankruptcy risk amid current market conditions:
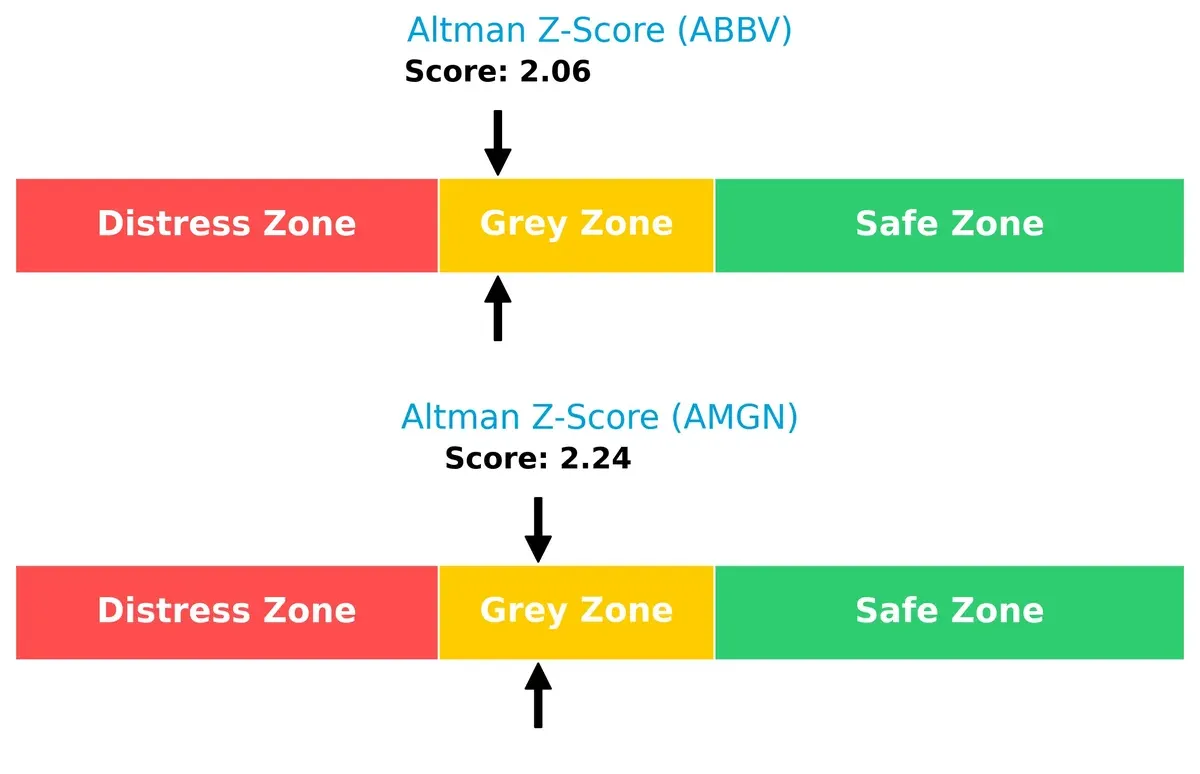
Neither company is comfortably in the safe zone, suggesting investors should monitor solvency closely. Amgen holds a slight edge, but both must navigate financial pressures prudently.
—
Financial Health: Quality of Operations
Amgen’s Piotroski score of 8 signals very strong financial health, while AbbVie’s 6 denotes average operational quality, exposing potential internal weaknesses:
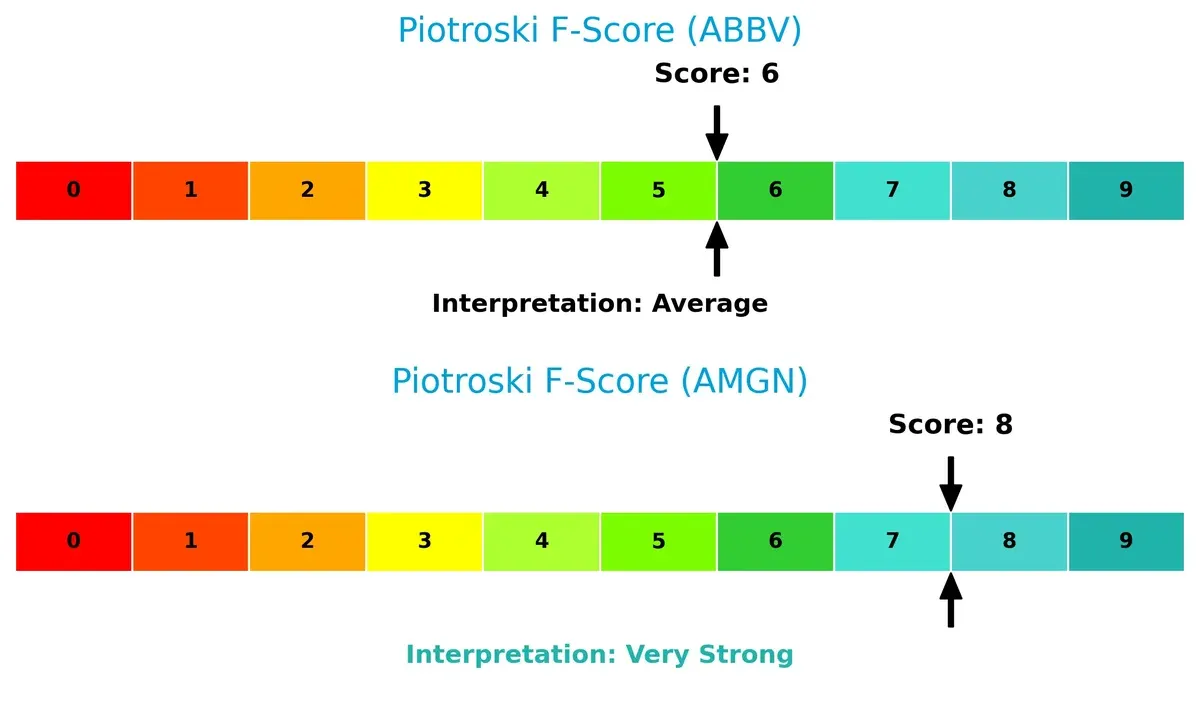
Amgen’s superior score reflects stronger profitability, liquidity, and efficiency metrics. AbbVie’s moderate score hints at internal red flags worth investigating before committing capital.
How are the two companies positioned?
This section dissects AbbVie’s and Amgen’s operational DNA by comparing their revenue distribution and internal dynamics. The goal is to confront their economic moats to identify which model delivers the most resilient competitive advantage today.
Revenue Segmentation: The Strategic Mix
This visual comparison dissects how AbbVie Inc. and Amgen Inc. diversify their income streams and reveals where their primary sector bets lie:
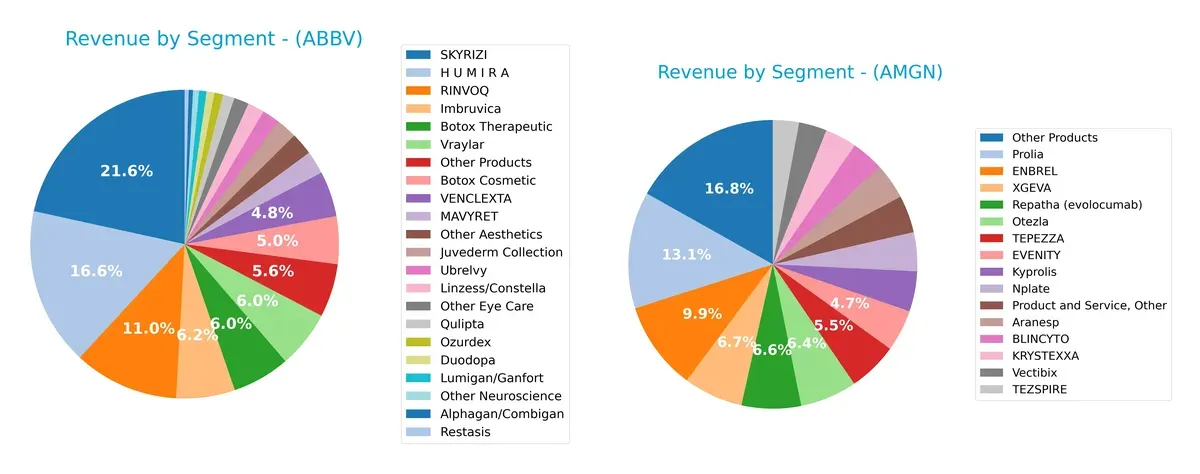
AbbVie pivots heavily on SKYRIZI at $11.7B and HUMIRA at $9B, anchoring its revenue in immunology and aesthetics. In contrast, Amgen displays a more diversified mix with its largest segment, ENBREL, at $3.3B, complemented by multiple $1B+ products like Prolia and Otezla. AbbVie’s concentration risks contrast with Amgen’s broader ecosystem, suggesting AbbVie leans on blockbuster dominance while Amgen spreads risk across several key therapies.
Strengths and Weaknesses Comparison
This table compares the strengths and weaknesses of AbbVie Inc. and Amgen Inc. based on diversification, profitability, financial statement, innovation, global presence, and market share:
AbbVie Strengths
- Diverse product portfolio with strong flagship drugs like HUMIRA and SKYRIZI
- Favorable ROE at 128.66% exceeding WACC
- High fixed asset turnover indicates efficient asset use
- Significant dividend yield at 3.51%
- Strong U.S. revenue base at $43B
Amgen Strengths
- High net margin at 20.98% reflecting operational efficiency
- Favorable P/B ratio suggests undervaluation or strong equity base
- Favorable debt metrics with zero debt-to-assets
- Broad product lineup including ENBREL and Prolia
- Solid U.S. presence with $23.8B revenue
AbbVie Weaknesses
- Unfavorable liquidity ratios below 1 indicating short-term risk
- High debt-to-assets at 50.19% raising leverage concerns
- Very high valuation multiples with P/E at 73.48 and P/B at 94.54
- Neutral net margin at 7.59% limits profitability upside
- Asset turnover low at 0.42 suggesting less efficient asset use
Amgen Weaknesses
- Zero ROE and ROIC raise concerns on capital efficiency
- Unavailable WACC impedes full cost of capital assessment
- Unfavorable liquidity ratios at 0 imply potential short-term solvency issues
- Negative interest coverage signals difficulty servicing debt
- Low asset and fixed asset turnover reduce operational efficiency
AbbVie demonstrates strong profitability and asset efficiency but carries risks from high leverage and liquidity concerns. Amgen shows better profitability margins and low leverage but faces challenges in capital return metrics and liquidity. These factors critically shape each company’s strategic financial priorities.
The Moat Duel: Analyzing Competitive Defensibility
A structural moat is the only reliable shield that protects a company’s long-term profits from relentless competition erosion:
AbbVie Inc.: Intangible Assets and Product Portfolio Moat
AbbVie’s moat rests on its strong patent-protected drugs and diversified portfolio, reflected in stable ROIC above WACC. New therapies in immunology could deepen this advantage in 2026.
Amgen Inc.: Innovation-Driven R&D Moat
Amgen’s moat stems from relentless biotech innovation, contrasting AbbVie’s portfolio stability. Despite a recent ROIC decline, its expanding pipeline and global reach fuel future growth potential.
Patent Protection vs. Innovation Pipeline: The Moat Showdown
AbbVie’s wider moat benefits from consistent value creation and patent-backed revenue. Amgen’s moat is vulnerable with declining ROIC but holds upside through R&D. AbbVie is better positioned to defend market share today.
Which stock offers better returns?
Over the past year, both AbbVie Inc. and Amgen Inc. showed strong bullish trends, with notable price gains and distinct trading volume dynamics shaping their market performance.
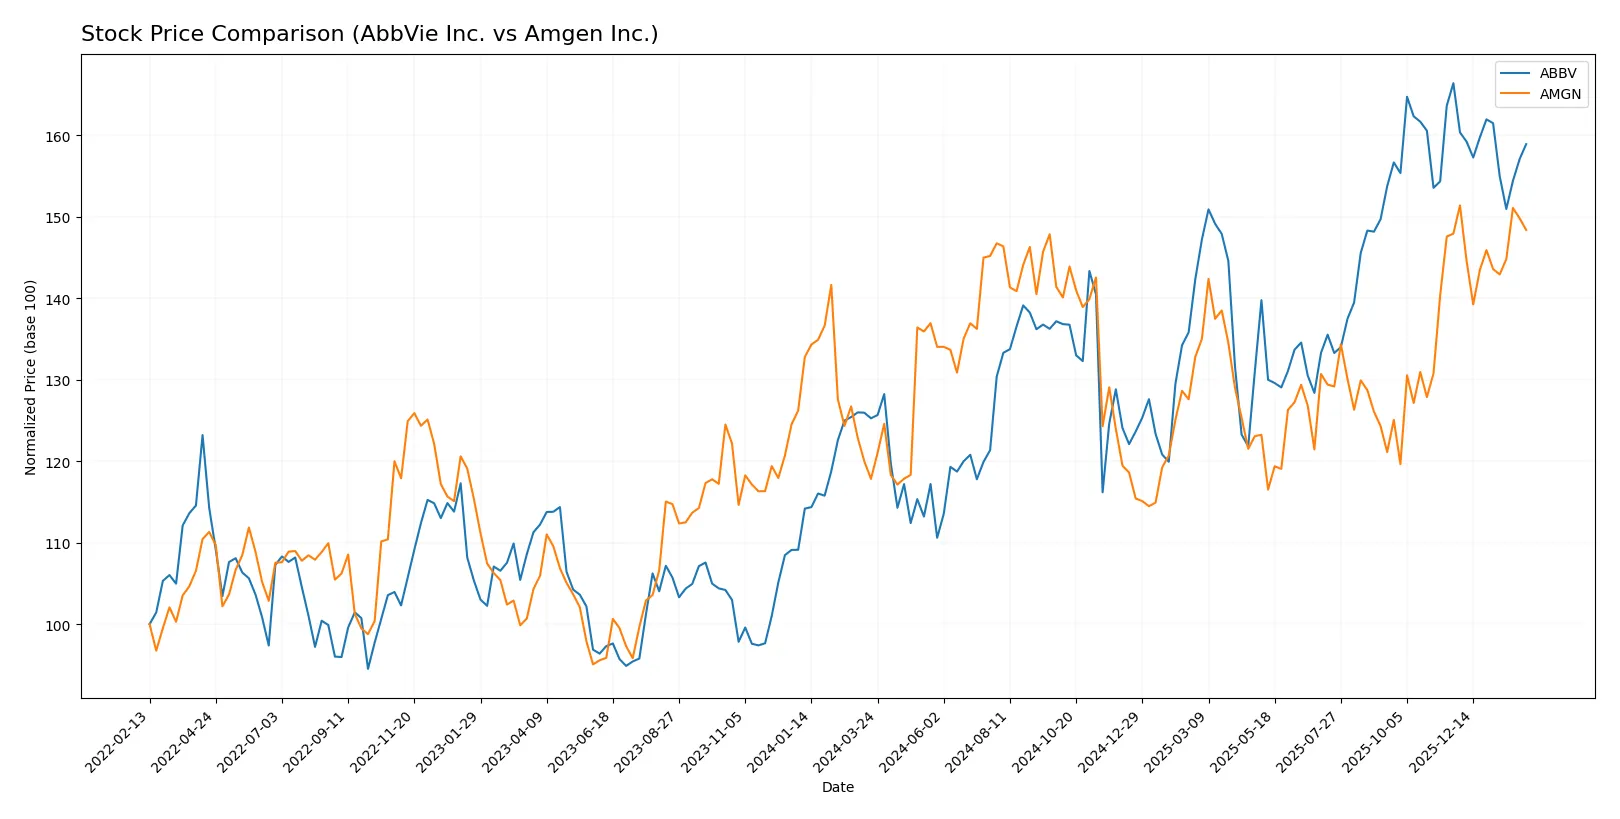
Trend Comparison
AbbVie Inc. recorded a 26.86% price increase over 12 months, reflecting a bullish trend with decelerating momentum and significant price volatility. The stock peaked at 236.28 and bottomed at 157.06.
Amgen Inc. posted a 25.93% gain in the same period, maintaining a bullish trend with accelerating momentum and slightly higher volatility. Its price ranged between 261.22 and 345.46.
Comparing trends, AbbVie and Amgen both delivered robust returns, but AbbVie’s 26.86% outpaces Amgen’s 25.93%, marking it the stronger performer over the past year.
Target Prices
Analysts present a solid target price consensus for AbbVie Inc. and Amgen Inc., indicating positive outlooks.
| Company | Target Low | Target High | Consensus |
|---|---|---|---|
| AbbVie Inc. | 223 | 289 | 256.7 |
| Amgen Inc. | 304 | 425 | 364 |
AbbVie’s consensus target of 256.7 suggests about 14% upside from the current 225.63 price. Amgen’s 364 target implies a 7.5% potential gain from 338.59.

Don’t Let Luck Decide Your Entry Point
Optimize your entry points with our advanced ProRealTime indicators. You’ll get efficient buy signals with precise price targets for maximum performance. Start outperforming now!
How do institutions grade them?
AbbVie Inc. Grades
The table below summarizes recent institutional grades for AbbVie Inc.:
| Grading Company | Action | New Grade | Date |
|---|---|---|---|
| Citigroup | Maintain | Neutral | 2026-01-27 |
| Wolfe Research | Downgrade | Peer Perform | 2026-01-08 |
| Morgan Stanley | Maintain | Overweight | 2025-12-12 |
| HSBC | Upgrade | Buy | 2025-12-10 |
| UBS | Maintain | Neutral | 2025-11-07 |
| Piper Sandler | Maintain | Overweight | 2025-11-05 |
| Citigroup | Maintain | Neutral | 2025-11-03 |
| JP Morgan | Maintain | Overweight | 2025-11-03 |
| Guggenheim | Maintain | Buy | 2025-10-20 |
| Raymond James | Maintain | Outperform | 2025-10-17 |
Amgen Inc. Grades
The table below summarizes recent institutional grades for Amgen Inc.:
| Grading Company | Action | New Grade | Date |
|---|---|---|---|
| UBS | Maintain | Buy | 2026-01-26 |
| Bernstein | Downgrade | Market Perform | 2026-01-20 |
| Truist Securities | Maintain | Hold | 2026-01-08 |
| Morgan Stanley | Maintain | Equal Weight | 2025-12-12 |
| Wells Fargo | Maintain | Equal Weight | 2025-12-10 |
| BMO Capital | Maintain | Outperform | 2025-12-03 |
| Piper Sandler | Maintain | Overweight | 2025-11-14 |
| Cantor Fitzgerald | Maintain | Neutral | 2025-11-06 |
| Wells Fargo | Maintain | Overweight | 2025-11-05 |
| Morgan Stanley | Maintain | Equal Weight | 2025-11-05 |
Which company has the best grades?
AbbVie generally receives more favorable ratings, including multiple Buy and Overweight grades. Amgen shows more Hold and Equal Weight ratings, indicating moderate optimism. This disparity may influence investors seeking stronger institutional conviction.
Risks specific to each company
The following categories identify critical pressure points and systemic threats facing AbbVie Inc. and Amgen Inc. in the 2026 market environment:
1. Market & Competition
AbbVie Inc.
- Faces intense competition in autoimmune and oncology sectors; pressure from biosimilars.
Amgen Inc.
- Competes broadly in inflammation and oncology, with strong R&D collaborations boosting pipeline.
2. Capital Structure & Debt
AbbVie Inc.
- High debt-to-assets (50.19%) signals financial leverage risk; interest coverage moderate at 2.32x.
Amgen Inc.
- Debt metrics unavailable or zero; low leverage but concern on interest coverage negative value.
3. Stock Volatility
AbbVie Inc.
- Low beta of 0.334 suggests defensive stock with limited volatility.
Amgen Inc.
- Slightly higher beta at 0.472 indicates moderate sensitivity to market swings.
4. Regulatory & Legal
AbbVie Inc.
- Regulatory scrutiny on blockbuster drugs and patent expirations pose risks.
Amgen Inc.
- Faces regulatory challenges in multiple therapeutic areas but diversified product base mitigates risk.
5. Supply Chain & Operations
AbbVie Inc.
- Operations complex with 55K employees; potential supply chain disruptions impact production.
Amgen Inc.
- Smaller workforce (28K) may allow leaner operations but higher dependency on external collaborators.
6. ESG & Climate Transition
AbbVie Inc.
- ESG initiatives not highlighted; potential exposure to climate-related regulatory changes.
Amgen Inc.
- Increasing focus on sustainable practices; collaborations suggest adaptability to ESG demands.
7. Geopolitical Exposure
AbbVie Inc.
- Global footprint exposes to trade tensions and regulatory variances.
Amgen Inc.
- Similar global exposure but diversified partnerships may reduce geopolitical risks.
Which company shows a better risk-adjusted profile?
AbbVie’s highest risk is its elevated leverage and stretched liquidity ratios, threatening financial flexibility. Amgen’s main concern lies in unclear debt and negative interest coverage, raising solvency questions. I see Amgen’s stronger profitability and Piotroski score (8 vs. 6) suggesting a better risk-adjusted profile despite its debt opacity. AbbVie’s weak liquidity metrics and high debt ratios are red flags in today’s cautious credit environment.
Final Verdict: Which stock to choose?
AbbVie’s superpower lies in its robust capital efficiency and consistent value creation, evidenced by ROIC comfortably exceeding WACC. However, its heavy leverage and low liquidity ratios remain points of vigilance. It fits well in portfolios seeking steady income with a tolerance for financial risk, typically aligned with Income & Value strategies.
Amgen’s moat is anchored in its strong revenue growth and solid gross margins, supported by a healthy balance sheet and a much better liquidity profile compared to AbbVie. It offers better financial stability while maintaining growth potential, making it suitable for Growth at a Reasonable Price (GARP) investors who want a balanced risk-return trade-off.
If you prioritize capital efficiency and dividend income, AbbVie is the compelling choice due to its proven value creation despite leverage concerns. However, if you seek growth with greater financial stability and a cleaner balance sheet, Amgen offers better stability and growth prospects, commanding a premium for its safer profile.
Disclaimer: Investment carries a risk of loss of initial capital. The past performance is not a reliable indicator of future results. Be sure to understand risks before making an investment decision.
Go Further
I encourage you to read the complete analyses of AbbVie Inc. and Amgen Inc. to enhance your investment decisions: