Home > Comparison > Healthcare > ABT vs SYK
The strategic rivalry between Abbott Laboratories and Stryker Corporation shapes the healthcare medical devices sector. Abbott operates a diversified model spanning pharmaceuticals, diagnostics, nutrition, and devices. In contrast, Stryker focuses sharply on medical technology, specializing in orthopaedics and surgical equipment. This head-to-head pits broad-based innovation against focused specialization. This analysis will determine which corporate strategy offers the superior risk-adjusted return potential for a diversified portfolio in 2026.
Table of contents
Companies Overview
Abbott Laboratories and Stryker Corporation stand as key players shaping the global medical devices market in 2026.
Abbott Laboratories: Diversified Healthcare Innovator
Abbott Laboratories commands a broad healthcare portfolio spanning pharmaceuticals, diagnostics, nutrition, and medical devices. Its core revenue derives from innovative diagnostic systems and cardiovascular devices. In 2026, Abbott sharpened its focus on expanding molecular diagnostics and remote patient monitoring to capitalize on rising demand for personalized healthcare solutions.
Stryker Corporation: Specialized Medical Technology Leader
Stryker Corporation excels in orthopaedics and surgical equipment, driving revenue through implants and advanced neurotechnology products. The company emphasizes minimally invasive surgical tools and patient care devices. In 2026, Stryker invested heavily in surgical navigation and spine implant innovations to strengthen its foothold in complex surgical procedures.
Strategic Collision: Similarities & Divergences
Both companies excel in medical devices, yet Abbott pursues a diversified healthcare approach, while Stryker specializes in orthopaedics and neurotechnology. Their primary contest unfolds in hospital contracts and surgical innovation. Abbott offers a broad healthcare investment profile; Stryker presents a focused, premium surgical technology growth story.
Income Statement Comparison
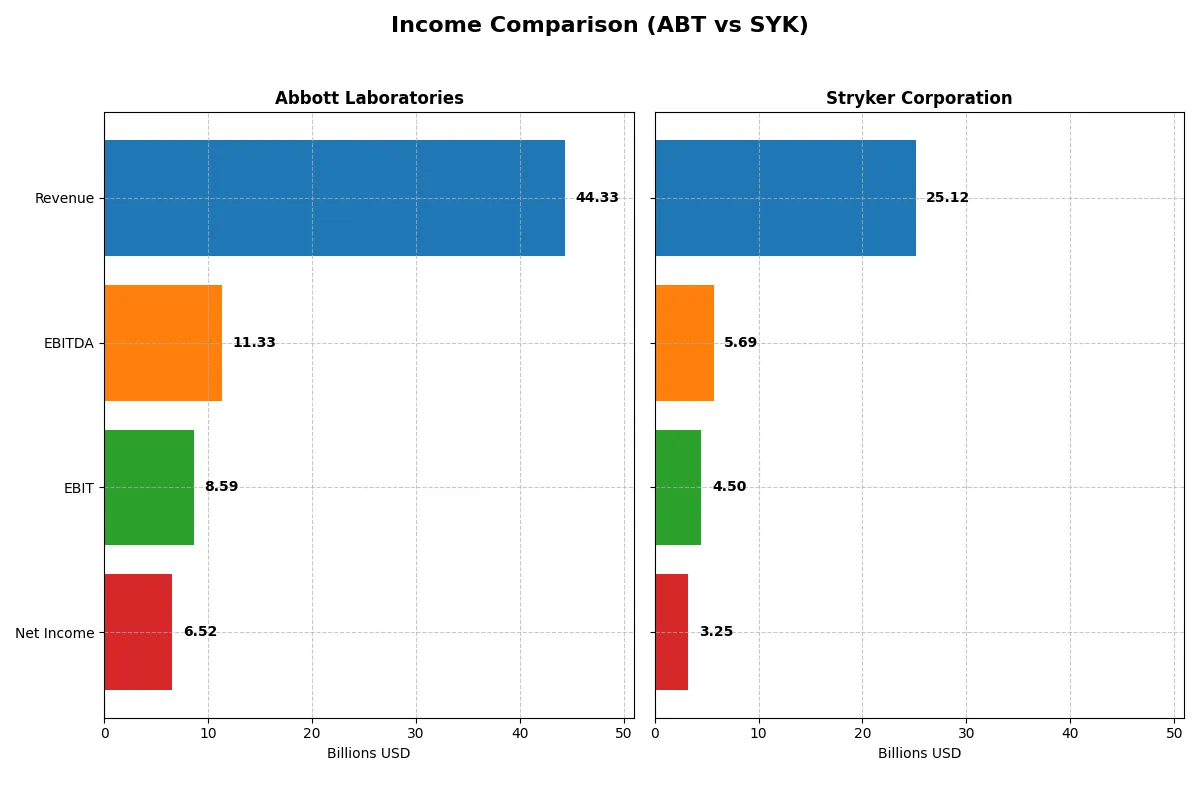
This table dissects the core profitability and scalability of both corporate engines to reveal who dominates the bottom line:
| Metric | Abbott Laboratories (ABT) | Stryker Corporation (SYK) |
|---|---|---|
| Revenue | 44.3B | 25.1B |
| Cost of Revenue | 19.7B | 9.7B |
| Operating Expenses | 16.6B | 9.8B |
| Gross Profit | 24.6B | 15.4B |
| EBITDA | 11.3B | 5.7B |
| EBIT | 8.6B | 4.5B |
| Interest Expense | 341M | 0 |
| Net Income | 6.5B | 3.2B |
| EPS | 3.74 | 8.49 |
| Fiscal Year | 2025 | 2025 |
Income Statement Analysis: The Bottom-Line Duel
This income statement comparison exposes the true operational efficiency and profitability momentum of Abbott Laboratories and Stryker Corporation.
Abbott Laboratories Analysis
Abbott’s revenue grew modestly to $44.3B in 2025, with net income declining sharply to $6.5B, reflecting a 14.7% net margin. Gross margin remains strong at 55.5%, but net margin contraction signals rising costs and pressure on bottom-line efficiency. Despite a healthy EBIT margin of 19.4%, recent margin erosion and lower EPS highlight emerging operational headwinds.
Stryker Corporation Analysis
Stryker posted robust revenue growth to $25.1B in 2025 and increased net income to $3.2B, maintaining a 12.9% net margin. The company’s gross margin stands impressively higher at 61.4%, and EBIT margin of 17.9% supports solid profitability. Growth across revenue, EBIT, and EPS demonstrates strong operational momentum and disciplined cost control, driving favorable margin expansion.
Margin Strength vs. Growth Trajectory
Abbott offers scale with higher absolute earnings, but suffers from margin and earnings declines over recent years. Conversely, Stryker displays consistent revenue and net income growth, supported by superior margin expansion. For investors prioritizing growth and margin improvement, Stryker’s profile appears more attractive given its sustained efficiency and earnings momentum.
Financial Ratios Comparison
These vital ratios act as a diagnostic tool to expose the underlying fiscal health, valuation premiums, and capital efficiency of the companies compared below:
| Ratios | Abbott Laboratories (ABT) | Stryker Corporation (SYK) |
|---|---|---|
| ROE | 28.1% (2024) | 14.5% (2024) |
| ROIC | 9.9% (2024) | 11.8% (2024) |
| P/E | 14.6 (2024) | 45.8 (2024) |
| P/B | 4.11 (2024) | 6.65 (2024) |
| Current Ratio | 1.67 (2024) | 1.95 (2024) |
| Quick Ratio | 1.23 (2024) | 1.32 (2024) |
| D/E | 0.32 (2024) | 0.68 (2024) |
| Debt-to-Assets | 18.8% (2024) | 32.9% (2024) |
| Interest Coverage | 11.3 (2024) | 12.8 (2024) |
| Asset Turnover | 0.52 (2024) | 0.53 (2024) |
| Fixed Asset Turnover | 3.58 (2024) | 5.70 (2024) |
| Payout ratio | 28.6% (2024) | 40.7% (2024) |
| Dividend yield | 1.96% (2024) | 0.89% (2024) |
| Fiscal Year | 2024 | 2024 |
Efficiency & Valuation Duel: The Vital Signs
Financial ratios act as a company’s DNA, revealing hidden risks and operational strengths behind the headline numbers.
Abbott Laboratories
Abbott demonstrates strong profitability with a favorable 14.72% net margin but reports zero ROE and ROIC, signaling potential issues in capital efficiency. Its P/E of 33.55 appears stretched relative to earnings yield. Shareholder returns include a modest 1.88% dividend yield, reflecting balanced reinvestment in R&D to sustain growth.
Stryker Corporation
Stryker maintains a solid 12.92% net margin with a neutral ROE of 14.48% and favorable ROIC of 10.1%, indicating efficient capital use. However, its high P/E of 41.38 and elevated P/B of 5.99 suggest an expensive valuation. Dividend yield is low at 0.96%, with capital likely directed toward growth initiatives.
Valuation Stretch vs. Operational Efficiency
Stryker offers better operational metrics but trades at a higher premium than Abbott, which shows profitability concerns despite a more moderate valuation. Investors seeking capital efficiency may prefer Stryker’s profile, while those wary of valuation risk might lean toward Abbott’s more conservative price.
Which one offers the Superior Shareholder Reward?
I see Abbott Laboratories (ABT) yields around 1.9% with a payout ratio near 63%, signaling a solid income stream well covered by free cash flow. ABT also returns capital aggressively via consistent buybacks, supporting long-term value. Conversely, Stryker Corporation (SYK) offers a lower yield near 0.95% but maintains a more conservative payout ratio around 40%, preserving cash for robust reinvestment and acquisitions. SYK’s higher free cash flow per share and vigorous buyback program bolster growth potential. Given ABT’s balanced yield and buybacks versus SYK’s growth-driven reinvestment, I favor ABT for superior total shareholder return in 2026.
Comparative Score Analysis: The Strategic Profile
The radar chart reveals the fundamental DNA and trade-offs of Abbott Laboratories and Stryker Corporation, highlighting their financial strengths and weaknesses:
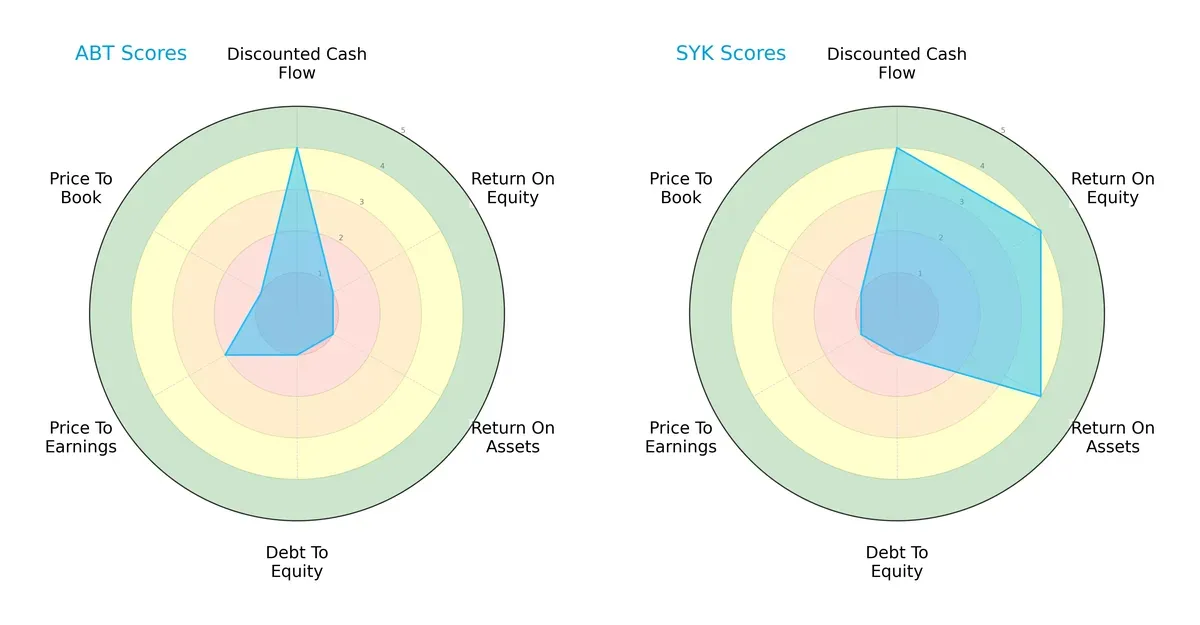
Stryker dominates in profitability metrics with ROE and ROA scores of 4 versus Abbott’s 1. Both share a strong DCF score of 4, indicating undervaluation potential. Abbott shows a more balanced price-to-earnings profile, while both struggle with debt-to-equity and price-to-book metrics. Stryker leverages operational efficiency; Abbott leans on valuation moderation.
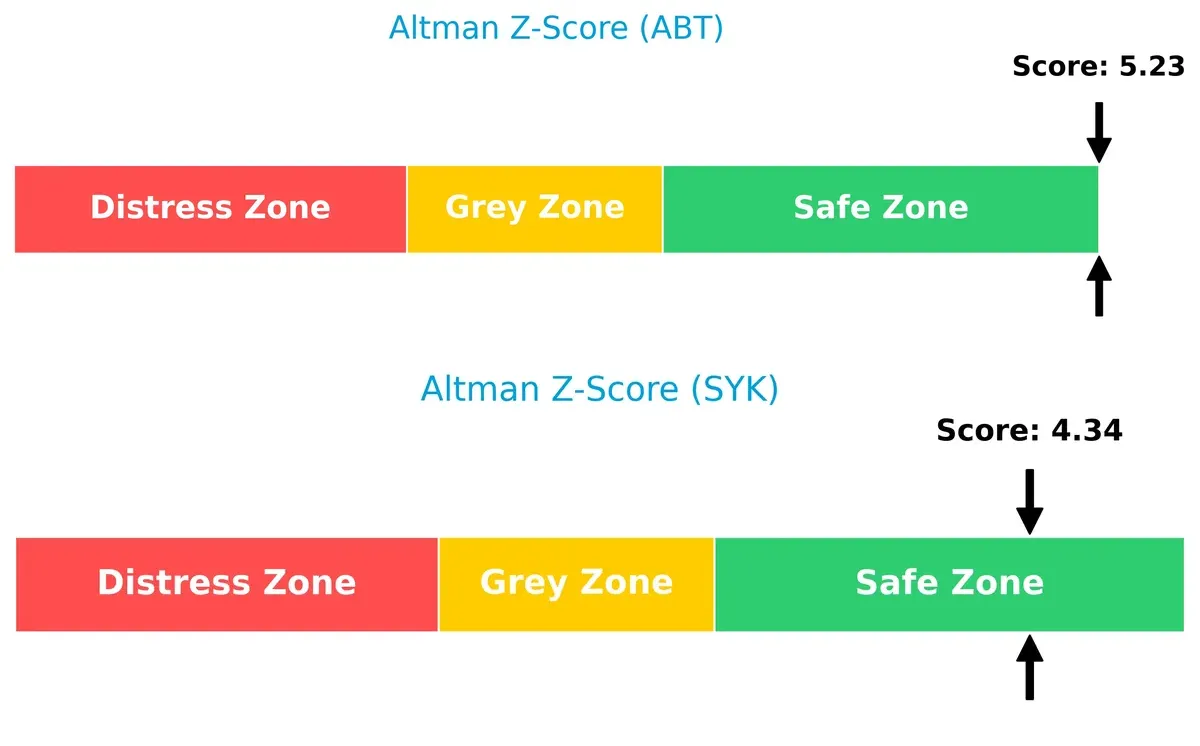
Bankruptcy Risk: Solvency Showdown
Stryker’s Altman Z-score of 4.34 and Abbott’s 5.23 both place them safely above distress thresholds, signaling strong long-term survival prospects in this market cycle:
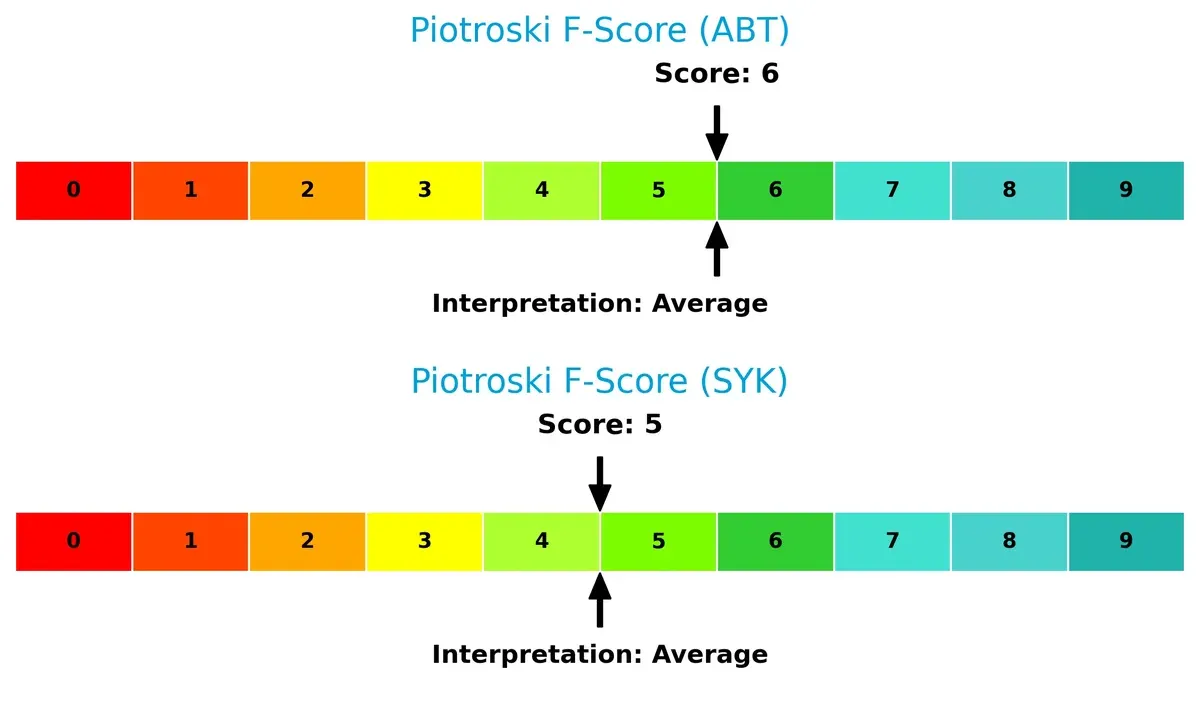
Financial Health: Quality of Operations
Abbott’s Piotroski F-Score of 6 edges out Stryker’s 5, suggesting marginally stronger internal financial controls and operational quality; neither company raises immediate red flags:
How are the two companies positioned?
This section dissects the operational DNA of Abbott Laboratories and Stryker Corporation by comparing revenue distribution and internal dynamics. The goal is to confront their economic moats to identify the more resilient competitive advantage today.
Revenue Segmentation: The Strategic Mix
The following visual comparison dissects how Abbott Laboratories and Stryker Corporation diversify their income streams and where their primary sector bets lie:
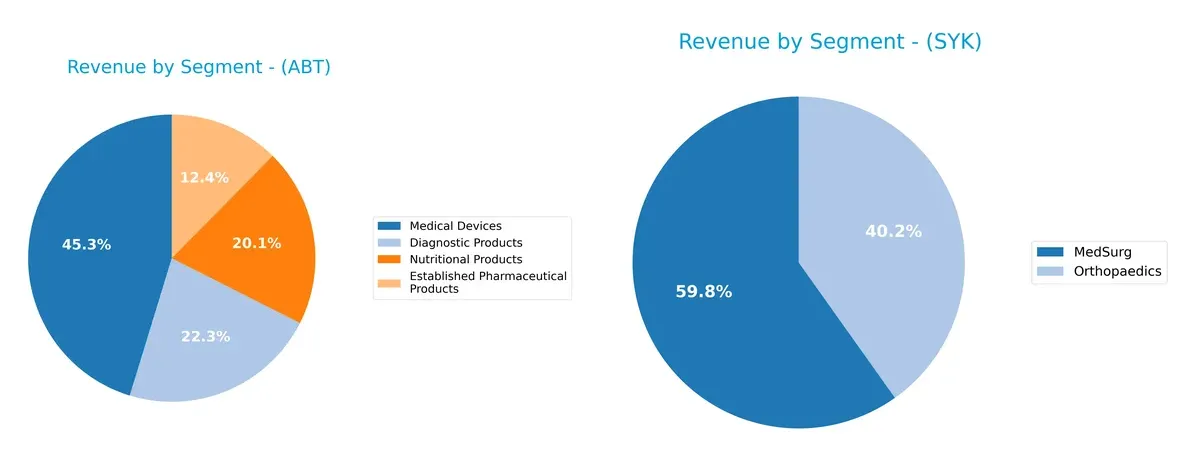
Abbott Laboratories boasts a broad revenue mix, with Medical Devices leading at $19B, followed by Diagnostic Products at $9.3B, and Nutritional Products at $8.4B. In contrast, Stryker relies heavily on two segments: MedSurg at $13.5B and Orthopaedics at $9.1B. Abbott’s diversified portfolio reduces concentration risk and leverages multiple healthcare ecosystems. Stryker’s focus anchors its strength in surgical and orthopedic infrastructure but exposes it to sector-specific cycles.
Strengths and Weaknesses Comparison
This table compares the strengths and weaknesses of Abbott Laboratories and Stryker Corporation:
Abbott Laboratories Strengths
- Diversified revenue across Diagnostics, Pharmaceuticals, Medical Devices, and Nutrition
- Strong net margin at 14.72%
- Low debt-to-asset ratio and high interest coverage
- Significant global presence with balanced US and Non-US sales
Stryker Corporation Strengths
- Favorable ROIC vs. WACC indicating efficient capital use
- Solid net margin at 12.92%
- Healthy liquidity ratios with current ratio of 1.89 and quick ratio of 1.21
- Strong fixed asset turnover and infinite interest coverage
Abbott Laboratories Weaknesses
- Unfavorable ROE and ROIC at 0%
- Poor liquidity with current and quick ratios at 0
- High P/E of 33.55 considered expensive
- Asset turnover metrics unfavorable
- Global ratios evaluation slightly unfavorable
Stryker Corporation Weaknesses
- Elevated P/E at 41.38 and high PB at 5.99 indicating premium valuation
- Moderate debt-to-equity and debt-to-assets ratios
- Dividend yield lower at 0.96%
- Some ratios marked neutral, suggesting room for improvement
Abbott shows strength in diversification and financial stability but suffers from weak profitability and liquidity metrics. Stryker demonstrates efficient capital allocation and liquidity but carries valuation and moderate leverage concerns. Both firms must navigate these trade-offs in their strategic execution.
The Moat Duel: Analyzing Competitive Defensibility
A structural moat is the only reliable shield protecting long-term profits from relentless competitive erosion:
Abbott Laboratories: Diversified Innovation Moat
Abbott’s competitive edge lies in its diversified healthcare portfolio, driven by intangible assets and R&D. Margins remain stable, though declining ROIC signals pressure. New diagnostics and medical devices in 2026 could either deepen or strain this advantage.
Stryker Corporation: Specialized Implant and Technology Moat
Stryker’s moat hinges on high switching costs and specialized surgical implants. Its ROIC exceeds WACC, indicating value creation despite a slight downward trend. Expansion in neurotechnology and surgical navigation in 2026 strengthens its competitive position relative to Abbott.
Innovation Breadth vs. Specialized Precision
Stryker holds a deeper, more quantifiable moat with ROIC above WACC and consistent value creation. Abbott’s broad innovation base faces margin pressure and declining capital efficiency. Stryker is better equipped to defend market share amid evolving healthcare demands.
Which stock offers better returns?
The past 12 months reveal contrasting stock trajectories for Abbott Laboratories and Stryker Corporation, marked by divergent price shifts and trading volume dynamics.
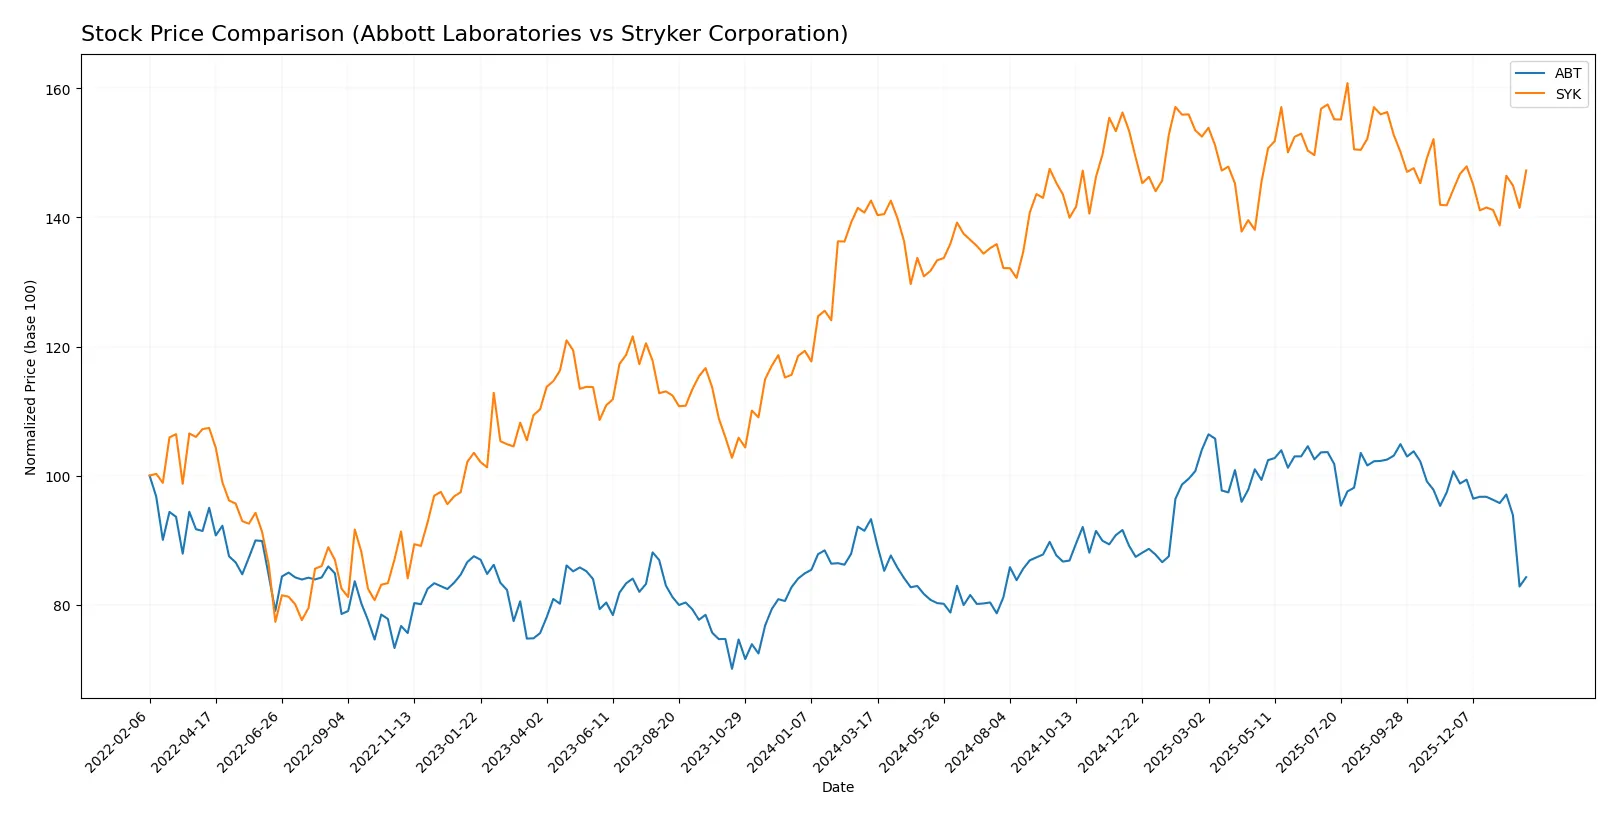
Trend Comparison
Abbott Laboratories shows a bearish trend over the past year with a -9.64% price decline and deceleration in downward momentum. The stock ranged between 102.03 and 138.01, reflecting moderate volatility (10.54 std deviation).
Stryker Corporation experienced a bullish trend with a 3.27% price increase and decelerating gains. Price volatility is higher (19.0 std deviation), with a range from 325.43 to 403.53 over the same period.
Comparing both, Stryker delivered superior market returns with a positive 3.27% gain, outperforming Abbott’s -9.64% loss over the last 12 months.
Target Prices
Analysts project solid upside potential for Abbott Laboratories and Stryker Corporation based on current consensus targets.
| Company | Target Low | Target High | Consensus |
|---|---|---|---|
| Abbott Laboratories | 120 | 169 | 137.09 |
| Stryker Corporation | 390 | 465 | 421.64 |
Abbott’s consensus target of 137.09 implies roughly 25% upside versus its 109.3 price. Stryker’s 421.64 target suggests a more pronounced 14% gain from 369.56. These targets reflect bullish analyst sentiment in medical devices.

Don’t Let Luck Decide Your Entry Point
Optimize your entry points with our advanced ProRealTime indicators. You’ll get efficient buy signals with precise price targets for maximum performance. Start outperforming now!
How do institutions grade them?
Here is a summary of recent institutional grades for Abbott Laboratories and Stryker Corporation:
Abbott Laboratories Grades
The following table lists recent grades from well-known financial institutions for Abbott Laboratories:
| Grading Company | Action | New Grade | Date |
|---|---|---|---|
| Citigroup | Maintain | Buy | 2026-01-23 |
| BTIG | Maintain | Buy | 2026-01-23 |
| Evercore ISI Group | Maintain | Outperform | 2026-01-23 |
| Bernstein | Maintain | Outperform | 2026-01-23 |
| Piper Sandler | Maintain | Overweight | 2026-01-23 |
| Oppenheimer | Maintain | Outperform | 2026-01-23 |
| RBC Capital | Maintain | Outperform | 2026-01-23 |
| Bernstein | Maintain | Outperform | 2026-01-09 |
| Barclays | Maintain | Overweight | 2026-01-05 |
| BTIG | Maintain | Buy | 2025-11-20 |
Stryker Corporation Grades
Below are recent grades from reputable firms for Stryker Corporation:
| Grading Company | Action | New Grade | Date |
|---|---|---|---|
| Needham | Maintain | Buy | 2026-01-30 |
| BTIG | Maintain | Buy | 2026-01-30 |
| Bernstein | Maintain | Outperform | 2026-01-09 |
| Citizens | Upgrade | Market Outperform | 2025-12-19 |
| Truist Securities | Maintain | Hold | 2025-12-18 |
| Citigroup | Maintain | Buy | 2025-12-11 |
| BTIG | Maintain | Buy | 2025-11-14 |
| Truist Securities | Maintain | Hold | 2025-11-14 |
| Needham | Maintain | Buy | 2025-11-14 |
| Wells Fargo | Maintain | Overweight | 2025-11-14 |
Which company has the best grades?
Abbott Laboratories consistently earns strong “Buy” and “Outperform” grades from multiple top-tier firms. Stryker also receives positive marks but includes some “Hold” ratings. Abbott’s uniform high grades suggest stronger institutional confidence, potentially attracting more investor interest.
Risks specific to each company
The following categories identify the critical pressure points and systemic threats facing both firms in the 2026 market environment:
1. Market & Competition
Abbott Laboratories
- Faces pricing pressure with a high P/E of 33.55, signaling investor caution despite favorable net margin.
Stryker Corporation
- Commands strong niche in orthopaedics but trades at a higher P/E of 41.38, reflecting stretched valuation.
2. Capital Structure & Debt
Abbott Laboratories
- Exhibits very low debt levels with favorable debt-to-equity and interest coverage ratios, signaling conservative leverage.
Stryker Corporation
- Holds moderate debt with a D/E of 0.66 and neutral debt-to-assets; interest coverage is very strong, indicating manageable risk.
3. Stock Volatility
Abbott Laboratories
- Beta at 0.72 shows lower volatility than the market, appealing for risk-averse investors.
Stryker Corporation
- Slightly higher beta of 0.896 implies more sensitivity to market swings, increasing volatility risk.
4. Regulatory & Legal
Abbott Laboratories
- Operates in multiple healthcare segments with exposure to evolving pharmaceutical and medical device regulations.
Stryker Corporation
- Faces regulatory scrutiny especially in orthopaedics and neurotechnology, with risks in product approvals and compliance.
5. Supply Chain & Operations
Abbott Laboratories
- Complex global operations with diversified product lines could face supply chain disruptions amid geopolitical tensions.
Stryker Corporation
- Relies on specialized manufacturing and distribution networks, vulnerable to operational bottlenecks and logistics disruptions.
6. ESG & Climate Transition
Abbott Laboratories
- Increasing pressure to align nutritional and pharmaceutical products with sustainability goals and climate regulations.
Stryker Corporation
- ESG commitments focus on sustainable manufacturing and reducing environmental impact in medical devices production.
7. Geopolitical Exposure
Abbott Laboratories
- Global footprint exposes it to currency fluctuations and trade policy risks, especially with emerging markets.
Stryker Corporation
- Broad international sales face risks from geopolitical instability, trade tariffs, and import/export restrictions.
Which company shows a better risk-adjusted profile?
Abbott’s single largest risk is its unfavorable return metrics and stretched valuation despite conservative leverage and lower volatility. Stryker’s main concern lies in its higher valuation multiples and moderate debt load but benefits from stronger profitability and operational metrics. Overall, Stryker presents a better risk-adjusted profile, supported by a favorable Altman Z-score and ROIC versus WACC, reflecting stronger capital efficiency. Abbott’s zero ROE and ROIC scores and very unfavorable debt-to-equity rating heighten caution despite its stable market position. The recent surge in Stryker’s stock price (+4.3%) versus Abbott’s (+3.0%) underscores market preference for Stryker’s growth and risk profile.
Final Verdict: Which stock to choose?
Abbott Laboratories demonstrates a superpower in generating strong gross and EBIT margins, reflecting solid operational efficiency. However, its declining ROIC trend and modest growth temper enthusiasm. This stock suits portfolios targeting steady income with a tolerance for cyclical earnings pressure.
Stryker Corporation’s strategic moat lies in its consistent value creation, with ROIC comfortably above WACC and robust revenue growth. Its relatively safer balance sheet and favorable income statement trends offer better stability than Abbott. This stock fits Growth at a Reasonable Price (GARP) portfolios seeking quality growth with manageable risk.
If you prioritize operational efficiency and income generation despite growth challenges, Abbott might be the compelling choice due to its margin resilience. However, if you seek durable value creation paired with stronger growth and financial stability, Stryker offers better stability and a more favorable growth trajectory. Both present distinct analytical scenarios aligned with different investor profiles.
Disclaimer: Investment carries a risk of loss of initial capital. The past performance is not a reliable indicator of future results. Be sure to understand risks before making an investment decision.
Go Further
I encourage you to read the complete analyses of Abbott Laboratories and Stryker Corporation to enhance your investment decisions: