Home > Comparison > Healthcare > ABT vs STE
The strategic rivalry between Abbott Laboratories and STERIS plc shapes the healthcare sector’s medical devices landscape. Abbott operates as a diversified healthcare giant with broad pharmaceutical and diagnostic segments. STERIS focuses on infection prevention and procedural equipment, emphasizing capital equipment and services. This analysis pits Abbott’s scale and innovation against STERIS’s specialized operational model to determine which offers superior risk-adjusted potential for a balanced portfolio.
Table of contents
Companies Overview
Abbott Laboratories and STERIS plc both command significant roles in the global medical devices market.
Abbott Laboratories: Diversified Healthcare Innovator
Abbott Laboratories leads as a global healthcare giant with a broad product portfolio spanning pharmaceuticals, diagnostics, nutrition, and medical devices. Its revenue engine hinges on developing and selling advanced diagnostics and cardiovascular devices. In 2026, Abbott emphasizes innovation in diabetes care and remote patient monitoring, reinforcing its competitive moat through diversified health solutions.
STERIS plc: Infection Prevention Specialist
STERIS plc stands out as a specialized provider of infection prevention and sterilization products. Its core revenue derives from healthcare and life sciences segments offering sterilizers, surgical equipment, and maintenance services. The company’s 2026 strategy focuses on expanding contract sterilization services and upgrading capital equipment, reflecting a commitment to operational excellence in sterile processing.
Strategic Collision: Similarities & Divergences
Abbott pursues a broad, diversified healthcare model, while STERIS concentrates on a focused infection prevention niche. Their primary battleground lies in supplying medical devices to hospitals, but Abbott competes across multiple healthcare verticals. Investors face distinct profiles: Abbott offers scale and innovation breadth, whereas STERIS delivers specialization with steady service-driven cash flow.
Income Statement Comparison
The following data dissects the core profitability and scalability of both corporate engines to reveal who dominates the bottom line:
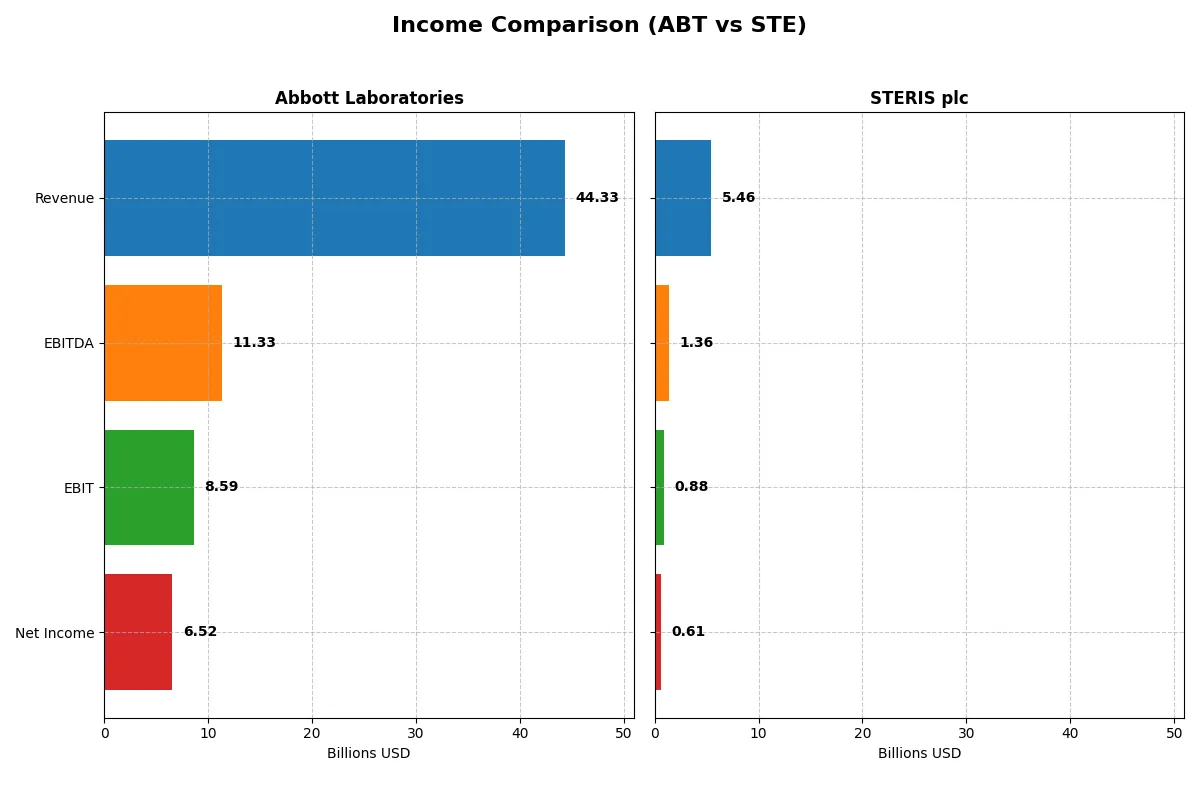
| Metric | Abbott Laboratories (ABT) | STERIS plc (STE) |
|---|---|---|
| Revenue | 44.3B | 5.46B |
| Cost of Revenue | 19.7B | 3.06B |
| Operating Expenses | 16.6B | 1.54B |
| Gross Profit | 24.6B | 2.40B |
| EBITDA | 11.3B | 1.36B |
| EBIT | 8.59B | 882M |
| Interest Expense | 341M | 86M |
| Net Income | 6.52B | 615M |
| EPS | 3.74 | 6.24 |
| Fiscal Year | 2025 | 2025 |
Income Statement Analysis: The Bottom-Line Duel
The following income statement comparison reveals which company operates its business more efficiently and sustains profitability over time.
Abbott Laboratories Analysis
Abbott Laboratories’ revenue rose steadily from $43B in 2021 to $44.3B in 2025, showing modest growth. Gross margin remains robust at 55.5%, reflecting strong product pricing and cost control. However, net income dipped sharply in 2025 to $6.5B from a peak of $13.4B in 2024, signaling margin pressure despite a 12.7% EBIT growth. Efficiency gains slowed amid rising operating expenses.
STERIS plc Analysis
STERIS plc’s revenue surged 75.7% over five years, reaching $5.46B in 2025. Its gross margin improved to 44%, demonstrating solid cost management in a growing business. Net income grew 54.7% overall, reaching $615M in 2025, with a notable 63% EPS jump last year. EBIT margin at 16.2% shows operational resilience, though growth is tempered by rising expenses outpacing revenue gains.
Margin Strength vs. Growth Momentum
Abbott leads in margin quality with higher gross and EBIT margins, but suffers from volatile net income and shrinking net margins. STERIS delivers superior revenue and net income growth, though with thinner margins. For investors, Abbott’s profile suits those prioritizing profitability stability, while STERIS appeals to growth-focused portfolios willing to tolerate margin compression.
Financial Ratios Comparison
These vital ratios act as a diagnostic tool to expose the underlying fiscal health, valuation premiums, and capital efficiency of the companies compared below:
| Ratios | Abbott Laboratories (ABT) | STERIS plc (STE) |
|---|---|---|
| ROE | 28.1% (2024) | 9.31% (2025) |
| ROIC | 9.89% (2024) | 7.17% (2025) |
| P/E | 14.6x (2024) | 36.3x (2025) |
| P/B | 4.11x (2024) | 3.38x (2025) |
| Current Ratio | 1.67 (2024) | 1.96 (2025) |
| Quick Ratio | 1.23 (2024) | 1.39 (2025) |
| D/E | 0.32 (2024) | 0.33 (2025) |
| Debt-to-Assets | 18.8% (2024) | 21.7% (2025) |
| Interest Coverage | 11.3x (2024) | 10.0x (2025) |
| Asset Turnover | 0.52 (2024) | 0.54 (2025) |
| Fixed Asset Turnover | 3.58 (2024) | 2.58 (2025) |
| Payout Ratio | 28.6% (2024) | 35.8% (2025) |
| Dividend Yield | 1.96% (2024) | 0.98% (2025) |
| Fiscal Year | 2024 | 2025 |
Efficiency & Valuation Duel: The Vital Signs
Ratios act as a company’s DNA, revealing hidden risks and operational excellence critical for investment decisions.
Abbott Laboratories
Abbott Laboratories shows a strong net margin at 14.72%, but its ROE and ROIC remain at zero, signaling weak capital efficiency. The stock trades at a stretched P/E of 33.55, reflecting high valuation. Shareholders receive a modest 1.88% dividend yield, suggesting a balanced return with some income focus rather than aggressive reinvestment.
STERIS plc
STERIS posts a favorable net margin of 11.26% with a modest ROE of 9.31% and neutral ROIC near 7.17%. The stock appears expensive, trading at a P/E of 36.35 and a high P/B ratio of 3.38. Dividend yield stands low at 0.98%, indicating limited income return amid ongoing reinvestment for growth.
Premium Valuation vs. Operational Safety
STERIS offers slightly better operational safety with a favorable current ratio and debt metrics, while Abbott’s valuation is less stretched but shows weaker returns on equity and capital. Investors seeking modest income and a stable margin may lean toward Abbott; those prioritizing balance sheet strength and growth might prefer STERIS.
Which one offers the Superior Shareholder Reward?
I see Abbott Laboratories (ABT) delivers a 1.96% dividend yield with a prudent 29% payout ratio, backed by strong free cash flow coverage. Its steady buyback program supports shareholder returns sustainably. STERIS plc (STE) yields just 0.98%, with a higher 53% payout ratio and smaller buybacks, risking cash flow strain. ABT’s balanced dividends and consistent buybacks offer a more reliable, attractive total return profile in 2026.
Comparative Score Analysis: The Strategic Profile
The radar chart reveals the fundamental DNA and trade-offs of Abbott Laboratories and STERIS plc, highlighting their financial strengths and weaknesses:
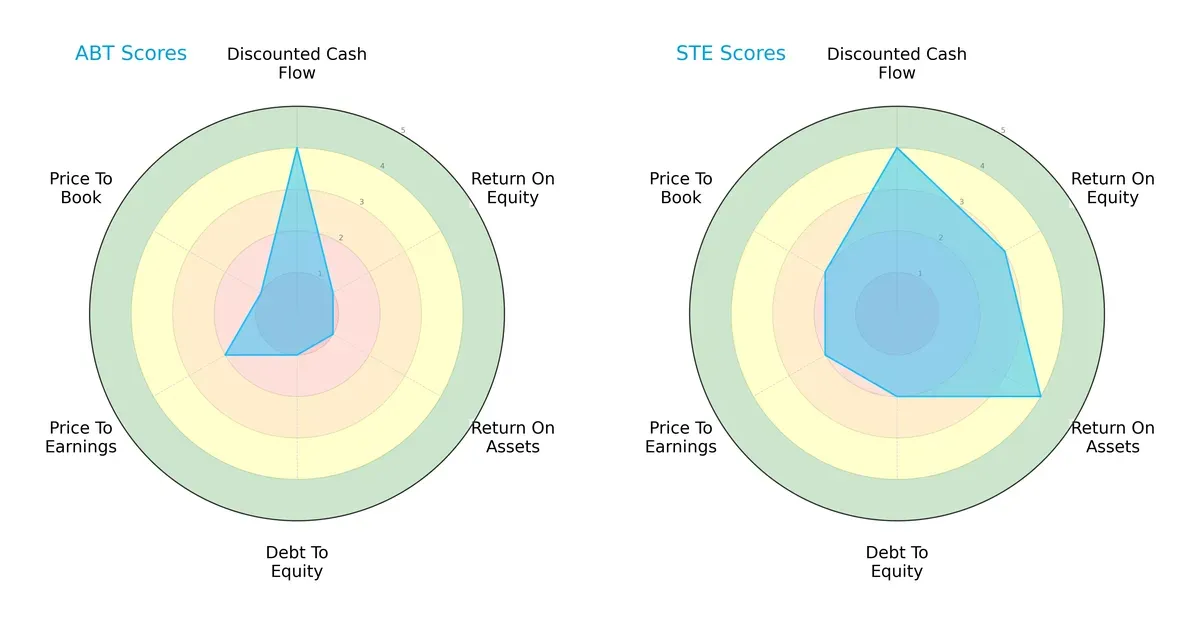
STERIS shows a more balanced profile with favorable scores in ROE (3 vs. 1), ROA (4 vs. 1), and Debt/Equity (2 vs. 1). Abbott relies mainly on a strong DCF score (4 each) but struggles with profitability and leverage metrics. STERIS’s diversified strengths suggest a more resilient operational model compared to Abbott’s concentrated edge.
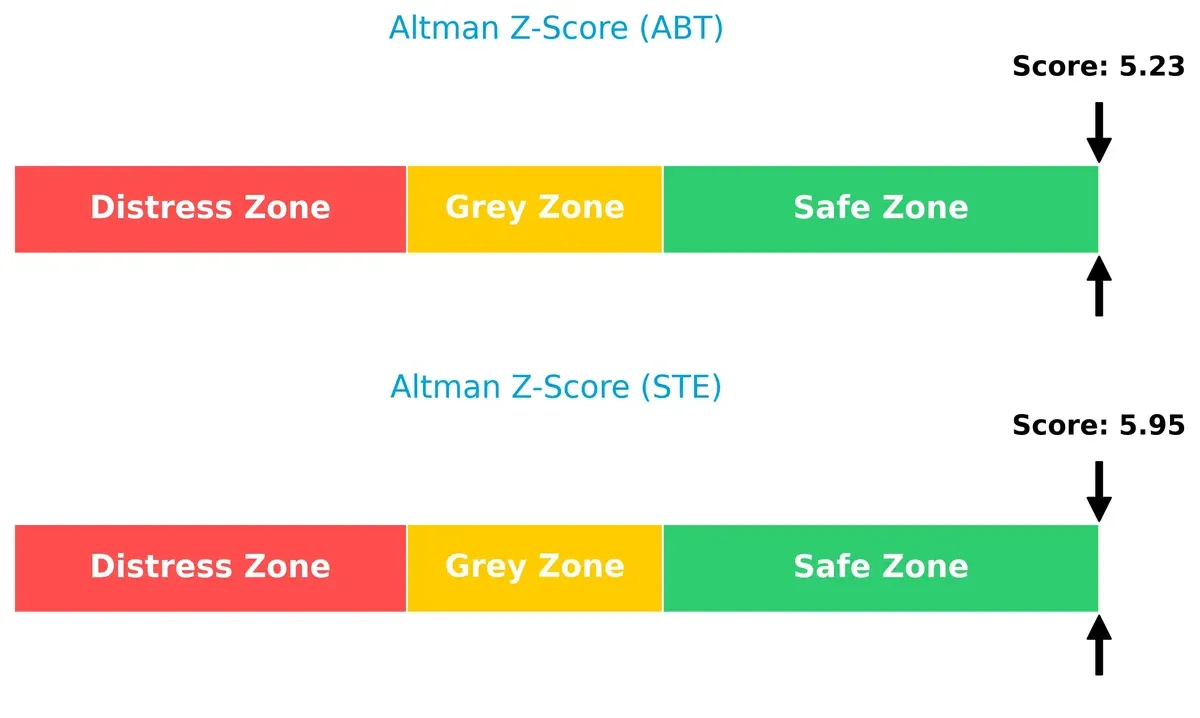
Bankruptcy Risk: Solvency Showdown
STERIS holds a slightly higher Altman Z-Score (5.95) than Abbott (5.23), both well within the safe zone, indicating robust long-term solvency in this economic cycle:
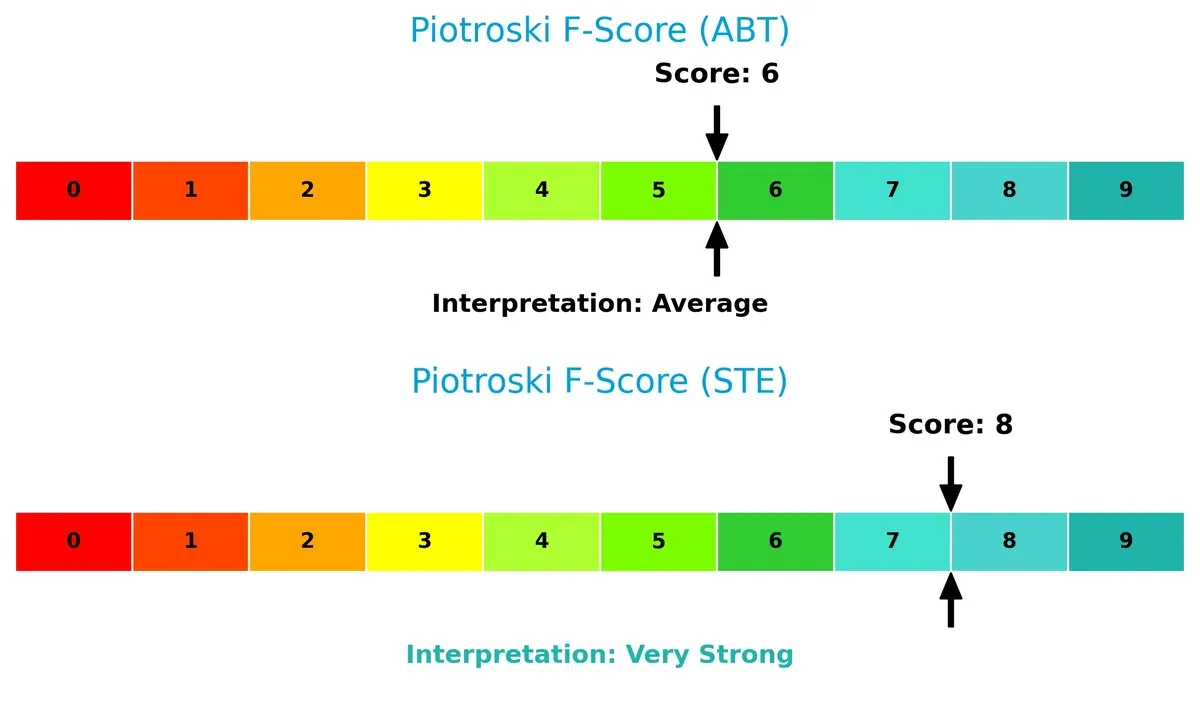
Financial Health: Quality of Operations
STERIS’s Piotroski F-Score of 8 signals very strong financial health, outperforming Abbott’s average score of 6, which may indicate some internal weaknesses in profitability or efficiency:
How are the two companies positioned?
This section dissects Abbott and STERIS’s operational DNA by comparing revenue distribution and internal dynamics. The goal is to confront their economic moats and reveal which model offers the most resilient competitive advantage today.
Revenue Segmentation: The Strategic Mix
This visual comparison dissects how Abbott Laboratories and STERIS plc diversify their income streams and where their primary sector bets lie:
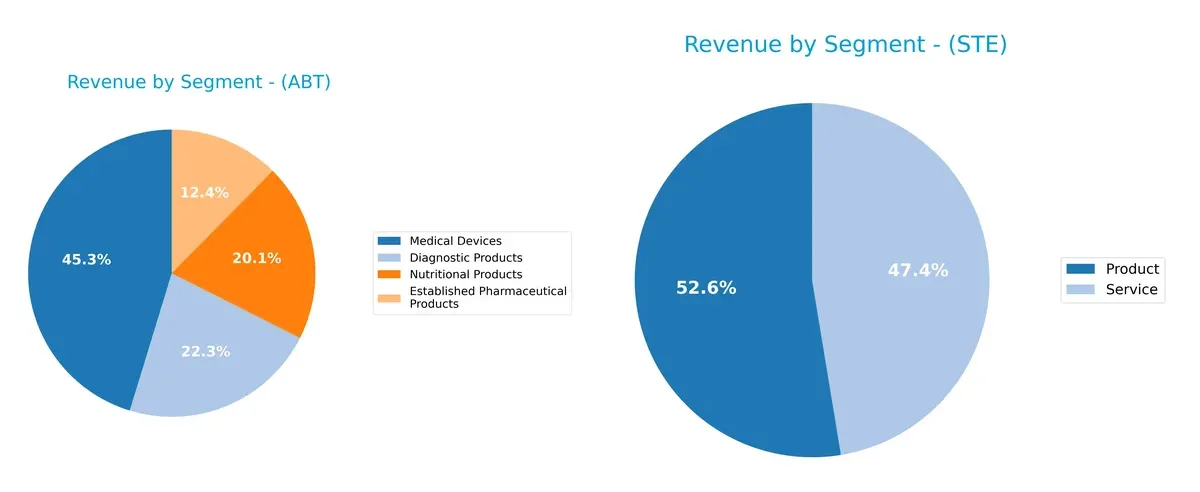
I observe Abbott Laboratories anchors its revenue in Medical Devices at $19B, with strong contributions from Diagnostic Products ($9.3B), Nutritional Products ($8.4B), and Established Pharmaceuticals ($5.2B). This mix reflects a balanced ecosystem with reduced concentration risk. In contrast, STERIS relies heavily on two nearly equal segments: Product ($2.9B) and Service ($2.6B), showing a focus on integrated solutions but less diversification across industries. Abbott’s breadth signals infrastructure dominance; STERIS pivots on specialized offerings.
Strengths and Weaknesses Comparison
This table compares the strengths and weaknesses of Abbott Laboratories and STERIS plc based on diversification, profitability, financials, innovation, global presence, and market share:
Abbott Laboratories Strengths
- Diversified revenue streams across Medical Devices, Diagnostics, Nutrition, and Pharmaceuticals
- Strong global presence with nearly balanced US and Non-US sales
- Favorable net margin at 14.72%
- Low debt and solid interest coverage ratio
STERIS plc Strengths
- Balanced revenue from Products and Services segments
- Favorable net margin at 11.26%
- Strong liquidity with current ratio near 2.0
- Moderate leverage with favorable debt-to-assets ratio
- Positive interest coverage ratio
Abbott Laboratories Weaknesses
- Low or unavailable ROE and ROIC, indicating weak capital efficiency
- Unfavorable liquidity ratios (current and quick)
- High P/E ratio of 33.55 signals expensive valuation
- Asset turnover ratios are unfavorable, hinting at inefficient asset use
STERIS plc Weaknesses
- Unfavorable P/E and P/B ratios indicate premium valuation
- ROE below 10%, reflecting moderate profitability
- Dividend yield under 1%, less attractive for income investors
Abbott Laboratories demonstrates a broad diversified business and strong profitability but shows signs of capital allocation inefficiency and liquidity concerns. STERIS balances solid financial health and liquidity but trades at a premium with moderate returns on equity and limited income appeal. These contrasts highlight distinct strategic priorities and operational challenges.
The Moat Duel: Analyzing Competitive Defensibility
A structural moat is the only true shield protecting long-term profits from relentless competitive erosion. Let’s dissect Abbott Laboratories and STERIS plc moats:
Abbott Laboratories: Diversified Innovation & Intangible Assets
Abbott’s moat stems from its broad product portfolio and strong intangible assets like patents and diagnostics technology. It sustains high gross margins (55.5%) and stable EBIT margins (19.4%). However, declining ROIC signals pressure on its competitive edge by 2026.
STERIS plc: Niche Specialization & Service Integration
STERIS leverages specialized infection prevention products combined with service contracts. Unlike Abbott, it shows growing ROIC despite marginally lower margins (44.0% gross, 16.2% EBIT). Its expanding service network could deepen its moat by disrupting sterile processing.
Moat Strength: Innovation Breadth vs. Service Depth
STERIS holds a slightly unfavorable moat with improving profitability, while Abbott’s moat health is unclear amid declining ROIC. I see STERIS better positioned to defend and grow its market share in 2026.
Which stock offers better returns?
The past year reveals contrasting trajectories: Abbott Laboratories’ shares fell nearly 10%, signaling a bearish trend with decelerating losses, while STERIS plc posted a 12.4% gain despite slowing momentum.
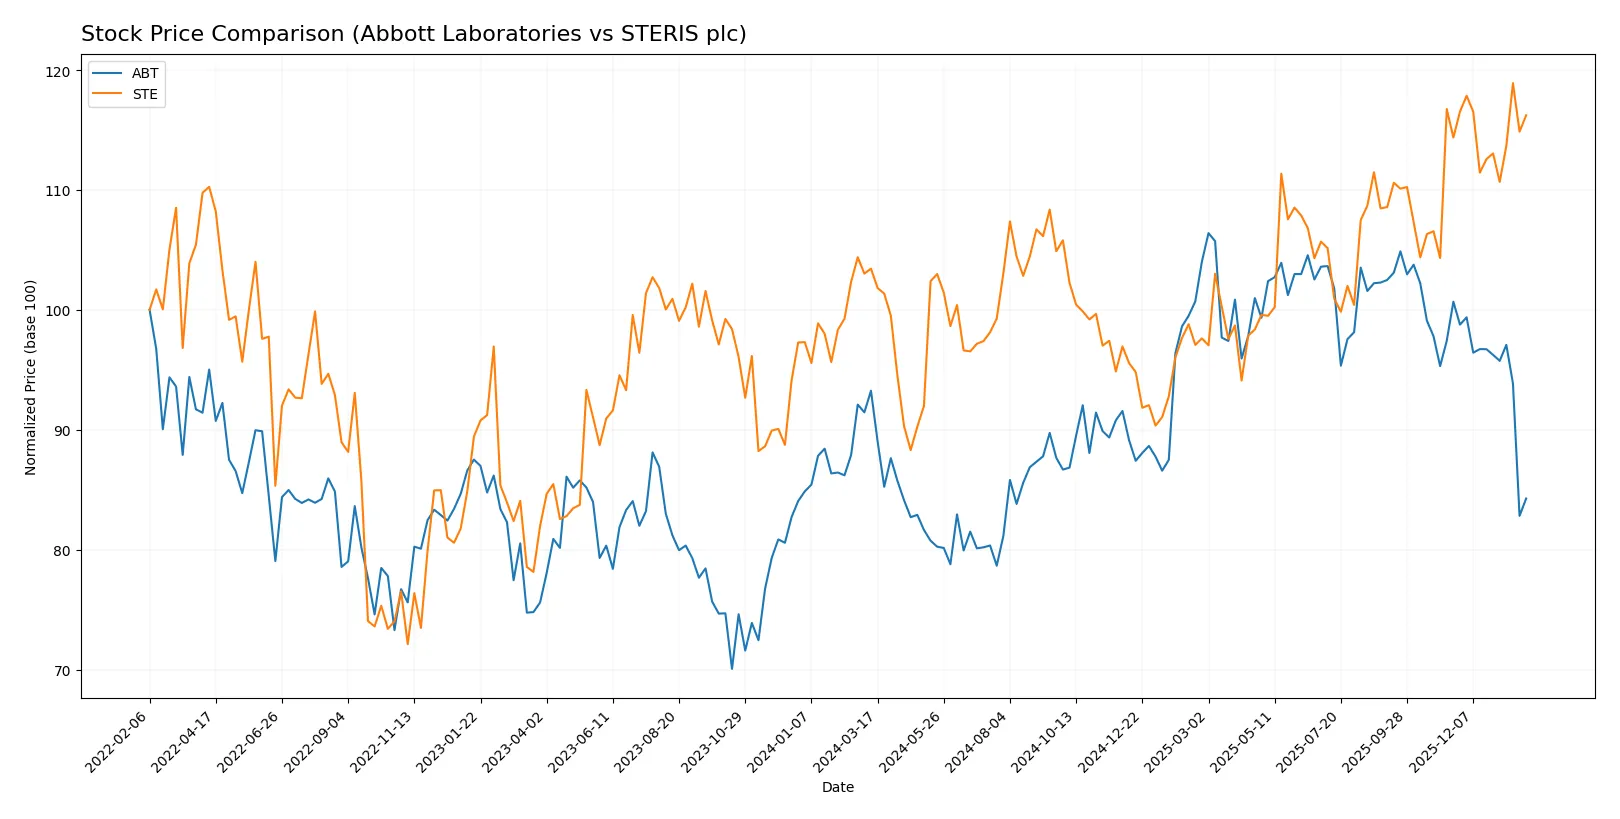
Trend Comparison
Abbott Laboratories’ stock declined 9.64% over the past 12 months, confirming a bearish trend with decelerating price drops and a wide trading range between $102 and $138. Its recent trend worsened, dropping 16.3% in about two and a half months.
STERIS plc’s shares rose 12.37% in the last year, marking a bullish trend despite deceleration. The stock’s volatility is higher, fluctuating between $199 and $269. Recent gains slowed to 1.62%, nearly neutral.
Comparing both, STERIS delivered stronger market performance, gaining 12.4% versus Abbott’s 9.6% loss over the past year.
Target Prices
Analysts present a confident consensus on target prices for Abbott Laboratories and STERIS plc.
| Company | Target Low | Target High | Consensus |
|---|---|---|---|
| Abbott Laboratories | 120 | 169 | 137.09 |
| STERIS plc | 245 | 265 | 256.67 |
Abbott’s consensus target of 137.09 implies roughly 25% upside from the current 109.3 price. STERIS’s 256.67 target aligns closely with its current 262.6 price, suggesting limited near-term gains.

Don’t Let Luck Decide Your Entry Point
Optimize your entry points with our advanced ProRealTime indicators. You’ll get efficient buy signals with precise price targets for maximum performance. Start outperforming now!
How do institutions grade them?
Abbott Laboratories Grades
The following table summarizes recent institutional grades for Abbott Laboratories:
| Grading Company | Action | New Grade | Date |
|---|---|---|---|
| Citigroup | Maintain | Buy | 2026-01-23 |
| BTIG | Maintain | Buy | 2026-01-23 |
| Evercore ISI Group | Maintain | Outperform | 2026-01-23 |
| Bernstein | Maintain | Outperform | 2026-01-23 |
| Piper Sandler | Maintain | Overweight | 2026-01-23 |
| Oppenheimer | Maintain | Outperform | 2026-01-23 |
| RBC Capital | Maintain | Outperform | 2026-01-23 |
| Bernstein | Maintain | Outperform | 2026-01-09 |
| Barclays | Maintain | Overweight | 2026-01-05 |
| BTIG | Maintain | Buy | 2025-11-20 |
STERIS plc Grades
The following table summarizes recent institutional grades for STERIS plc:
| Grading Company | Action | New Grade | Date |
|---|---|---|---|
| Morgan Stanley | Maintain | Overweight | 2025-08-08 |
| Keybanc | Maintain | Overweight | 2025-07-22 |
| Morgan Stanley | Upgrade | Overweight | 2025-07-15 |
| Morgan Stanley | Maintain | Equal Weight | 2025-05-19 |
| JMP Securities | Maintain | Market Outperform | 2025-05-16 |
| Stephens & Co. | Maintain | Overweight | 2025-05-15 |
| Morgan Stanley | Maintain | Equal Weight | 2025-05-12 |
| JMP Securities | Maintain | Market Outperform | 2025-04-10 |
| Needham | Maintain | Hold | 2025-04-07 |
| Stephens & Co. | Maintain | Overweight | 2025-02-06 |
Which company has the best grades?
Abbott Laboratories consistently receives higher grades, predominantly “Outperform” and “Buy,” from top-tier firms. STERIS plc mostly holds “Overweight” or “Market Outperform,” with some “Equal Weight” and “Hold” ratings. Abbott’s stronger consensus likely signals greater institutional confidence, which may influence investor sentiment and valuation.
Risks specific to each company
The following categories identify the critical pressure points and systemic threats facing both firms in the 2026 market environment:
1. Market & Competition
Abbott Laboratories
- Operates in diverse healthcare products, facing intense competition in medical devices and diagnostics sectors.
STERIS plc
- Specializes in infection prevention and sterilization, competing in niche but growing medical devices and services markets.
2. Capital Structure & Debt
Abbott Laboratories
- Shows very low reported debt ratios and strong interest coverage, indicating a conservative capital structure.
STERIS plc
- Maintains moderate debt levels with solid interest coverage, balancing leverage and growth financing.
3. Stock Volatility
Abbott Laboratories
- Beta of 0.72 suggests lower volatility relative to the market, providing stability for investors.
STERIS plc
- Beta of 1.03 indicates market-level volatility, exposing investors to typical sector fluctuations.
4. Regulatory & Legal
Abbott Laboratories
- Faces regulatory scrutiny common to pharmaceuticals and diagnostics, including approvals and compliance risks.
STERIS plc
- Operates under strict healthcare regulations, with potential exposure from sterilization and medical device standards.
5. Supply Chain & Operations
Abbott Laboratories
- Complex global supply chain for pharmaceuticals and devices, vulnerable to disruptions in raw materials and manufacturing.
STERIS plc
- Relies on specialized sterilization facilities and equipment supply, susceptible to operational bottlenecks.
6. ESG & Climate Transition
Abbott Laboratories
- Increasing pressure to meet sustainability goals amid broad healthcare sector ESG initiatives.
STERIS plc
- Faces rising expectations for environmental responsibility in sterilization processes and waste management.
7. Geopolitical Exposure
Abbott Laboratories
- US-based with global operations, exposed to trade tensions and international regulatory complexities.
STERIS plc
- Ireland-based with worldwide reach, subject to EU regulations and geopolitical risks in supply and demand.
Which company shows a better risk-adjusted profile?
Abbott Laboratories’ most impactful risk stems from its complex supply chain and operational vulnerabilities. STERIS plc faces significant competitive pressures in a specialized niche but maintains a balanced debt profile. STERIS’s higher Piotroski score (8 vs. 6) and favorable liquidity ratios suggest a stronger risk-adjusted profile. Notably, Abbott’s zero current and quick ratios flag liquidity concerns, justifying cautious monitoring despite its stable market presence.
Final Verdict: Which stock to choose?
Abbott Laboratories excels as a cash-generating powerhouse with a robust gross margin and solid interest coverage. Its main point of vigilance lies in declining profitability metrics and a challenging ROIC trend, signaling pressure on value creation. It fits well in aggressive growth portfolios willing to endure near-term headwinds for long-term scale.
STERIS plc’s strategic moat lies in its niche exposure to recurring revenue streams and improving operational returns. Its financial stability outshines Abbott’s, supported by a stronger current ratio and a safer debt profile. This makes it suitable for GARP investors who seek balanced growth with moderate risk.
If you prioritize strong cash flow and scale potential, Abbott is the compelling choice due to its dominant market position despite current profitability challenges. However, if you seek better financial stability and improving returns, STERIS offers superior safety and a growing moat. Both present analytical scenarios worth aligning with your risk tolerance and investment horizon.
Disclaimer: Investment carries a risk of loss of initial capital. The past performance is not a reliable indicator of future results. Be sure to understand risks before making an investment decision.
Go Further
I encourage you to read the complete analyses of Abbott Laboratories and STERIS plc to enhance your investment decisions: